Templeton, Massachusetts (MA) income map, earnings map, and wages data
The median household income in Templeton, MA in 2022 was $87,353, which was 8.2% less than the median annual income of $94,488 across the entire state of Massachusetts. Compared to the median income of $48,482 in 2000 this represents an increase of 44.5%. The per capita income in 2022 was $42,883, which means an increase of 48.7% compared to 2000 when it was $21,994.
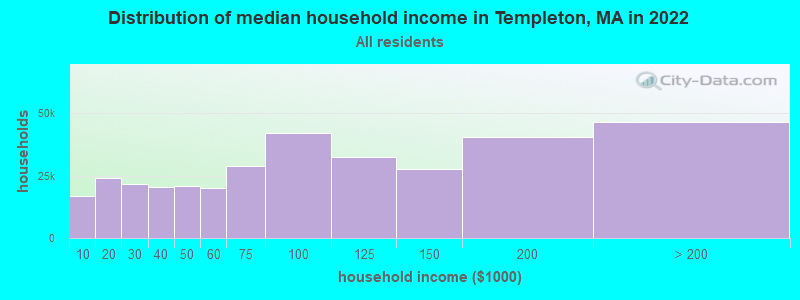
Income statistics for all residents
Median household income in Templeton, MA in 2022:| Templeton: | $87,353 |
| State: | $94,488 |
Change in median household income between 2000 and 2022:| Templeton, Massachusetts: | +80.2% |
| Massachusetts: | +87.1% |
Number of households with income < $10k:| Templeton: | 4.9% (16,804) |
| Massachusetts: | 5.2% (146,170) |
Number of households with income $10k - 20k:| Templeton: | 7.0% (23,975) |
| Massachusetts: | 6.4% (180,001) |
Number of households with income $20k - 30k:| Templeton: | 6.4% (21,834) |
| State: | 5.6% (156,667) |
Number of households with income $30k - 40k:| Templeton: | 5.9% (20,323) |
| State: | 5.6% (157,168) |
Number of households with income $40k - 50k:| Templeton: | 6.1% (20,811) |
| Massachusetts: | 5.4% (151,455) |
Number of households with income $50k - 60k:| Templeton: | 5.8% (19,926) |
| State: | 5.1% (142,726) |
Number of households with income $60k - 75k:| Templeton: | 8.4% (28,916) |
| State: | 7.6% (212,203) |
Number of households with income $75k - 100k:| Templeton: | 12.3% (42,056) |
| Massachusetts: | 11.3% (317,064) |
Number of households with income $100k - 125k:| Templeton: | 9.5% (32,644) |
| State: | 9.7% (270,603) |
Number of households with income $125k - 150k:| Templeton: | 8.1% (27,895) |
| State: | 8.0% (223,140) |
Number of households with income $150k - 200k:| Templeton: | 11.9% (40,627) |
| State: | 11.0% (308,695) |
Number of households with income > $200k:| Templeton: | 13.6% (46,569) |
| State: | 19.0% (531,884) |
Aggregate household income in Templeton in 2022: $2,582,022,840
Median family income in Templeton in 2022:| Templeton: | $97,403 |
| State: | $120,263 |
Median non-family income in Templeton in 2022:| Templeton: | $38,804 |
| State: | $55,979 |
Change in median non-family income between 2000 and 2022:| Templeton, Massachusetts: | +85.7% |
| State: | +88.0% |
Median per capita income in Templeton in 2022:| Templeton: | $42,884 |
| State: | $54,025 |
Change in median per capita income between 2000 and 2022:| Templeton, Massachusetts: | +95.0% |
| Massachusetts: | +108.2% |
Income statistics for White residents
Median household income in Templeton, MA in 2022:| Templeton: | $90,027 |
| Massachusetts: | $101,391 |
Change in median household income between 2000 and 2022:| Templeton, Massachusetts: | +85.1% |
| State: | +93.3% |
Number of households with income < $10k:| Templeton: | 4.6% (12,025) |
| State: | 4.4% (91,120) |
Number of households with income $10k - 20k:| Templeton: | 6.5% (17,195) |
| State: | 5.9% (122,055) |
Number of households with income $20k - 30k:| Templeton: | 6.1% (15,944) |
| State: | 5.1% (105,311) |
Number of households with income $30k - 40k:| Templeton: | 5.5% (14,387) |
| State: | 5.3% (110,239) |
Number of households with income $40k - 50k:| Templeton: | 5.6% (14,730) |
| State: | 5.0% (104,636) |
Number of households with income $50k - 60k:| Templeton: | 5.4% (14,284) |
| State: | 4.8% (99,486) |
Number of households with income $60k - 75k:| Templeton: | 8.4% (22,120) |
| State: | 7.5% (155,124) |
Number of households with income $75k - 100k:| Templeton: | 12.2% (32,146) |
| State: | 11.4% (236,252) |
Number of households with income $100k - 125k:| Templeton: | 10.1% (26,713) |
| State: | 9.9% (204,731) |
Number of households with income $125k - 150k:| Templeton: | 8.4% (22,030) |
| State: | 8.5% (175,324) |
Number of households with income $150k - 200k:| Templeton: | 12.5% (32,820) |
| State: | 11.7% (242,980) |
Number of households with income > $200k:| Templeton: | 14.7% (38,820) |
| State: | 20.5% (425,966) |
Aggregate household income in Templeton in 2022: $2,129,915,760
Median family income in Templeton in 2022:| Templeton: | $102,619 |
| State: | $133,153 |
Number of families with income < $10k:| Templeton: | 3.1% (38) |
| Massachusetts: | 2.0% (25,038) |
Number of families with income $10k - 20k:| Templeton: | 4.8% (59) |
| State: | 2.1% (26,403) |
Number of families with income $20k - 30k:| Templeton: | 3.6% (44) |
| State: | 2.6% (32,525) |
Number of families with income $30k - 40k:| Templeton: | 8.3% (102) |
| State: | 3.9% (48,079) |
Number of families with income $40k - 50k:| Templeton: | 7.0% (86) |
| Massachusetts: | 3.8% (46,908) |
Number of families with income $50k - 60k:| Templeton: | 8.1% (99) |
| Massachusetts: | 3.8% (46,476) |
Number of families with income $60k - 75k:| Templeton: | 13.8% (170) |
| State: | 6.4% (79,040) |
Number of families with income $75k - 100k:| Templeton: | 16.4% (202) |
| Massachusetts: | 11.1% (137,395) |
Number of families with income $100k - 125k:| Templeton: | 11.4% (140) |
| State: | 11.1% (136,771) |
Number of families with income $125k - 150k:| Templeton: | 9.0% (110) |
| State: | 10.0% (123,709) |
Number of families with income > $200k:| Templeton: | 14.5% (177) |
| Massachusetts: | 28.5% (351,887) |
Median non-family income in Templeton in 2022:| Templeton: | $40,123 |
| Massachusetts: | $59,323 |
Change in median non-family income between 2000 and 2022:| Templeton, Massachusetts: | +92.0% |
| State: | +94.3% |
Median per capita income in Templeton in 2022:| Templeton: | $45,539 |
| Massachusetts: | $60,804 |
Change in median per capita income between 2000 and 2022:| Templeton, Massachusetts: | +105.3% |
| Massachusetts: | +118.7% |
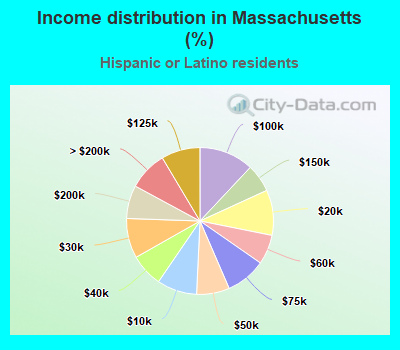
Income statistics for Hispanic or Latino residents
Median household income in Templeton, MA in 2022:| Templeton: | $159,323 |
| State: | $61,523 |
Change in median household income between 2000 and 2022:| Templeton, Massachusetts: | +116.0% |
| Massachusetts: | +125.4% |
Number of households with income < $10k:| Templeton: | 8.1% (8,154) |
| State: | 8.8% (25,307) |
Number of households with income $10k - 20k:| Templeton: | 10.5% (10,487) |
| Massachusetts: | 10.0% (28,653) |
Number of households with income $20k - 30k:| Templeton: | 10.3% (10,370) |
| Massachusetts: | 8.8% (25,189) |
Number of households with income $30k - 40k:| Templeton: | 9.5% (9,540) |
| Massachusetts: | 7.2% (20,822) |
Number of households with income $40k - 50k:| Templeton: | 7.1% (7,134) |
| State: | 7.2% (20,817) |
Number of households with income $50k - 60k:| Templeton: | 8.0% (8,012) |
| State: | 6.5% (18,748) |
Number of households with income $60k - 75k:| Templeton: | 11.1% (11,103) |
| Massachusetts: | 8.8% (25,390) |
Number of households with income $75k - 100k:| Templeton: | 14.1% (14,127) |
| Massachusetts: | 12.0% (34,488) |
Number of households with income $100k - 125k:| Templeton: | 5.7% (5,702) |
| Massachusetts: | 8.6% (24,599) |
Number of households with income $125k - 150k:| Templeton: | 8.8% (8,857) |
| State: | 6.2% (17,743) |
Number of households with income $150k - 200k:| Templeton: | 3.6% (3,561) |
| Massachusetts: | 7.3% (21,017) |
Number of households with income > $200k:| Templeton: | 3.2% (3,193) |
| State: | 8.6% (24,606) |
Aggregate household income in Templeton in 2022: $9,524,293
Median family income in Templeton in 2022:| Templeton: | $159,128 |
| Massachusetts: | $66,072 |
Number of families with income < $10k:| Templeton: | 9.9% (24) |
| State: | 6.2% (12,456) |
Number of families with income $10k - 20k:| Templeton: | 6.6% (16) |
| State: | 6.0% (12,071) |
Number of families with income $20k - 30k:| Templeton: | 8.1% (20) |
| State: | 10.1% (20,376) |
Number of families with income $30k - 40k:| Templeton: | 12.5% (31) |
| State: | 8.2% (16,470) |
Number of families with income $40k - 50k:| Templeton: | 13.8% (34) |
| State: | 7.4% (14,829) |
Number of families with income $50k - 60k:| Templeton: | 13.7% (34) |
| Massachusetts: | 7.3% (14,643) |
Number of families with income $60k - 75k:| Templeton: | 11.4% (28) |
| State: | 10.6% (21,252) |
Number of families with income $75k - 100k:| Templeton: | 11.7% (29) |
| State: | 12.0% (24,088) |
Number of families with income $100k - 125k:| Templeton: | 3.7% (9) |
| Massachusetts: | 8.9% (17,954) |
Number of families with income $125k - 150k:| Templeton: | 6.7% (16) |
| Massachusetts: | 6.9% (13,837) |
Number of families with income > $200k:| Templeton: | 2.1% (5) |
| State: | 9.3% (18,741) |
Median per capita income in Templeton in 2022:| Templeton: | $24,220 |
| Massachusetts: | $28,993 |
Change in median per capita income between 2000 and 2022:| Templeton, Massachusetts: | +110.9% |
| State: | +142.4% |
Income statistics for American Indian and Alaska Native residents
Median household income in Templeton, MA in 2022:| Templeton: | $8,165 |
| Massachusetts: | $87,730 |
Number of households with income < $10k:| Templeton: | 6.7% (31) |
| State: | 6.6% (451) |
Number of households with income $10k - 20k:| Templeton: | 7.1% (33) |
| State: | 7.0% (476) |
Number of households with income $20k - 30k:| Templeton: | 2.8% (13) |
| State: | 2.8% (192) |
Number of households with income $30k - 40k:| Templeton: | 3.2% (15) |
| Massachusetts: | 3.2% (218) |
Number of households with income $40k - 50k:| Templeton: | 3.0% (14) |
| State: | 2.9% (199) |
Number of households with income $50k - 60k:| Templeton: | 9.9% (46) |
| Massachusetts: | 9.9% (677) |
Number of households with income $60k - 75k:| Templeton: | 11.4% (53) |
| State: | 11.5% (781) |
Number of households with income $75k - 100k:| Templeton: | 9.2% (43) |
| Massachusetts: | 9.2% (629) |
Number of households with income $100k - 125k:| Templeton: | 6.0% (28) |
| State: | 6.0% (406) |
Number of households with income $125k - 150k:| Templeton: | 13.5% (63) |
| Massachusetts: | 13.5% (921) |
Number of households with income $150k - 200k:| Templeton: | 12.5% (58) |
| State: | 12.6% (859) |
Number of households with income > $200k:| Templeton: | 14.6% (68) |
| Massachusetts: | 14.7% (1,003) |
Median family income in Templeton in 2022:| Templeton: | $7,590 |
| Massachusetts: | $105,715 |
Median per capita income in Templeton in 2022:| Templeton: | $22,401 |
| Massachusetts: | $39,434 |
Change in median per capita income between 2000 and 2022:| Templeton, Massachusetts: | +80.0% |
| Massachusetts: | +148.2% |
Income statistics for Multirace residents
Number of households with income < $10k:| Templeton: | 7.4% (345) |
| Massachusetts: | 6.6% (15,127) |
Number of households with income $10k - 20k:| Templeton: | 10.3% (480) |
| State: | 9.2% (21,158) |
Number of households with income $20k - 30k:| Templeton: | 10.2% (474) |
| Massachusetts: | 7.8% (18,016) |
Number of households with income $30k - 40k:| Templeton: | 11.3% (525) |
| Massachusetts: | 7.9% (18,260) |
Number of households with income $40k - 50k:| Templeton: | 6.2% (288) |
| Massachusetts: | 5.6% (13,027) |
Number of households with income $50k - 60k:| Templeton: | 8.7% (405) |
| Massachusetts: | 5.6% (12,909) |
Number of households with income $60k - 75k:| Templeton: | 8.2% (379) |
| State: | 9.0% (20,800) |
Number of households with income $75k - 100k:| Templeton: | 13.5% (627) |
| State: | 12.1% (27,875) |
Number of households with income $100k - 125k:| Templeton: | 6.2% (287) |
| State: | 8.1% (18,754) |
Number of households with income $125k - 150k:| Templeton: | 6.4% (298) |
| Massachusetts: | 6.8% (15,621) |
Number of households with income $150k - 200k:| Templeton: | 5.9% (275) |
| Massachusetts: | 9.4% (21,618) |
Number of households with income > $200k:| Templeton: | 5.6% (259) |
| Massachusetts: | 12.0% (27,592) |
Median per capita income in Templeton in 2022:| Templeton: | $4,231 |
| State: | $34,029 |
Change in median per capita income between 2000 and 2022:| Templeton, Massachusetts: | +104.0% |
| Massachusetts: | +132.1% |