Sutton, Massachusetts (MA) income map, earnings map, and wages data
The median household income in Sutton, MA in 2022 was $135,386, which was 30.2% greater than the median annual income of $94,488 across the entire state of Massachusetts. Compared to the median income of $75,141 in 2000 this represents an increase of 44.5%. The per capita income in 2022 was $53,599, which means an increase of 48.7% compared to 2000 when it was $27,490.
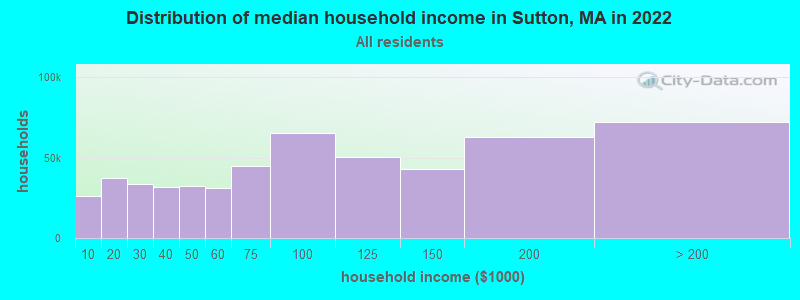
Income statistics for all residents
Median household income in Sutton, MA in 2022:| Sutton: | $135,387 |
| Massachusetts: | $94,488 |
Change in median household income between 2000 and 2022:| Sutton, Massachusetts: | +80.2% |
| State: | +87.1% |
Number of households with income < $10k:| Sutton: | 4.9% (26,044) |
| State: | 5.2% (146,170) |
Number of households with income $10k - 20k:| Sutton: | 7.0% (37,158) |
| State: | 6.4% (180,001) |
Number of households with income $20k - 30k:| Sutton: | 6.4% (33,841) |
| State: | 5.6% (156,667) |
Number of households with income $30k - 40k:| Sutton: | 5.9% (31,498) |
| State: | 5.6% (157,168) |
Number of households with income $40k - 50k:| Sutton: | 6.1% (32,254) |
| Massachusetts: | 5.4% (151,455) |
Number of households with income $50k - 60k:| Sutton: | 5.8% (30,883) |
| Massachusetts: | 5.1% (142,726) |
Number of households with income $60k - 75k:| Sutton: | 8.4% (44,816) |
| Massachusetts: | 7.6% (212,203) |
Number of households with income $75k - 100k:| Sutton: | 12.3% (65,182) |
| Massachusetts: | 11.3% (317,064) |
Number of households with income $100k - 125k:| Sutton: | 9.5% (50,595) |
| State: | 9.7% (270,603) |
Number of households with income $125k - 150k:| Sutton: | 8.1% (43,233) |
| Massachusetts: | 8.0% (223,140) |
Number of households with income $150k - 200k:| Sutton: | 11.9% (62,968) |
| State: | 11.0% (308,695) |
Number of households with income > $200k:| Sutton: | 13.6% (72,176) |
| Massachusetts: | 19.0% (531,884) |
Aggregate household income in Sutton in 2022: $4,019,884,605
Median family income in Sutton in 2022:| Sutton: | $149,041 |
| Massachusetts: | $120,263 |
Median non-family income in Sutton in 2022:| Sutton: | $59,497 |
| State: | $55,979 |
Change in median non-family income between 2000 and 2022:| Sutton, Massachusetts: | +85.7% |
| State: | +88.0% |
Median per capita income in Sutton in 2022:| Sutton: | $53,600 |
| State: | $54,025 |
Change in median per capita income between 2000 and 2022:| Sutton, Massachusetts: | +95.0% |
| State: | +108.2% |
Income statistics for White residents
Median household income in Sutton, MA in 2022:| Sutton: | $139,444 |
| State: | $101,391 |
Change in median household income between 2000 and 2022:| Sutton, Massachusetts: | +85.1% |
| State: | +93.3% |
Number of households with income < $10k:| Sutton: | 4.6% (18,625) |
| State: | 4.4% (91,120) |
Number of households with income $10k - 20k:| Sutton: | 6.5% (26,632) |
| State: | 5.9% (122,055) |
Number of households with income $20k - 30k:| Sutton: | 6.1% (24,696) |
| State: | 5.1% (105,311) |
Number of households with income $30k - 40k:| Sutton: | 5.5% (22,283) |
| State: | 5.3% (110,239) |
Number of households with income $40k - 50k:| Sutton: | 5.6% (22,816) |
| State: | 5.0% (104,636) |
Number of households with income $50k - 60k:| Sutton: | 5.4% (22,124) |
| State: | 4.8% (99,486) |
Number of households with income $60k - 75k:| Sutton: | 8.4% (34,262) |
| Massachusetts: | 7.5% (155,124) |
Number of households with income $75k - 100k:| Sutton: | 12.2% (49,792) |
| State: | 11.4% (236,252) |
Number of households with income $100k - 125k:| Sutton: | 10.1% (41,377) |
| Massachusetts: | 9.9% (204,731) |
Number of households with income $125k - 150k:| Sutton: | 8.4% (34,123) |
| State: | 8.5% (175,324) |
Number of households with income $150k - 200k:| Sutton: | 12.5% (50,835) |
| Massachusetts: | 11.7% (242,980) |
Number of households with income > $200k:| Sutton: | 14.7% (60,128) |
| Massachusetts: | 20.5% (425,966) |
Aggregate household income in Sutton in 2022: $3,307,226,484
Median family income in Sutton in 2022:| Sutton: | $156,658 |
| State: | $133,153 |
Number of families with income < $10k:| Sutton: | 0.5% (13) |
| State: | 2.0% (25,038) |
Number of families with income $10k - 20k:| Sutton: | 1.2% (35) |
| State: | 2.1% (26,403) |
Number of families with income $20k - 30k:| Sutton: | 1.9% (54) |
| State: | 2.6% (32,525) |
Number of families with income $30k - 40k:| Sutton: | 1.4% (38) |
| State: | 3.9% (48,079) |
Number of families with income $40k - 50k:| Sutton: | 2.1% (59) |
| State: | 3.8% (46,908) |
Number of families with income $50k - 60k:| Sutton: | 2.1% (59) |
| State: | 3.8% (46,476) |
Number of families with income $60k - 75k:| Sutton: | 6.9% (193) |
| State: | 6.4% (79,040) |
Number of families with income $75k - 100k:| Sutton: | 14.3% (399) |
| Massachusetts: | 11.1% (137,395) |
Number of families with income $100k - 125k:| Sutton: | 17.2% (481) |
| Massachusetts: | 11.1% (136,771) |
Number of families with income $125k - 150k:| Sutton: | 7.8% (218) |
| Massachusetts: | 10.0% (123,709) |
Number of families with income $150k - 200k:| Sutton: | 17.0% (474) |
| State: | 14.7% (181,602) |
Number of families with income > $200k:| Sutton: | 27.7% (774) |
| State: | 28.5% (351,887) |
Median non-family income in Sutton in 2022:| Sutton: | $61,911 |
| State: | $59,323 |
Change in median non-family income between 2000 and 2022:| Sutton, Massachusetts: | +92.0% |
| State: | +94.3% |
Median per capita income in Sutton in 2022:| Sutton: | $57,170 |
| Massachusetts: | $60,804 |
Change in median per capita income between 2000 and 2022:| Sutton, Massachusetts: | +105.3% |
| State: | +118.7% |
Income statistics for Black or African American residents
Median household income in Sutton, MA in 2022:| Sutton: | $136,669 |
| State: | $63,189 |
Change in median household income between 2000 and 2022:| Sutton, Massachusetts: | +69.8% |
| State: | +87.4% |
Number of households with income < $10k:| Sutton: | 7.3% (2,593) |
| State: | 9.1% (15,797) |
Number of households with income $10k - 20k:| Sutton: | 11.9% (4,236) |
| Massachusetts: | 9.4% (16,267) |
Number of households with income $20k - 30k:| Sutton: | 9.8% (3,490) |
| State: | 7.8% (13,520) |
Number of households with income $30k - 40k:| Sutton: | 3.3% (1,158) |
| State: | 8.3% (14,412) |
Number of households with income $40k - 50k:| Sutton: | 13.5% (4,800) |
| Massachusetts: | 7.9% (13,790) |
Number of households with income $50k - 60k:| Sutton: | 5.8% (2,052) |
| State: | 5.8% (10,041) |
Number of households with income $60k - 75k:| Sutton: | 10.7% (3,817) |
| State: | 8.5% (14,822) |
Number of households with income $75k - 100k:| Sutton: | 13.0% (4,635) |
| Massachusetts: | 11.0% (19,122) |
Number of households with income $100k - 125k:| Sutton: | 7.5% (2,676) |
| State: | 8.4% (14,575) |
Number of households with income $125k - 150k:| Sutton: | 5.0% (1,768) |
| State: | 6.0% (10,429) |
Number of households with income $150k - 200k:| Sutton: | 7.3% (2,579) |
| State: | 7.2% (12,539) |
Number of households with income > $200k:| Sutton: | 4.9% (1,756) |
| State: | 10.5% (18,185) |
Aggregate household income in Sutton in 2022: $2,284,025
Median family income in Sutton in 2022:| Sutton: | $132,060 |
| State: | $79,815 |
Number of families with income $75k - 100k:| Sutton: | 100.0% (25) |
| State: | 11.5% (12,654) |
Median per capita income in Sutton in 2022:| Sutton: | $35,388 |
| State: | $33,524 |
Change in median per capita income between 2000 and 2022:| Sutton, Massachusetts: | +95.7% |
| State: | +109.4% |
Income statistics for Asian residents
Median household income in Sutton, MA in 2022:| Sutton: | $6,237 |
| State: | $117,855 |
Change in median household income between 2000 and 2022:| Sutton, Massachusetts: | +149.6% |
| Massachusetts: | +129.9% |
Number of households with income < $10k:| Sutton: | 5.8% (40) |
| State: | 6.8% (11,982) |
Number of households with income $10k - 20k:| Sutton: | 5.8% (40) |
| Massachusetts: | 4.8% (8,376) |
Number of households with income $20k - 30k:| Sutton: | 1.9% (13) |
| State: | 3.7% (6,558) |
Number of households with income $30k - 40k:| Sutton: | 3.6% (25) |
| State: | 3.3% (5,748) |
Number of households with income $40k - 50k:| Sutton: | 4.9% (34) |
| State: | 4.1% (7,192) |
Number of households with income $50k - 60k:| Sutton: | 3.5% (24) |
| State: | 5.0% (8,734) |
Number of households with income $60k - 75k:| Sutton: | 4.3% (30) |
| State: | 5.8% (10,203) |
Number of households with income $75k - 100k:| Sutton: | 6.1% (42) |
| Massachusetts: | 8.6% (15,154) |
Number of households with income $100k - 125k:| Sutton: | 9.7% (67) |
| Massachusetts: | 10.8% (18,942) |
Number of households with income $125k - 150k:| Sutton: | 8.1% (56) |
| State: | 8.0% (14,037) |
Number of households with income $150k - 200k:| Sutton: | 21.1% (146) |
| State: | 12.5% (21,856) |
Number of households with income > $200k:| Sutton: | 25.3% (175) |
| State: | 26.6% (46,694) |
Median non-family income in Sutton in 2022:| Sutton: | $6,702 |
| Massachusetts: | $71,440 |
Median per capita income in Sutton in 2022:| Sutton: | $71,242 |
| Massachusetts: | $58,900 |
Income statistics for Hispanic or Latino residents
Median household income in Sutton, MA in 2022:| Sutton: | $173,879 |
| State: | $61,523 |
Change in median household income between 2000 and 2022:| Sutton, Massachusetts: | +116.0% |
| State: | +125.4% |
Number of households with income < $10k:| Sutton: | 8.1% (8,899) |
| State: | 8.8% (25,307) |
Number of households with income $10k - 20k:| Sutton: | 10.5% (11,445) |
| State: | 10.0% (28,653) |
Number of households with income $20k - 30k:| Sutton: | 10.3% (11,318) |
| State: | 8.8% (25,189) |
Number of households with income $30k - 40k:| Sutton: | 9.5% (10,412) |
| State: | 7.2% (20,822) |
Number of households with income $40k - 50k:| Sutton: | 7.1% (7,786) |
| State: | 7.2% (20,817) |
Number of households with income $50k - 60k:| Sutton: | 8.0% (8,744) |
| Massachusetts: | 6.5% (18,748) |
Number of households with income $60k - 75k:| Sutton: | 11.1% (12,117) |
| State: | 8.8% (25,390) |
Number of households with income $75k - 100k:| Sutton: | 14.1% (15,417) |
| State: | 12.0% (34,488) |
Number of households with income $100k - 125k:| Sutton: | 5.7% (6,223) |
| Massachusetts: | 8.6% (24,599) |
Number of households with income $125k - 150k:| Sutton: | 8.8% (9,666) |
| State: | 6.2% (17,743) |
Number of households with income $150k - 200k:| Sutton: | 3.6% (3,887) |
| Massachusetts: | 7.3% (21,017) |
Number of households with income > $200k:| Sutton: | 3.2% (3,484) |
| Massachusetts: | 8.6% (24,606) |
Aggregate household income in Sutton in 2022: $2,345,369
Median non-family income in Sutton in 2022:| Sutton: | $157,644 |
| Massachusetts: | $37,563 |
Change in median non-family income between 2000 and 2022:| Sutton, Massachusetts: | +95.9% |
| Massachusetts: | +115.0% |
Median per capita income in Sutton in 2022:| Sutton: | $36,001 |
| State: | $28,993 |
Change in median per capita income between 2000 and 2022:| Sutton, Massachusetts: | +110.9% |
| State: | +142.4% |
Income statistics for American Indian and Alaska Native residents
Number of households with income < $10k:| Sutton: | 6.7% (53) |
| State: | 6.6% (451) |
Number of households with income $10k - 20k:| Sutton: | 6.9% (55) |
| State: | 7.0% (476) |
Number of households with income $20k - 30k:| Sutton: | 2.9% (23) |
| Massachusetts: | 2.8% (192) |
Number of households with income $30k - 40k:| Sutton: | 3.2% (25) |
| Massachusetts: | 3.2% (218) |
Number of households with income $40k - 50k:| Sutton: | 2.9% (23) |
| Massachusetts: | 2.9% (199) |
Number of households with income $50k - 60k:| Sutton: | 10.0% (79) |
| State: | 9.9% (677) |
Number of households with income $60k - 75k:| Sutton: | 11.5% (91) |
| State: | 11.5% (781) |
Number of households with income $75k - 100k:| Sutton: | 9.2% (73) |
| State: | 9.2% (629) |
Number of households with income $100k - 125k:| Sutton: | 5.9% (47) |
| State: | 6.0% (406) |
Number of households with income $125k - 150k:| Sutton: | 13.5% (107) |
| Massachusetts: | 13.5% (921) |
Number of households with income $150k - 200k:| Sutton: | 12.6% (100) |
| Massachusetts: | 12.6% (859) |
Number of households with income > $200k:| Sutton: | 14.8% (117) |
| State: | 14.7% (1,003) |
Median per capita income in Sutton in 2022:| Sutton: | $3,329 |
| State: | $39,434 |
Change in median per capita income between 2000 and 2022:| Sutton, Massachusetts: | +80.0% |
| Massachusetts: | +148.2% |
Income statistics for Multirace residents
Median household income in Sutton, MA in 2022:| Sutton: | $6,927 |
| State: | $71,552 |
Change in median household income between 2000 and 2022:| Sutton, Massachusetts: | +84.7% |
| Massachusetts: | +109.0% |
Number of households with income < $10k:| Sutton: | 7.4% (258) |
| Massachusetts: | 6.6% (15,127) |
Number of households with income $10k - 20k:| Sutton: | 10.3% (358) |
| Massachusetts: | 9.2% (21,158) |
Number of households with income $20k - 30k:| Sutton: | 10.2% (355) |
| Massachusetts: | 7.8% (18,016) |
Number of households with income $30k - 40k:| Sutton: | 11.3% (392) |
| State: | 7.9% (18,260) |
Number of households with income $40k - 50k:| Sutton: | 6.2% (215) |
| State: | 5.6% (13,027) |
Number of households with income $50k - 60k:| Sutton: | 8.7% (303) |
| Massachusetts: | 5.6% (12,909) |
Number of households with income $60k - 75k:| Sutton: | 8.2% (283) |
| State: | 9.0% (20,800) |
Number of households with income $75k - 100k:| Sutton: | 13.5% (468) |
| State: | 12.1% (27,875) |
Number of households with income $100k - 125k:| Sutton: | 6.2% (214) |
| Massachusetts: | 8.1% (18,754) |
Number of households with income $125k - 150k:| Sutton: | 6.4% (223) |
| State: | 6.8% (15,621) |
Number of households with income $150k - 200k:| Sutton: | 5.9% (206) |
| Massachusetts: | 9.4% (21,618) |
Number of households with income > $200k:| Sutton: | 5.6% (193) |
| State: | 12.0% (27,592) |
Aggregate household income in Sutton in 2022: $399,010
Median family income in Sutton in 2022:| Sutton: | $6,785 |
| State: | $78,380 |
Number of families with income < $10k:| Sutton: | 100.0% (21) |
| State: | 4.5% (7,017) |
Median per capita income in Sutton in 2022:| Sutton: | $14,301 |
| State: | $34,029 |
Change in median per capita income between 2000 and 2022:| Sutton, Massachusetts: | +104.0% |
| Massachusetts: | +132.1% |