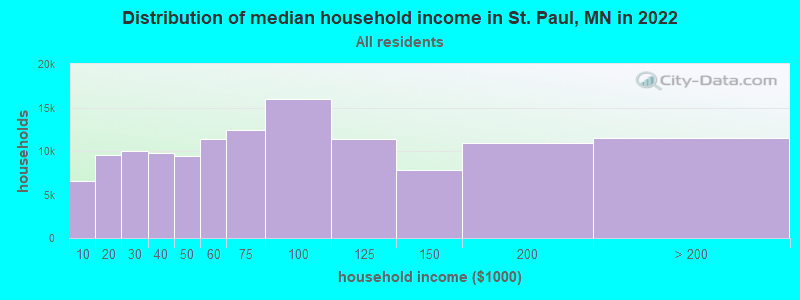
The median household income in St. Paul, MN in 2022 was $67,725, which was 21.6% less than the median annual income of $82,338 across the entire state of Minnesota. Compared to the median income of $38,774 in 2000 this represents an increase of 42.7%. The per capita income in 2022 was $41,137, which means an increase of 50.9% compared to 2000 when it was $20,216.
Whole page based on the data from 2000 / 2022 when the population of St. Paul, Minnesota was 287,151 / 303,160
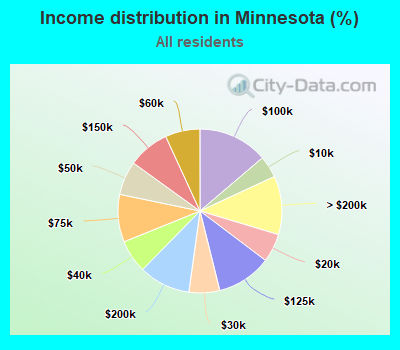
Income statistics for all residents
Median household income in St. Paul, MN in 2022:
St. Paul:
$67,725
State:
$82,338
Change in median household income between 2000 and 2022:
St. Paul, Minnesota:
+74.7%
State:
+74.8%
Number of households with income < $10k:
St. Paul:
5.2% (6,526)
Minnesota:
4.3% (100,518)
Number of households with income $10k - 20k:
St. Paul:
7.5% (9,558)
Minnesota:
5.6% (130,945)
Number of households with income $20k - 30k:
St. Paul:
7.9% (9,967)
Minnesota:
6.1% (140,637)
Number of households with income $30k - 40k:
St. Paul:
7.7% (9,751)
State:
6.5% (151,862)
Number of households with income $40k - 50k:
St. Paul:
7.4% (9,405)
Minnesota:
6.7% (154,930)
Number of households with income $50k - 60k:
St. Paul:
8.9% (11,325)
State:
6.9% (159,181)
Number of households with income $60k - 75k:
St. Paul:
9.8% (12,395)
Minnesota:
9.4% (218,220)
Number of households with income $75k - 100k:
St. Paul:
12.7% (16,031)
State:
13.8% (319,951)
Number of households with income $100k - 125k:
St. Paul:
9.0% (11,415)
State:
10.8% (251,243)
Number of households with income $125k - 150k:
St. Paul:
6.2% (7,858)
State:
8.2% (190,349)
Number of households with income $150k - 200k:
St. Paul:
8.6% (10,877)
State:
10.2% (236,018)
Number of households with income > $200k:
St. Paul:
9.1% (11,546)
State:
11.6% (268,336)
Aggregate household income in St. Paul in 2022: $12,472,598,200
Median family income in St. Paul in 2022:
St. Paul:
$87,494
State:
$105,324
Number of families with income < $10k:
St. Paul:
4.2% (2,776)
Minnesota:
2.2% (31,728)
Number of families with income $10k - 20k:
St. Paul:
4.0% (2,593)
Minnesota:
2.5% (36,635)
Number of families with income $20k - 30k:
St. Paul:
5.2% (3,380)
Minnesota:
3.5% (50,742)
Number of families with income $30k - 40k:
St. Paul:
6.2% (4,037)
Minnesota:
4.4% (64,281)
Number of families with income $40k - 50k:
St. Paul:
7.0% (4,566)
State:
5.2% (76,436)
Number of families with income $50k - 60k:
St. Paul:
8.1% (5,272)
State:
5.7% (83,050)
Number of families with income $60k - 75k:
St. Paul:
8.1% (5,302)
State:
8.8% (127,783)
Number of families with income $75k - 100k:
St. Paul:
13.3% (8,741)
Minnesota:
14.7% (214,426)
Number of families with income $100k - 125k:
St. Paul:
11.0% (7,213)
Minnesota:
13.1% (190,094)
Number of families with income $125k - 150k:
St. Paul:
7.1% (4,643)
Minnesota:
10.3% (149,830)
Number of families with income $150k - 200k:
St. Paul:
11.2% (7,352)
State:
13.6% (197,479)
Number of families with income > $200k:
St. Paul:
14.7% (9,612)
State:
16.1% (233,828)
Median non-family income in St. Paul in 2022:
St. Paul:
$51,598
Minnesota:
$48,461
Change in median non-family income between 2000 and 2022:
St. Paul, Minnesota:
+80.6%
State:
+73.6%
Median per capita income in St. Paul in 2022:
St. Paul:
$41,137
Minnesota:
$45,021
Change in median per capita income between 2000 and 2022:
St. Paul, Minnesota:
+103.5%
Minnesota:
+94.1%
Income statistics for White residents
Median household income in St. Paul, MN in 2022:
St. Paul:
$78,906
State:
$85,697
Change in median household income between 2000 and 2022:
St. Paul, Minnesota:
+87.1%
State:
+77.5%
Number of households with income < $10k:
St. Paul:
3.1% (2,478)
State:
3.9% (74,145)
Number of households with income $10k - 20k:
St. Paul:
5.5% (4,482)
State:
5.1% (97,289)
Number of households with income $20k - 30k:
St. Paul:
7.0% (5,663)
State:
5.8% (111,536)
Number of households with income $30k - 40k:
St. Paul:
5.3% (4,254)
State:
6.2% (118,402)
Number of households with income $40k - 50k:
St. Paul:
7.2% (5,808)
State:
6.6% (126,331)
Number of households with income $50k - 60k:
St. Paul:
9.8% (7,922)
State:
6.8% (129,961)
Number of households with income $60k - 75k:
St. Paul:
10.2% (8,271)
State:
9.4% (181,337)
Number of households with income $75k - 100k:
St. Paul:
14.3% (11,551)
State:
13.8% (265,776)
Number of households with income $100k - 125k:
St. Paul:
10.6% (8,574)
State:
11.2% (214,803)
Number of households with income $125k - 150k:
St. Paul:
6.5% (5,228)
Minnesota:
8.6% (164,715)
Number of households with income $150k - 200k:
St. Paul:
9.3% (7,504)
State:
10.6% (203,283)
Number of households with income > $200k:
St. Paul:
11.3% (9,128)
State:
12.2% (233,694)
Aggregate household income in St. Paul in 2022: $8,964,772,800
Median family income in St. Paul in 2022:
St. Paul:
$108,665
Minnesota:
$110,049
Number of families with income < $10k:
St. Paul:
1.1% (408)
State:
1.5% (17,407)
Number of families with income $10k - 20k:
St. Paul:
2.4% (918)
State:
1.9% (22,955)
Number of families with income $20k - 30k:
St. Paul:
3.0% (1,169)
State:
2.9% (34,913)
Number of families with income $30k - 40k:
St. Paul:
1.9% (730)
Minnesota:
3.7% (44,598)
Number of families with income $40k - 50k:
St. Paul:
5.7% (2,191)
State:
4.9% (58,683)
Number of families with income $50k - 60k:
St. Paul:
7.4% (2,864)
State:
5.4% (64,644)
Number of families with income $60k - 75k:
St. Paul:
9.1% (3,534)
State:
8.9% (105,839)
Number of families with income $75k - 100k:
St. Paul:
14.4% (5,578)
Minnesota:
14.8% (177,106)
Number of families with income $100k - 125k:
St. Paul:
13.6% (5,290)
Minnesota:
13.6% (162,292)
Number of families with income $125k - 150k:
St. Paul:
7.7% (2,990)
State:
10.9% (130,417)
Number of families with income $150k - 200k:
St. Paul:
13.7% (5,326)
Minnesota:
14.3% (171,257)
Number of families with income > $200k:
St. Paul:
20.0% (7,764)
State:
17.1% (204,721)
Median non-family income in St. Paul in 2022:
St. Paul:
$55,392
State:
$49,920
Change in median non-family income between 2000 and 2022:
St. Paul, Minnesota:
+83.9%
Minnesota:
+76.0%
Median per capita income in St. Paul in 2022:
St. Paul:
$55,563
Minnesota:
$49,507
Change in median per capita income between 2000 and 2022:
St. Paul, Minnesota:
+122.5%
Minnesota:
+103.3%
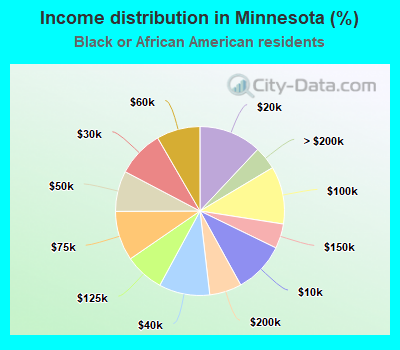
Income statistics for Black or African American residents
Median household income in St. Paul, MN in 2022:
St. Paul:
$36,928
State:
$51,320
Change in median household income between 2000 and 2022:
St. Paul, Minnesota:
+46.1%
State:
+77.4%
Number of households with income < $10k:
St. Paul:
13.9% (2,635)
State:
9.8% (13,122)
Number of households with income $10k - 20k:
St. Paul:
17.0% (3,212)
State:
12.0% (16,076)
Number of households with income $20k - 30k:
St. Paul:
9.3% (1,765)
Minnesota:
8.9% (11,986)
Number of households with income $30k - 40k:
St. Paul:
12.1% (2,286)
State:
9.8% (13,064)
Number of households with income $40k - 50k:
St. Paul:
8.1% (1,543)
State:
7.8% (10,426)
Number of households with income $50k - 60k:
St. Paul:
8.0% (1,522)
Minnesota:
8.4% (11,191)
Number of households with income $60k - 75k:
St. Paul:
8.6% (1,634)
Minnesota:
9.5% (12,717)
Number of households with income $75k - 100k:
St. Paul:
6.5% (1,231)
State:
11.0% (14,800)
Number of households with income $100k - 125k:
St. Paul:
5.7% (1,080)
State:
7.5% (10,088)
Number of households with income $125k - 150k:
St. Paul:
3.0% (564)
Minnesota:
4.7% (6,321)
Number of households with income $150k - 200k:
St. Paul:
4.9% (921)
State:
6.1% (8,240)
Number of households with income > $200k:
St. Paul:
2.9% (543)
State:
4.4% (5,958)
Aggregate household income in St. Paul in 2022: $1,043,645,900
Median family income in St. Paul in 2022:
St. Paul:
$45,005
State:
$61,475
Number of families with income < $10k:
St. Paul:
9.6% (843)
State:
7.6% (6,143)
Number of families with income $10k - 20k:
St. Paul:
5.6% (492)
State:
7.0% (5,667)
Number of families with income $20k - 30k:
St. Paul:
7.8% (688)
Minnesota:
8.2% (6,632)
Number of families with income $30k - 40k:
St. Paul:
20.1% (1,777)
State:
9.4% (7,539)
Number of families with income $40k - 50k:
St. Paul:
11.0% (969)
Minnesota:
7.9% (6,354)
Number of families with income $50k - 60k:
St. Paul:
15.4% (1,361)
State:
8.7% (7,014)
Number of families with income $60k - 75k:
St. Paul:
5.0% (439)
Minnesota:
9.4% (7,570)
Number of families with income $75k - 100k:
St. Paul:
7.6% (669)
State:
12.0% (9,645)
Number of families with income $100k - 125k:
St. Paul:
7.6% (670)
State:
10.6% (8,487)
Number of families with income $125k - 150k:
St. Paul:
2.8% (245)
State:
6.3% (5,073)
Number of families with income $150k - 200k:
St. Paul:
2.7% (234)
State:
6.8% (5,454)
Number of families with income > $200k:
St. Paul:
4.9% (432)
State:
6.0% (4,815)
Median non-family income in St. Paul in 2022:
St. Paul:
$24,088
Minnesota:
$34,487
Change in median non-family income between 2000 and 2022:
St. Paul, Minnesota:
+23.6%
State:
+60.8%
Median per capita income in St. Paul in 2022:
St. Paul:
$22,723
State:
$25,146
Change in median per capita income between 2000 and 2022:
St. Paul, Minnesota:
+81.8%
Minnesota:
+83.0%
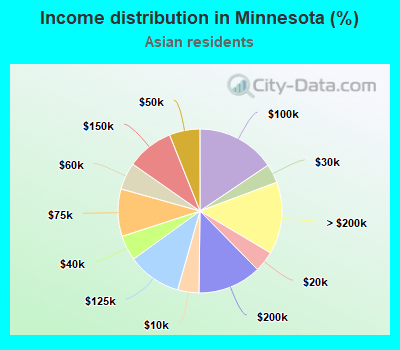
Income statistics for Asian residents
Median household income in St. Paul, MN in 2022:
St. Paul:
$69,878
State:
$93,773
Change in median household income between 2000 and 2022:
St. Paul, Minnesota:
+117.4%
Minnesota:
+106.0%
Number of households with income < $10k:
St. Paul:
3.8% (495)
State:
4.2% (3,886)
Number of households with income $10k - 20k:
St. Paul:
7.1% (926)
State:
4.1% (3,821)
Number of households with income $20k - 30k:
St. Paul:
4.4% (574)
State:
3.8% (3,485)
Number of households with income $30k - 40k:
St. Paul:
8.7% (1,137)
State:
5.0% (4,620)
Number of households with income $40k - 50k:
St. Paul:
8.9% (1,160)
Minnesota:
6.0% (5,609)
Number of households with income $50k - 60k:
St. Paul:
6.5% (847)
State:
5.4% (4,977)
Number of households with income $60k - 75k:
St. Paul:
11.6% (1,510)
State:
9.3% (8,666)
Number of households with income $75k - 100k:
St. Paul:
14.7% (1,920)
State:
15.6% (14,466)
Number of households with income $100k - 125k:
St. Paul:
10.2% (1,332)
State:
10.7% (9,893)
Number of households with income $125k - 150k:
St. Paul:
7.2% (936)
Minnesota:
9.3% (8,600)
Number of households with income $150k - 200k:
St. Paul:
10.1% (1,319)
Minnesota:
12.6% (11,662)
Number of households with income > $200k:
St. Paul:
6.6% (865)
Minnesota:
14.2% (13,207)
Aggregate household income in St. Paul in 2022: $1,226,498,500
Median family income in St. Paul in 2022:
St. Paul:
$72,911
Minnesota:
$105,412
Number of families with income < $10k:
St. Paul:
6.5% (658)
Minnesota:
3.3% (2,246)
Number of families with income $10k - 20k:
St. Paul:
8.5% (856)
Minnesota:
3.1% (2,124)
Number of families with income $20k - 30k:
St. Paul:
3.5% (348)
State:
3.2% (2,190)
Number of families with income $30k - 40k:
St. Paul:
9.2% (922)
State:
5.4% (3,668)
Number of families with income $40k - 50k:
St. Paul:
7.0% (702)
State:
4.8% (3,312)
Number of families with income $50k - 60k:
St. Paul:
7.7% (771)
State:
5.0% (3,388)
Number of families with income $60k - 75k:
St. Paul:
8.8% (885)
State:
8.6% (5,887)
Number of families with income $75k - 100k:
St. Paul:
16.7% (1,683)
Minnesota:
13.9% (9,500)
Number of families with income $100k - 125k:
St. Paul:
9.8% (989)
State:
11.4% (7,777)
Number of families with income $125k - 150k:
St. Paul:
5.9% (596)
State:
9.8% (6,734)
Number of families with income $150k - 200k:
St. Paul:
8.5% (851)
State:
14.4% (9,877)
Number of families with income > $200k:
St. Paul:
7.9% (789)
State:
17.1% (11,714)
Median non-family income in St. Paul in 2022:
St. Paul:
$42,265
State:
$58,400
Median per capita income in St. Paul in 2022:
St. Paul:
$24,991
State:
$39,496
Income statistics for Hispanic or Latino residents
Median household income in St. Paul, MN in 2022:
St. Paul:
$51,788
State:
$63,399
Change in median household income between 2000 and 2022:
St. Paul, Minnesota:
+53.4%
State:
+76.4%
Number of households with income < $10k:
St. Paul:
2.7% (258)
Minnesota:
4.0% (3,834)
Number of households with income $10k - 20k:
St. Paul:
8.6% (813)
State:
6.1% (5,874)
Number of households with income $20k - 30k:
St. Paul:
15.1% (1,437)
State:
9.9% (9,526)
Number of households with income $30k - 40k:
St. Paul:
12.1% (1,151)
Minnesota:
10.1% (9,710)
Number of households with income $40k - 50k:
St. Paul:
8.6% (816)
State:
8.0% (7,724)
Number of households with income $50k - 60k:
St. Paul:
10.3% (979)
State:
9.6% (9,248)
Number of households with income $60k - 75k:
St. Paul:
9.8% (928)
State:
10.8% (10,444)
Number of households with income $75k - 100k:
St. Paul:
8.8% (838)
Minnesota:
15.0% (14,464)
Number of households with income $100k - 125k:
St. Paul:
1.2% (117)
State:
7.6% (7,348)
Number of households with income $125k - 150k:
St. Paul:
7.1% (671)
State:
5.1% (4,890)
Number of households with income $150k - 200k:
St. Paul:
8.7% (831)
State:
6.5% (6,257)
Number of households with income > $200k:
St. Paul:
7.0% (663)
Minnesota:
7.3% (7,057)
Aggregate household income in St. Paul in 2022: $858,513,900
Median family income in St. Paul in 2022:
St. Paul:
$52,793
State:
$67,562
Number of families with income < $10k:
St. Paul:
6.7% (400)
Minnesota:
5.9% (3,967)
Number of families with income $10k - 20k:
St. Paul:
3.1% (187)
State:
4.1% (2,790)
Number of families with income $20k - 30k:
St. Paul:
20.2% (1,207)
Minnesota:
8.4% (5,627)
Number of families with income $30k - 40k:
St. Paul:
7.8% (468)
Minnesota:
8.3% (5,564)
Number of families with income $40k - 50k:
St. Paul:
10.4% (622)
State:
8.7% (5,826)
Number of families with income $50k - 60k:
St. Paul:
3.8% (228)
State:
9.2% (6,189)
Number of families with income $60k - 75k:
St. Paul:
6.1% (362)
State:
9.5% (6,388)
Number of families with income $75k - 100k:
St. Paul:
11.9% (712)
State:
16.7% (11,230)
Number of families with income $100k - 125k:
St. Paul:
1.9% (112)
State:
7.4% (4,975)
Number of families with income $125k - 150k:
St. Paul:
6.8% (405)
State:
5.3% (3,580)
Number of families with income $150k - 200k:
St. Paul:
12.8% (764)
State:
8.6% (5,795)
Number of families with income > $200k:
St. Paul:
8.3% (498)
Minnesota:
7.9% (5,338)
Median non-family income in St. Paul in 2022:
St. Paul:
$49,340
State:
$41,691
Change in median non-family income between 2000 and 2022:
St. Paul, Minnesota:
+113.9%
Minnesota:
+60.4%
Median per capita income in St. Paul in 2022:
St. Paul:
$30,637
Minnesota:
$27,748
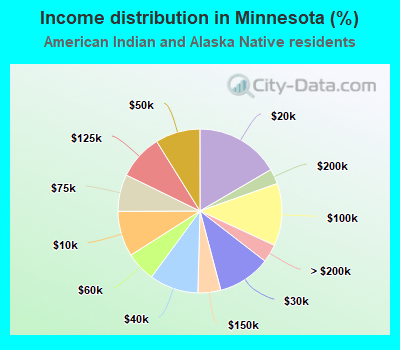
Income statistics for American Indian and Alaska Native residents
Median household income in St. Paul, MN in 2022:
St. Paul:
$32,184
State:
$45,227
Change in median household income between 2000 and 2022:
St. Paul, Minnesota:
+9.6%
State:
+58.5%
Number of households with income < $10k:
St. Paul:
9.4% (74)
State:
9.0% (1,578)
Number of households with income $10k - 20k:
St. Paul:
22.2% (175)
Minnesota:
16.6% (2,922)
Number of households with income $20k - 30k:
St. Paul:
16.7% (132)
Minnesota:
10.4% (1,837)
Number of households with income $30k - 40k:
St. Paul:
7.4% (58)
State:
9.7% (1,699)
Number of households with income $40k - 50k:
St. Paul:
7.0% (55)
State:
8.8% (1,557)
Number of households with income $50k - 60k:
St. Paul:
3.7% (29)
Minnesota:
5.9% (1,033)
Number of households with income $60k - 75k:
St. Paul:
2.2% (17)
State:
7.3% (1,284)
Number of households with income $75k - 100k:
St. Paul:
5.4% (43)
Minnesota:
12.3% (2,163)
Number of households with income $100k - 125k:
St. Paul:
14.3% (113)
Minnesota:
8.9% (1,571)
Number of households with income $125k - 150k:
St. Paul:
2.3% (18)
State:
4.5% (796)
Number of households with income $150k - 200k:
St. Paul:
6.7% (53)
Minnesota:
3.0% (526)
Number of households with income > $200k:
St. Paul:
2.8% (22)
State:
3.6% (632)
Aggregate household income in St. Paul in 2022: $64,183,600
Median family income in St. Paul in 2022:
St. Paul:
$31,035
Minnesota:
$46,075
Number of families with income < $10k:
St. Paul:
10.9% (61)
State:
7.5% (825)
Number of families with income $10k - 20k:
St. Paul:
25.5% (141)
State:
15.2% (1,667)
Number of families with income $20k - 30k:
St. Paul:
12.7% (70)
State:
7.2% (786)
Number of families with income $30k - 40k:
St. Paul:
9.5% (52)
Minnesota:
14.2% (1,559)
Number of families with income $40k - 50k:
St. Paul:
6.3% (35)
State:
9.0% (983)
Number of families with income $50k - 60k:
St. Paul:
5.6% (31)
State:
6.5% (718)
Number of families with income $60k - 75k:
St. Paul:
1.8% (10)
Minnesota:
8.2% (902)
Number of families with income $75k - 100k:
St. Paul:
4.2% (23)
State:
11.4% (1,248)
Number of families with income $100k - 125k:
St. Paul:
11.1% (61)
State:
7.4% (816)
Number of families with income $150k - 200k:
St. Paul:
9.5% (52)
State:
3.9% (430)
Number of families with income > $200k:
St. Paul:
2.8% (16)
State:
5.5% (598)
Median per capita income in St. Paul in 2022:
St. Paul:
$27,501
State:
$24,180
Change in median per capita income between 2000 and 2022:
St. Paul, Minnesota:
+136.0%
State:
+85.4%
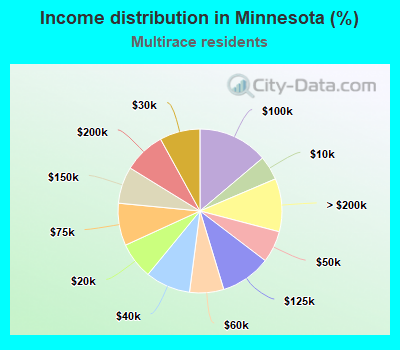
Income statistics for Multirace residents
Median household income in St. Paul, MN in 2022:
St. Paul:
$47,478
Minnesota:
$74,586
Change in median household income between 2000 and 2022:
St. Paul, Minnesota:
+72.5%
State:
+117.9%
Number of households with income < $10k:
St. Paul:
4.7% (414)
Minnesota:
4.8% (5,071)
Number of households with income $10k - 20k:
St. Paul:
6.9% (602)
Minnesota:
7.2% (7,697)
Number of households with income $20k - 30k:
St. Paul:
20.5% (1,792)
Minnesota:
8.0% (8,495)
Number of households with income $30k - 40k:
St. Paul:
14.7% (1,284)
State:
8.9% (9,445)
Number of households with income $40k - 50k:
St. Paul:
3.2% (282)
Minnesota:
6.3% (6,680)
Number of households with income $50k - 60k:
St. Paul:
8.4% (734)
Minnesota:
6.7% (7,171)
Number of households with income $60k - 75k:
St. Paul:
7.9% (691)
Minnesota:
8.4% (8,916)
Number of households with income $75k - 100k:
St. Paul:
7.6% (662)
Minnesota:
13.8% (14,719)
Number of households with income $100k - 125k:
St. Paul:
3.2% (282)
State:
10.0% (10,590)
Number of households with income $125k - 150k:
St. Paul:
8.8% (766)
State:
7.3% (7,720)
Number of households with income $150k - 200k:
St. Paul:
6.2% (545)
Minnesota:
8.2% (8,751)
Number of households with income > $200k:
St. Paul:
7.9% (693)
State:
10.5% (11,170)
Aggregate household income in St. Paul in 2022: $705,517,600
Median family income in St. Paul in 2022:
St. Paul:
$54,707
State:
$91,504
Number of families with income < $10k:
St. Paul:
5.0% (213)
State:
2.9% (1,860)
Number of families with income $10k - 20k:
St. Paul:
4.6% (194)
Minnesota:
3.7% (2,376)
Number of families with income $20k - 30k:
St. Paul:
9.9% (421)
State:
7.0% (4,526)
Number of families with income $30k - 40k:
St. Paul:
11.4% (483)
Minnesota:
7.5% (4,853)
Number of families with income $40k - 50k:
St. Paul:
6.2% (264)
State:
5.9% (3,846)
Number of families with income $50k - 60k:
St. Paul:
11.6% (492)
State:
6.0% (3,860)
Number of families with income $60k - 75k:
St. Paul:
8.6% (363)
Minnesota:
7.0% (4,538)
Number of families with income $75k - 100k:
St. Paul:
13.3% (563)
State:
15.0% (9,721)
Number of families with income $100k - 125k:
St. Paul:
6.1% (259)
State:
11.5% (7,416)
Number of families with income $125k - 150k:
St. Paul:
8.1% (342)
State:
8.4% (5,428)
Number of families with income $150k - 200k:
St. Paul:
8.1% (344)
Minnesota:
11.1% (7,156)
Number of families with income > $200k:
St. Paul:
7.0% (296)
State:
14.0% (9,072)
Median non-family income in St. Paul in 2022:
St. Paul:
$38,563
State:
$46,898
Change in median non-family income between 2000 and 2022:
St. Paul, Minnesota:
+97.6%
Minnesota:
+90.3%
Median per capita income in St. Paul in 2022:
St. Paul:
$25,839
State:
$28,529
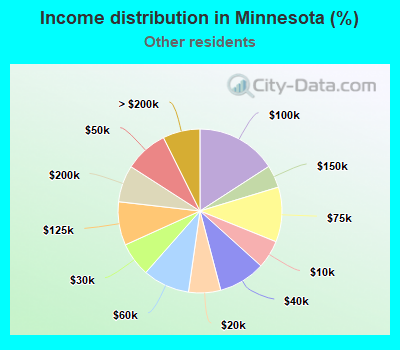
Income statistics for other residents
Median household income in St. Paul, MN in 2022:
St. Paul:
$59,776
State:
$65,473
Number of households with income < $10k:
St. Paul:
7.5% (304)
State:
5.5% (2,716)
Number of households with income $10k - 20k:
St. Paul:
4.2% (171)
State:
6.3% (3,106)
Number of households with income $20k - 30k:
St. Paul:
6.2% (252)
State:
6.7% (3,298)
Number of households with income $30k - 40k:
St. Paul:
16.1% (652)
State:
9.2% (4,529)
Number of households with income $40k - 50k:
St. Paul:
6.5% (263)
State:
8.6% (4,198)
Number of households with income $50k - 60k:
St. Paul:
9.2% (373)
Minnesota:
9.2% (4,519)
Number of households with income $60k - 75k:
St. Paul:
8.6% (351)
State:
10.8% (5,300)
Number of households with income $75k - 100k:
St. Paul:
12.8% (520)
State:
15.9% (7,771)
Number of households with income $100k - 125k:
St. Paul:
7.1% (289)
State:
8.6% (4,216)
Number of households with income $125k - 150k:
St. Paul:
9.0% (364)
Minnesota:
4.4% (2,178)
Number of households with income $150k - 200k:
St. Paul:
11.0% (445)
State:
7.3% (3,556)
Number of households with income > $200k:
St. Paul:
1.9% (76)
State:
7.3% (3,596)
Aggregate household income in St. Paul in 2022: $464,866,800
Median family income in St. Paul in 2022:
St. Paul:
$69,105
Minnesota:
$74,121
Number of families with income < $10k:
St. Paul:
14.2% (421)
State:
8.9% (3,247)
Number of families with income $10k - 20k:
St. Paul:
0.6% (19)
State:
5.0% (1,812)
Number of families with income $20k - 30k:
St. Paul:
11.4% (339)
Minnesota:
4.6% (1,695)
Number of families with income $30k - 40k:
St. Paul:
4.5% (135)
State:
5.6% (2,064)
Number of families with income $40k - 50k:
St. Paul:
8.7% (259)
State:
8.9% (3,258)
Number of families with income $50k - 60k:
St. Paul:
6.1% (181)
Minnesota:
9.1% (3,326)
Number of families with income $60k - 75k:
St. Paul:
9.2% (272)
State:
8.3% (3,047)
Number of families with income $75k - 100k:
St. Paul:
17.6% (521)
State:
19.3% (7,050)
Number of families with income $100k - 125k:
St. Paul:
7.6% (225)
State:
8.8% (3,224)
Number of families with income $125k - 150k:
St. Paul:
12.3% (364)
Minnesota:
4.7% (1,728)
Number of families with income $150k - 200k:
St. Paul:
6.6% (195)
State:
9.0% (3,305)
Number of families with income > $200k:
St. Paul:
1.1% (33)
State:
7.7% (2,829)
Median non-family income in St. Paul in 2022:
St. Paul:
$42,699
State:
$40,591
Change in median non-family income between 2000 and 2022:
St. Paul, Minnesota:
+75.2%
State:
+63.9%
Median per capita income in St. Paul in 2022:
St. Paul:
$29,597
Minnesota:
$28,385
Discuss St. Paul, Minnesota (MN) on our hugely popular Minnesota forum.