Southwick, Massachusetts (MA) income map, earnings map, and wages data
The median household income in Southwick, MA in 2022 was $84,091, which was 12.4% less than the median annual income of $94,488 across the entire state of Massachusetts. Compared to the median income of $52,296 in 2000 this represents an increase of 37.8%. The per capita income in 2022 was $38,176, which means an increase of 43.0% compared to 2000 when it was $21,756.
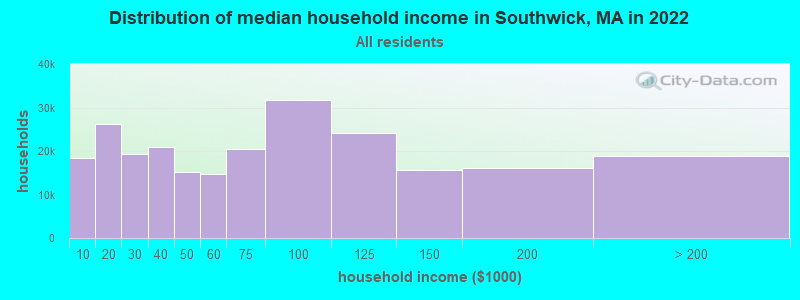
Income statistics for all residents
Median household income in Southwick, MA in 2022:| Southwick: | $84,091 |
| Massachusetts: | $94,488 |
Change in median household income between 2000 and 2022:| Southwick, Massachusetts: | +60.8% |
| State: | +87.1% |
Number of households with income < $10k:| Southwick: | 7.6% (18,449) |
| State: | 5.2% (146,170) |
Number of households with income $10k - 20k:| Southwick: | 10.9% (26,238) |
| State: | 6.4% (180,001) |
Number of households with income $20k - 30k:| Southwick: | 8.0% (19,409) |
| State: | 5.6% (156,667) |
Number of households with income $30k - 40k:| Southwick: | 8.6% (20,826) |
| Massachusetts: | 5.6% (157,168) |
Number of households with income $40k - 50k:| Southwick: | 6.3% (15,259) |
| State: | 5.4% (151,455) |
Number of households with income $50k - 60k:| Southwick: | 6.0% (14,603) |
| Massachusetts: | 5.1% (142,726) |
Number of households with income $60k - 75k:| Southwick: | 8.5% (20,572) |
| State: | 7.6% (212,203) |
Number of households with income $75k - 100k:| Southwick: | 13.1% (31,678) |
| Massachusetts: | 11.3% (317,064) |
Number of households with income $100k - 125k:| Southwick: | 10.0% (24,193) |
| Massachusetts: | 9.7% (270,603) |
Number of households with income $125k - 150k:| Southwick: | 6.4% (15,536) |
| Massachusetts: | 8.0% (223,140) |
Number of households with income $150k - 200k:| Southwick: | 6.6% (15,982) |
| State: | 11.0% (308,695) |
Number of households with income > $200k:| Southwick: | 7.8% (18,789) |
| State: | 19.0% (531,884) |
Aggregate household income in Southwick in 2022: $1,378,734,952
Median family income in Southwick in 2022:| Southwick: | $109,833 |
| State: | $120,263 |
Median non-family income in Southwick in 2022:| Southwick: | $40,339 |
| State: | $55,979 |
Change in median non-family income between 2000 and 2022:| Southwick, Massachusetts: | +57.0% |
| State: | +88.0% |
Median per capita income in Southwick in 2022:| Southwick: | $38,177 |
| State: | $54,025 |
Change in median per capita income between 2000 and 2022:| Southwick, Massachusetts: | +75.5% |
| State: | +108.2% |
Income statistics for White residents
Median household income in Southwick, MA in 2022:| Southwick: | $93,994 |
| State: | $101,391 |
Change in median household income between 2000 and 2022:| Southwick, Massachusetts: | +79.4% |
| State: | +93.3% |
Number of households with income < $10k:| Southwick: | 6.1% (9,109) |
| Massachusetts: | 4.4% (91,120) |
Number of households with income $10k - 20k:| Southwick: | 8.6% (12,804) |
| Massachusetts: | 5.9% (122,055) |
Number of households with income $20k - 30k:| Southwick: | 6.8% (10,154) |
| State: | 5.1% (105,311) |
Number of households with income $30k - 40k:| Southwick: | 8.3% (12,293) |
| Massachusetts: | 5.3% (110,239) |
Number of households with income $40k - 50k:| Southwick: | 5.7% (8,541) |
| State: | 5.0% (104,636) |
Number of households with income $50k - 60k:| Southwick: | 5.2% (7,762) |
| Massachusetts: | 4.8% (99,486) |
Number of households with income $60k - 75k:| Southwick: | 8.0% (11,915) |
| Massachusetts: | 7.5% (155,124) |
Number of households with income $75k - 100k:| Southwick: | 15.2% (22,702) |
| State: | 11.4% (236,252) |
Number of households with income $100k - 125k:| Southwick: | 11.3% (16,906) |
| State: | 9.9% (204,731) |
Number of households with income $125k - 150k:| Southwick: | 7.6% (11,349) |
| State: | 8.5% (175,324) |
Number of households with income $150k - 200k:| Southwick: | 8.5% (12,682) |
| Massachusetts: | 11.7% (242,980) |
Number of households with income > $200k:| Southwick: | 8.6% (12,760) |
| Massachusetts: | 20.5% (425,966) |
Aggregate household income in Southwick in 2022: $1,000,514,472
Median family income in Southwick in 2022:| Southwick: | $117,884 |
| State: | $133,153 |
Number of families with income < $10k:| Southwick: | 1.6% (31) |
| State: | 2.0% (25,038) |
Number of families with income $10k - 20k:| Southwick: | 2.1% (40) |
| Massachusetts: | 2.1% (26,403) |
Number of families with income $20k - 30k:| Southwick: | 3.1% (59) |
| State: | 2.6% (32,525) |
Number of families with income $30k - 40k:| Southwick: | 4.3% (81) |
| Massachusetts: | 3.9% (48,079) |
Number of families with income $40k - 50k:| Southwick: | 2.9% (54) |
| Massachusetts: | 3.8% (46,908) |
Number of families with income $50k - 60k:| Southwick: | 4.8% (90) |
| State: | 3.8% (46,476) |
Number of families with income $60k - 75k:| Southwick: | 11.4% (215) |
| State: | 6.4% (79,040) |
Number of families with income $75k - 100k:| Southwick: | 23.6% (444) |
| State: | 11.1% (137,395) |
Number of families with income $100k - 125k:| Southwick: | 17.2% (324) |
| State: | 11.1% (136,771) |
Number of families with income $125k - 150k:| Southwick: | 6.4% (120) |
| State: | 10.0% (123,709) |
Number of families with income $150k - 200k:| Southwick: | 15.4% (291) |
| State: | 14.7% (181,602) |
Number of families with income > $200k:| Southwick: | 7.1% (134) |
| State: | 28.5% (351,887) |
Median non-family income in Southwick in 2022:| Southwick: | $42,108 |
| State: | $59,323 |
Change in median non-family income between 2000 and 2022:| Southwick, Massachusetts: | +64.6% |
| State: | +94.3% |
Median per capita income in Southwick in 2022:| Southwick: | $40,926 |
| Massachusetts: | $60,804 |
Change in median per capita income between 2000 and 2022:| Southwick, Massachusetts: | +87.0% |
| Massachusetts: | +118.7% |
Income statistics for Black or African American residents
Median household income in Southwick, MA in 2022:| Southwick: | $90,387 |
| State: | $63,189 |
Change in median household income between 2000 and 2022:| Southwick, Massachusetts: | +76.4% |
| State: | +87.4% |
Number of households with income < $10k:| Southwick: | 9.4% (2,645) |
| State: | 9.1% (15,797) |
Number of households with income $10k - 20k:| Southwick: | 6.9% (1,953) |
| Massachusetts: | 9.4% (16,267) |
Number of households with income $20k - 30k:| Southwick: | 7.8% (2,197) |
| State: | 7.8% (13,520) |
Number of households with income $30k - 40k:| Southwick: | 15.3% (4,316) |
| State: | 8.3% (14,412) |
Number of households with income $40k - 50k:| Southwick: | 11.2% (3,164) |
| State: | 7.9% (13,790) |
Number of households with income $50k - 60k:| Southwick: | 6.9% (1,949) |
| State: | 5.8% (10,041) |
Number of households with income $60k - 75k:| Southwick: | 10.1% (2,854) |
| State: | 8.5% (14,822) |
Number of households with income $75k - 100k:| Southwick: | 8.8% (2,477) |
| State: | 11.0% (19,122) |
Number of households with income $100k - 125k:| Southwick: | 7.2% (2,036) |
| State: | 8.4% (14,575) |
Number of households with income $125k - 150k:| Southwick: | 2.2% (624) |
| State: | 6.0% (10,429) |
Number of households with income $150k - 200k:| Southwick: | 3.8% (1,073) |
| State: | 7.2% (12,539) |
Number of households with income > $200k:| Southwick: | 10.1% (2,843) |
| State: | 10.5% (18,185) |
Aggregate household income in Southwick in 2022: $817,795
Median family income in Southwick in 2022:| Southwick: | $112,560 |
| State: | $79,815 |
Median per capita income in Southwick in 2022:| Southwick: | $55,784 |
| Massachusetts: | $33,524 |
Change in median per capita income between 2000 and 2022:| Southwick, Massachusetts: | +95.7% |
| State: | +109.4% |
Income statistics for Asian residents
Median household income in Southwick, MA in 2022:| Southwick: | $132,157 |
| State: | $117,855 |
Change in median household income between 2000 and 2022:| Southwick, Massachusetts: | +34.4% |
| State: | +129.9% |
Number of households with income < $10k:| Southwick: | 6.8% (22,975) |
| State: | 6.8% (11,982) |
Number of households with income $10k - 20k:| Southwick: | 4.8% (16,060) |
| Massachusetts: | 4.8% (8,376) |
Number of households with income $20k - 30k:| Southwick: | 3.7% (12,574) |
| State: | 3.7% (6,558) |
Number of households with income $30k - 40k:| Southwick: | 3.3% (11,021) |
| State: | 3.3% (5,748) |
Number of households with income $40k - 50k:| Southwick: | 4.1% (13,790) |
| State: | 4.1% (7,192) |
Number of households with income $50k - 60k:| Southwick: | 5.0% (16,747) |
| State: | 5.0% (8,734) |
Number of households with income $60k - 75k:| Southwick: | 5.8% (19,564) |
| Massachusetts: | 5.8% (10,203) |
Number of households with income $75k - 100k:| Southwick: | 8.6% (29,057) |
| State: | 8.6% (15,154) |
Number of households with income $100k - 125k:| Southwick: | 10.8% (36,320) |
| State: | 10.8% (18,942) |
Number of households with income $125k - 150k:| Southwick: | 8.0% (26,915) |
| State: | 8.0% (14,037) |
Number of households with income $150k - 200k:| Southwick: | 12.5% (41,908) |
| State: | 12.5% (21,856) |
Number of households with income > $200k:| Southwick: | 26.6% (89,533) |
| Massachusetts: | 26.6% (46,694) |
Aggregate household income in Southwick in 2022: $5,694,794
Median family income in Southwick in 2022:| Southwick: | $152,072 |
| Massachusetts: | $140,113 |
Number of families with income $75k - 100k:| Southwick: | 31.8% (12) |
| State: | 8.5% (10,022) |
Number of families with income $125k - 150k:| Southwick: | 68.2% (27) |
| Massachusetts: | 8.6% (10,071) |
Median per capita income in Southwick in 2022:| Southwick: | $74,404 |
| Massachusetts: | $58,900 |
Change in median per capita income between 2000 and 2022:| Southwick, Massachusetts: | +87.5% |
| State: | +174.6% |
Income statistics for Hispanic or Latino residents
Median household income in Southwick, MA in 2022:| Southwick: | $157,038 |
| Massachusetts: | $61,523 |
Change in median household income between 2000 and 2022:| Southwick, Massachusetts: | +120.4% |
| Massachusetts: | +125.4% |
Number of households with income < $10k:| Southwick: | 12.7% (21,120) |
| State: | 8.8% (25,307) |
Number of households with income $10k - 20k:| Southwick: | 17.8% (29,681) |
| State: | 10.0% (28,653) |
Number of households with income $20k - 30k:| Southwick: | 10.0% (16,581) |
| State: | 8.8% (25,189) |
Number of households with income $30k - 40k:| Southwick: | 9.0% (14,997) |
| Massachusetts: | 7.2% (20,822) |
Number of households with income $40k - 50k:| Southwick: | 5.9% (9,907) |
| Massachusetts: | 7.2% (20,817) |
Number of households with income $50k - 60k:| Southwick: | 8.8% (14,588) |
| State: | 6.5% (18,748) |
Number of households with income $60k - 75k:| Southwick: | 9.0% (15,016) |
| State: | 8.8% (25,390) |
Number of households with income $75k - 100k:| Southwick: | 9.3% (15,575) |
| State: | 12.0% (34,488) |
Number of households with income $100k - 125k:| Southwick: | 7.0% (11,695) |
| Massachusetts: | 8.6% (24,599) |
Number of households with income $125k - 150k:| Southwick: | 5.5% (9,225) |
| State: | 6.2% (17,743) |
Number of households with income $150k - 200k:| Southwick: | 1.7% (2,805) |
| Massachusetts: | 7.3% (21,017) |
Number of households with income > $200k:| Southwick: | 3.2% (5,406) |
| State: | 8.6% (24,606) |
Aggregate household income in Southwick in 2022: $14,792,517
Median family income in Southwick in 2022:| Southwick: | $222,079 |
| State: | $66,072 |
Number of families with income < $10k:| Southwick: | 6.2% (45) |
| State: | 6.2% (12,456) |
Number of families with income $10k - 20k:| Southwick: | 9.0% (65) |
| State: | 6.0% (12,071) |
Number of families with income $20k - 30k:| Southwick: | 11.1% (80) |
| State: | 10.1% (20,376) |
Number of families with income $30k - 40k:| Southwick: | 8.4% (60) |
| Massachusetts: | 8.2% (16,470) |
Number of families with income $40k - 50k:| Southwick: | 4.6% (33) |
| State: | 7.4% (14,829) |
Number of families with income $50k - 60k:| Southwick: | 9.5% (69) |
| State: | 7.3% (14,643) |
Number of families with income $60k - 75k:| Southwick: | 16.1% (116) |
| State: | 10.6% (21,252) |
Number of families with income $75k - 100k:| Southwick: | 16.7% (120) |
| Massachusetts: | 12.0% (24,088) |
Number of families with income $100k - 125k:| Southwick: | 10.2% (74) |
| Massachusetts: | 8.9% (17,954) |
Number of families with income $125k - 150k:| Southwick: | 3.6% (26) |
| Massachusetts: | 6.9% (13,837) |
Number of families with income $150k - 200k:| Southwick: | 2.3% (17) |
| State: | 7.3% (14,683) |
Number of families with income > $200k:| Southwick: | 2.3% (17) |
| Massachusetts: | 9.3% (18,741) |
Median non-family income in Southwick in 2022:| Southwick: | $61,358 |
| State: | $37,563 |
Change in median non-family income between 2000 and 2022:| Southwick, Massachusetts: | +48.7% |
| State: | +115.0% |
Median per capita income in Southwick in 2022:| Southwick: | $47,457 |
| State: | $28,993 |
Change in median per capita income between 2000 and 2022:| Southwick, Massachusetts: | +129.0% |
| State: | +142.4% |
Income statistics for American Indian and Alaska Native residents
Median household income in Southwick, MA in 2022:| Southwick: | $213,417 |
| Massachusetts: | $87,730 |
Change in median household income between 2000 and 2022:| Southwick, Massachusetts: | +134.6% |
| Massachusetts: | +138.3% |
Number of households with income < $10k:| Southwick: | 6.6% (1,114) |
| State: | 6.6% (451) |
Number of households with income $10k - 20k:| Southwick: | 7.0% (1,176) |
| State: | 7.0% (476) |
Number of households with income $20k - 30k:| Southwick: | 2.8% (474) |
| State: | 2.8% (192) |
Number of households with income $30k - 40k:| Southwick: | 3.2% (539) |
| Massachusetts: | 3.2% (218) |
Number of households with income $40k - 50k:| Southwick: | 2.9% (492) |
| State: | 2.9% (199) |
Number of households with income $50k - 60k:| Southwick: | 9.9% (1,673) |
| State: | 9.9% (677) |
Number of households with income $60k - 75k:| Southwick: | 11.5% (1,930) |
| State: | 11.5% (781) |
Number of households with income $75k - 100k:| Southwick: | 9.2% (1,554) |
| Massachusetts: | 9.2% (629) |
Number of households with income $100k - 125k:| Southwick: | 6.0% (1,003) |
| Massachusetts: | 6.0% (406) |
Number of households with income $125k - 150k:| Southwick: | 13.5% (2,276) |
| State: | 13.5% (921) |
Number of households with income $150k - 200k:| Southwick: | 12.6% (2,123) |
| State: | 12.6% (859) |
Number of households with income > $200k:| Southwick: | 14.7% (2,478) |
| State: | 14.7% (1,003) |
Aggregate household income in Southwick in 2022: $1,241,373
Median family income in Southwick in 2022:| Southwick: | $166,575 |
| State: | $105,715 |
Number of families with income $75k - 100k:| Southwick: | 100.0% (17) |
| Massachusetts: | 9.3% (297) |
Median per capita income in Southwick in 2022:| Southwick: | $25,712 |
| Massachusetts: | $39,434 |
Change in median per capita income between 2000 and 2022:| Southwick, Massachusetts: | +42.4% |
| State: | +148.2% |
Income statistics for Multirace residents
Median household income in Southwick, MA in 2022:| Southwick: | $53,490 |
| Massachusetts: | $71,552 |
Change in median household income between 2000 and 2022:| Southwick, Massachusetts: | +42.6% |
| State: | +109.0% |
Number of households with income < $10k:| Southwick: | 8.4% (3,207) |
| Massachusetts: | 6.6% (15,127) |
Number of households with income $10k - 20k:| Southwick: | 22.0% (8,412) |
| State: | 9.2% (21,158) |
Number of households with income $20k - 30k:| Southwick: | 12.5% (4,782) |
| Massachusetts: | 7.8% (18,016) |
Number of households with income $30k - 40k:| Southwick: | 9.7% (3,734) |
| Massachusetts: | 7.9% (18,260) |
Number of households with income $40k - 50k:| Southwick: | 6.6% (2,514) |
| Massachusetts: | 5.6% (13,027) |
Number of households with income $50k - 60k:| Southwick: | 7.9% (3,023) |
| State: | 5.6% (12,909) |
Number of households with income $60k - 75k:| Southwick: | 10.7% (4,104) |
| State: | 9.0% (20,800) |
Number of households with income $75k - 100k:| Southwick: | 6.8% (2,609) |
| State: | 12.1% (27,875) |
Number of households with income $100k - 125k:| Southwick: | 6.4% (2,439) |
| Massachusetts: | 8.1% (18,754) |
Number of households with income $125k - 150k:| Southwick: | 3.2% (1,229) |
| State: | 6.8% (15,621) |
Number of households with income $150k - 200k:| Southwick: | 2.8% (1,057) |
| State: | 9.4% (21,618) |
Number of households with income > $200k:| Southwick: | 3.2% (1,212) |
| Massachusetts: | 12.0% (27,592) |
Aggregate household income in Southwick in 2022: $15,653,758
Median family income in Southwick in 2022:| Southwick: | $51,851 |
| Massachusetts: | $78,380 |
Number of families with income $30k - 40k:| Southwick: | 60.3% (119) |
| State: | 8.2% (12,705) |
Number of families with income $50k - 60k:| Southwick: | 39.7% (79) |
| Massachusetts: | 6.7% (10,445) |
Median non-family income in Southwick in 2022:| Southwick: | $27,137 |
| State: | $42,253 |
Change in median non-family income between 2000 and 2022:| Southwick, Massachusetts: | +3.4% |
| State: | +93.7% |
Median per capita income in Southwick in 2022:| Southwick: | $16,486 |
| Massachusetts: | $34,029 |
Change in median per capita income between 2000 and 2022:| Southwick, Massachusetts: | +88.2% |
| State: | +132.1% |
Income statistics for other residents
Number of households with income < $10k:| Southwick: | 15.4% (4) |
| State: | 8.4% (11,559) |
Number of households with income $10k - 20k:| Southwick: | 11.5% (3) |
| State: | 8.4% (11,499) |
Number of households with income $20k - 30k:| Southwick: | 7.7% (2) |
| Massachusetts: | 9.5% (13,070) |
Number of households with income $30k - 40k:| Southwick: | 7.7% (2) |
| Massachusetts: | 6.0% (8,291) |
Number of households with income $40k - 50k:| Southwick: | 7.7% (2) |
| Massachusetts: | 9.2% (12,611) |
Number of households with income $50k - 60k:| Southwick: | 7.7% (2) |
| Massachusetts: | 7.9% (10,879) |
Number of households with income $60k - 75k:| Southwick: | 7.7% (2) |
| State: | 7.5% (10,239) |
Number of households with income $75k - 100k:| Southwick: | 11.5% (3) |
| State: | 13.1% (18,032) |
Number of households with income $100k - 125k:| Southwick: | 7.7% (2) |
| Massachusetts: | 9.6% (13,141) |
Number of households with income $125k - 150k:| Southwick: | 7.7% (2) |
| Massachusetts: | 5.0% (6,808) |
Number of households with income $150k - 200k:| Southwick: | 0.0% (0) |
| State: | 6.4% (8,843) |
Number of households with income > $200k:| Southwick: | 7.7% (2) |
| State: | 9.0% (12,396) |
Aggregate household income in Southwick in 2022: $1,667,518
Median family income in Southwick in 2022:| Southwick: | $163,649 |
| State: | $66,840 |
Number of families with income $20k - 30k:| Southwick: | 13.8% (2) |
| State: | 10.4% (10,595) |
Number of families with income $60k - 75k:| Southwick: | 86.2% (15) |
| State: | 8.5% (8,683) |
Median per capita income in Southwick in 2022:| Southwick: | $38,209 |
| Massachusetts: | $30,797 |