Southern Slopes, Washington (WA) income map, earnings map, and wages data
The median household income in Southern Slopes, WA in 2022 was $57,485, which was 58.8% less than the median annual income of $91,306 across the entire state of Washington. Compared to the median income of $31,775 in 2000 this represents an increase of 44.7%. The per capita income in 2022 was $23,531, which means an increase of 52.1% compared to 2000 when it was $11,274.
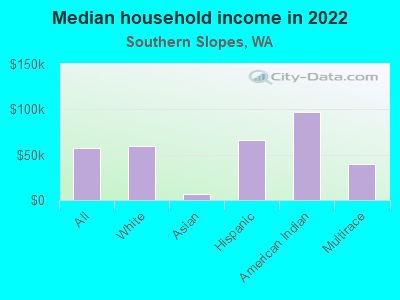
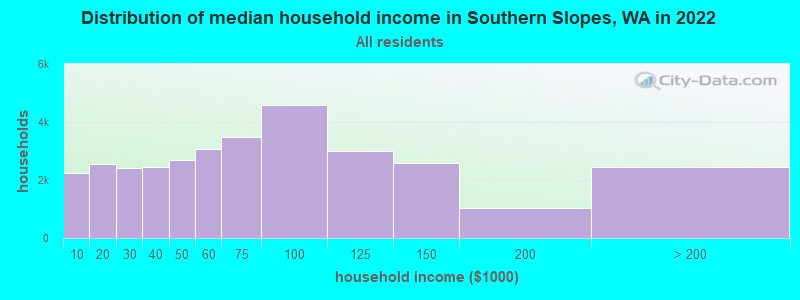
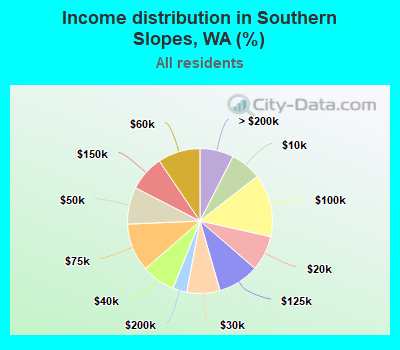
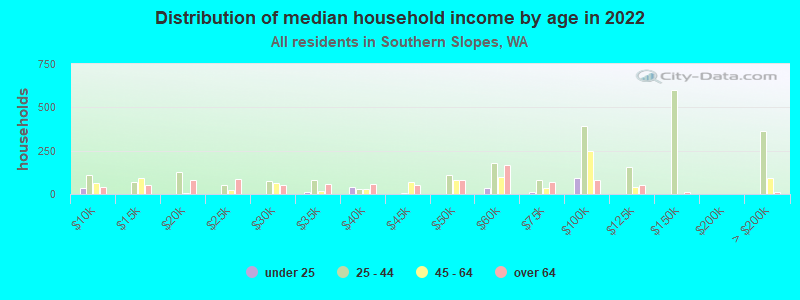
Income statistics for all residents
Median household income in Southern Slopes, WA in 2022:| Southern Slopes: | $57,485 |
| Washington: | $91,306 |
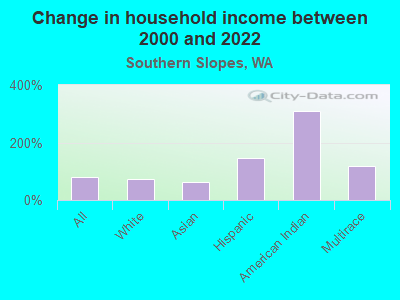
Change in median household income between 2000 and 2022:| Southern Slopes, Washington: | +80.9% |
| Washington: | +99.5% |
Number of households with income < $10k:| Southern Slopes: | 6.9% (2,252) |
| State: | 4.5% (139,331) |
Number of households with income $10k - 20k:| Southern Slopes: | 7.9% (2,562) |
| Washington: | 5.0% (154,508) |
Number of households with income $20k - 30k:| Southern Slopes: | 7.4% (2,407) |
| State: | 5.4% (166,555) |
Number of households with income $30k - 40k:| Southern Slopes: | 7.5% (2,433) |
| State: | 5.5% (170,324) |
Number of households with income $40k - 50k:| Southern Slopes: | 8.3% (2,689) |
| State: | 6.0% (183,941) |
Number of households with income $50k - 60k:| Southern Slopes: | 9.5% (3,079) |
| State: | 6.1% (187,395) |
Number of households with income $60k - 75k:| Southern Slopes: | 10.7% (3,494) |
| State: | 8.7% (266,771) |
Number of households with income $75k - 100k:| Southern Slopes: | 14.0% (4,570) |
| Washington: | 13.1% (404,672) |
Number of households with income $100k - 125k:| Southern Slopes: | 9.2% (2,986) |
| State: | 11.0% (337,911) |
Number of households with income $125k - 150k:| Southern Slopes: | 8.0% (2,592) |
| Washington: | 8.0% (244,934) |
Number of households with income $150k - 200k:| Southern Slopes: | 3.2% (1,030) |
| State: | 10.5% (323,812) |
Number of households with income > $200k:| Southern Slopes: | 7.5% (2,454) |
| State: | 16.2% (499,799) |
Aggregate household income in Southern Slopes in 2022: $330,055,456
Median family income in Southern Slopes in 2022:| Southern Slopes: | $62,110 |
| State: | $109,192 |
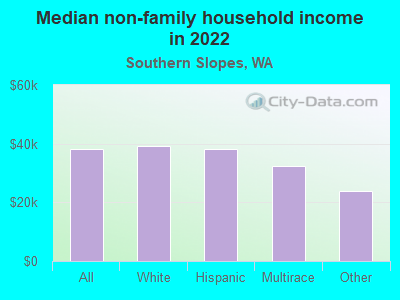
Median non-family income in Southern Slopes in 2022:| Southern Slopes: | $38,198 |
| State: | $57,299 |
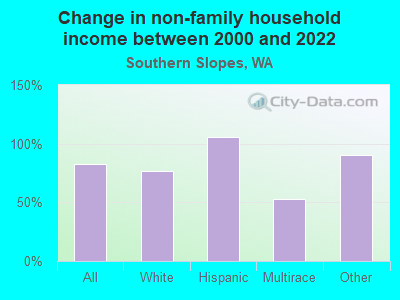
Change in median non-family income between 2000 and 2022:| Southern Slopes, Washington: | +82.7% |
| State: | +94.9% |
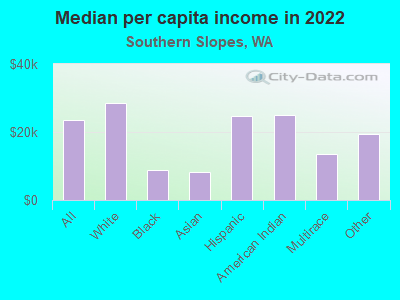
Median per capita income in Southern Slopes in 2022:| Southern Slopes: | $23,532 |
| Washington: | $50,764 |
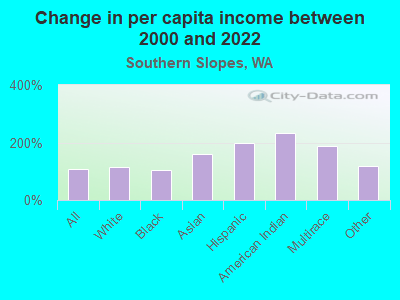
Change in median per capita income between 2000 and 2022:| Southern Slopes, Washington: | +108.7% |
| Washington: | +121.0% |
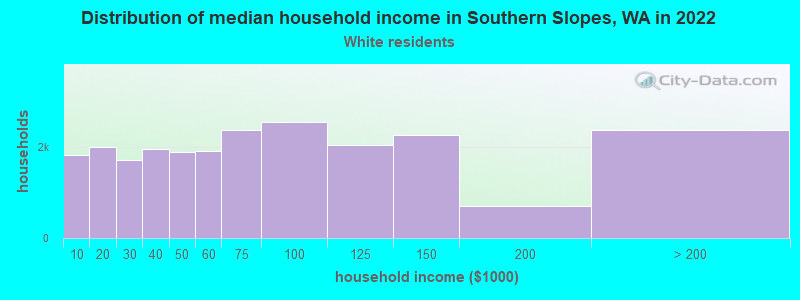
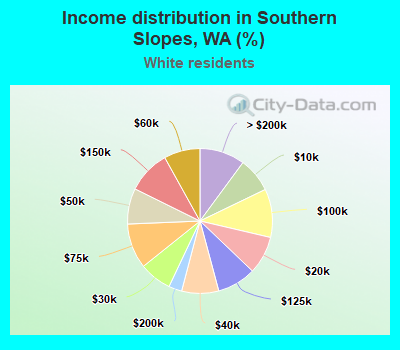
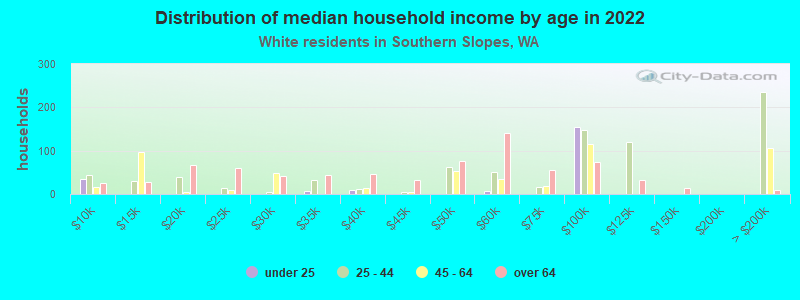
Income statistics for White residents
Median household income in Southern Slopes, WA in 2022:| Southern Slopes: | $59,776 |
| State: | $91,916 |
Change in median household income between 2000 and 2022:| Southern Slopes, Washington: | +74.0% |
| State: | +95.4% |
Number of households with income < $10k:| Southern Slopes: | 7.8% (1,839) |
| Washington: | 4.3% (95,850) |
Number of households with income $10k - 20k:| Southern Slopes: | 8.5% (2,014) |
| Washington: | 4.8% (106,421) |
Number of households with income $20k - 30k:| Southern Slopes: | 7.2% (1,713) |
| State: | 5.5% (122,860) |
Number of households with income $30k - 40k:| Southern Slopes: | 8.3% (1,960) |
| Washington: | 5.4% (119,627) |
Number of households with income $40k - 50k:| Southern Slopes: | 8.0% (1,889) |
| State: | 5.9% (132,276) |
Number of households with income $50k - 60k:| Southern Slopes: | 8.1% (1,911) |
| State: | 6.1% (136,212) |
Number of households with income $60k - 75k:| Southern Slopes: | 10.1% (2,390) |
| State: | 8.8% (196,086) |
Number of households with income $75k - 100k:| Southern Slopes: | 10.8% (2,561) |
| State: | 13.4% (299,192) |
Number of households with income $100k - 125k:| Southern Slopes: | 8.7% (2,059) |
| State: | 11.3% (252,209) |
Number of households with income $125k - 150k:| Southern Slopes: | 9.6% (2,284) |
| Washington: | 7.9% (175,962) |
Number of households with income $150k - 200k:| Southern Slopes: | 2.9% (697) |
| State: | 10.7% (239,156) |
Number of households with income > $200k:| Southern Slopes: | 10.1% (2,395) |
| Washington: | 16.1% (359,917) |
Aggregate household income in Southern Slopes in 2022: $194,270,673
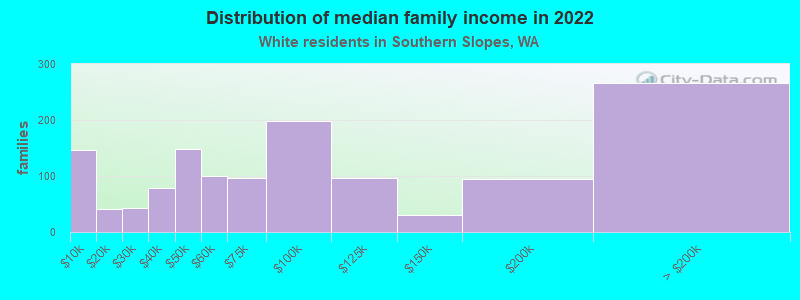
Median family income in Southern Slopes in 2022:| Southern Slopes: | $70,429 |
| State: | $112,511 |
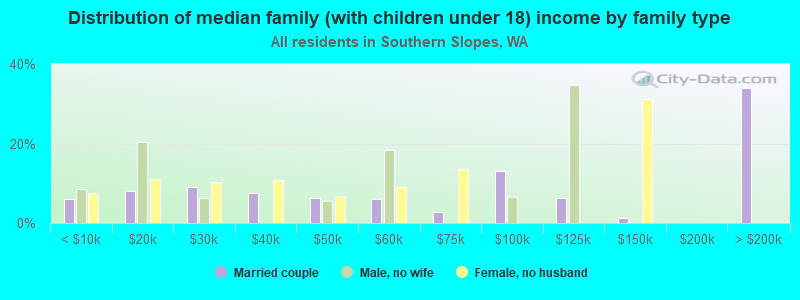
Number of families with income < $10k:| Southern Slopes: | 10.9% (146) |
| Washington: | 2.4% (33,676) |
Number of families with income $10k - 20k:| Southern Slopes: | 3.0% (41) |
| State: | 2.0% (28,228) |
Number of families with income $20k - 30k:| Southern Slopes: | 3.1% (42) |
| Washington: | 2.9% (39,288) |
Number of families with income $30k - 40k:| Southern Slopes: | 5.9% (79) |
| Washington: | 3.6% (50,190) |
Number of families with income $40k - 50k:| Southern Slopes: | 11.1% (148) |
| Washington: | 4.6% (63,009) |
Number of families with income $50k - 60k:| Southern Slopes: | 7.5% (100) |
| Washington: | 5.0% (69,270) |
Number of families with income $60k - 75k:| Southern Slopes: | 7.2% (96) |
| State: | 8.2% (112,369) |
Number of families with income $75k - 100k:| Southern Slopes: | 14.8% (198) |
| State: | 14.1% (194,214) |
Number of families with income $100k - 125k:| Southern Slopes: | 7.2% (96) |
| State: | 13.2% (182,184) |
Number of families with income $125k - 150k:| Southern Slopes: | 2.3% (31) |
| State: | 9.5% (130,928) |
Number of families with income $150k - 200k:| Southern Slopes: | 7.1% (94) |
| State: | 13.7% (188,621) |
Number of families with income > $200k:| Southern Slopes: | 19.9% (266) |
| Washington: | 20.8% (285,982) |
Median non-family income in Southern Slopes in 2022:| Southern Slopes: | $39,083 |
| State: | $56,103 |
Change in median non-family income between 2000 and 2022:| Southern Slopes, Washington: | +77.1% |
| State: | +87.7% |
Median per capita income in Southern Slopes in 2022:| Southern Slopes: | $28,608 |
| State: | $55,212 |
Change in median per capita income between 2000 and 2022:| Southern Slopes, Washington: | +115.0% |
| Washington: | +123.8% |
Income statistics for Black or African American residents
Aggregate household income in Southern Slopes in 2022: $70,698
Median per capita income in Southern Slopes in 2022:| Southern Slopes: | $8,712 |
| State: | $38,209 |
Change in median per capita income between 2000 and 2022:| Southern Slopes, Washington: | +105.0% |
| State: | +115.3% |
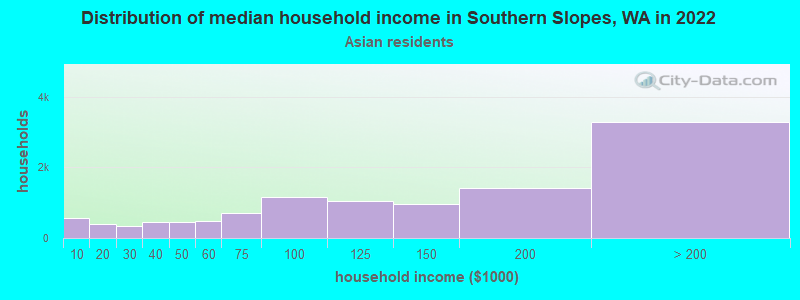
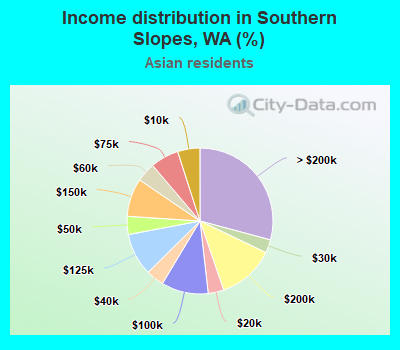
Income statistics for Asian residents
Median household income in Southern Slopes, WA in 2022:| Southern Slopes: | $6,088 |
| State: | $125,692 |
Change in median household income between 2000 and 2022:| Southern Slopes, Washington: | +62.4% |
| Washington: | +164.5% |
Number of households with income < $10k:| Southern Slopes: | 4.9% (556) |
| State: | 4.9% (14,099) |
Number of households with income $10k - 20k:| Southern Slopes: | 3.5% (389) |
| State: | 3.5% (9,873) |
Number of households with income $20k - 30k:| Southern Slopes: | 2.9% (329) |
| State: | 2.9% (8,352) |
Number of households with income $30k - 40k:| Southern Slopes: | 4.0% (450) |
| Washington: | 4.0% (11,415) |
Number of households with income $40k - 50k:| Southern Slopes: | 4.0% (451) |
| State: | 4.0% (11,421) |
Number of households with income $50k - 60k:| Southern Slopes: | 4.3% (478) |
| State: | 4.2% (12,100) |
Number of households with income $60k - 75k:| Southern Slopes: | 6.3% (706) |
| State: | 6.3% (17,903) |
Number of households with income $75k - 100k:| Southern Slopes: | 10.4% (1,170) |
| Washington: | 10.4% (29,663) |
Number of households with income $100k - 125k:| Southern Slopes: | 9.4% (1,059) |
| Washington: | 9.4% (26,839) |
Number of households with income $125k - 150k:| Southern Slopes: | 8.5% (955) |
| State: | 8.5% (24,200) |
Number of households with income $150k - 200k:| Southern Slopes: | 12.6% (1,422) |
| State: | 12.6% (35,976) |
Number of households with income > $200k:| Southern Slopes: | 29.2% (3,282) |
| State: | 29.2% (83,109) |
Aggregate household income in Southern Slopes in 2022: $12,252
Median per capita income in Southern Slopes in 2022:| Southern Slopes: | $8,334 |
| State: | $67,666 |
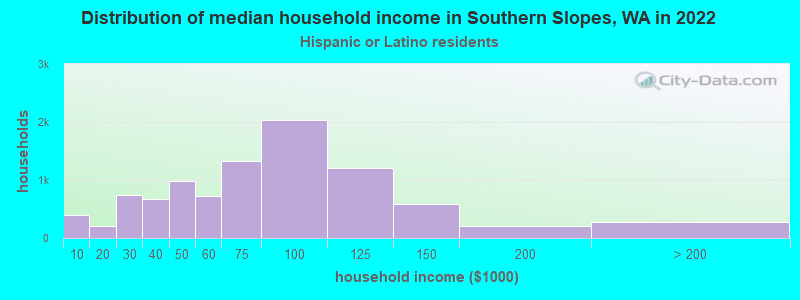
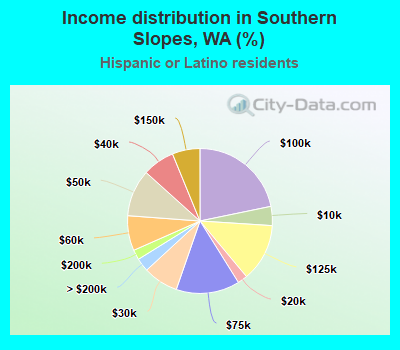
Income statistics for Hispanic or Latino residents
Median household income in Southern Slopes, WA in 2022:| Southern Slopes: | $65,800 |
| State: | $74,770 |
Change in median household income between 2000 and 2022:| Southern Slopes, Washington: | +147.2% |
| State: | +128.3% |
Number of households with income < $10k:| Southern Slopes: | 4.3% (399) |
| Washington: | 4.9% (14,456) |
Number of households with income $10k - 20k:| Southern Slopes: | 2.2% (206) |
| Washington: | 5.3% (15,449) |
Number of households with income $20k - 30k:| Southern Slopes: | 7.8% (735) |
| State: | 6.8% (20,016) |
Number of households with income $30k - 40k:| Southern Slopes: | 7.1% (669) |
| State: | 7.7% (22,548) |
Number of households with income $40k - 50k:| Southern Slopes: | 10.5% (984) |
| State: | 7.3% (21,450) |
Number of households with income $50k - 60k:| Southern Slopes: | 7.8% (731) |
| State: | 7.7% (22,744) |
Number of households with income $60k - 75k:| Southern Slopes: | 14.2% (1,332) |
| State: | 10.5% (30,737) |
Number of households with income $75k - 100k:| Southern Slopes: | 21.8% (2,042) |
| Washington: | 14.9% (43,843) |
Number of households with income $100k - 125k:| Southern Slopes: | 12.9% (1,209) |
| Washington: | 11.1% (32,554) |
Number of households with income $125k - 150k:| Southern Slopes: | 6.2% (580) |
| State: | 7.4% (21,624) |
Number of households with income $150k - 200k:| Southern Slopes: | 2.2% (210) |
| Washington: | 7.3% (21,360) |
Number of households with income > $200k:| Southern Slopes: | 3.0% (280) |
| State: | 9.2% (27,055) |
Aggregate household income in Southern Slopes in 2022: $249,836,117
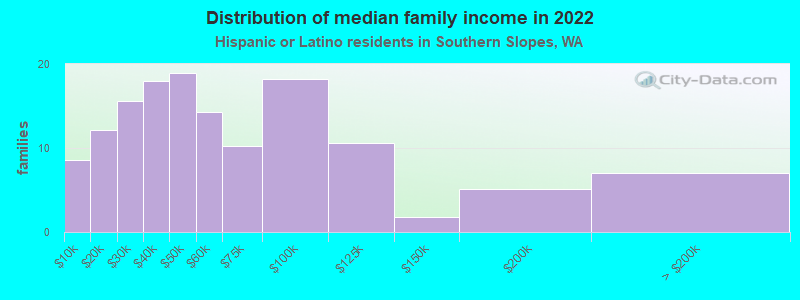
Median family income in Southern Slopes in 2022:| Southern Slopes: | $67,223 |
| Washington: | $76,866 |
Number of families with income < $10k:| Southern Slopes: | 6.1% (9) |
| State: | 4.4% (9,443) |
Number of families with income $10k - 20k:| Southern Slopes: | 8.6% (12) |
| State: | 3.5% (7,524) |
Number of families with income $20k - 30k:| Southern Slopes: | 11.1% (16) |
| State: | 5.6% (12,052) |
Number of families with income $30k - 40k:| Southern Slopes: | 12.8% (18) |
| State: | 8.3% (17,803) |
Number of families with income $40k - 50k:| Southern Slopes: | 13.5% (19) |
| State: | 7.7% (16,361) |
Number of families with income $50k - 60k:| Southern Slopes: | 10.2% (14) |
| Washington: | 7.9% (16,852) |
Number of families with income $60k - 75k:| Southern Slopes: | 7.3% (10) |
| State: | 11.4% (24,342) |
Number of families with income $75k - 100k:| Southern Slopes: | 13.0% (18) |
| Washington: | 14.4% (30,698) |
Number of families with income $100k - 125k:| Southern Slopes: | 7.5% (11) |
| State: | 11.4% (24,331) |
Number of families with income $125k - 150k:| Southern Slopes: | 1.3% (2) |
| State: | 7.5% (16,099) |
Number of families with income $150k - 200k:| Southern Slopes: | 3.6% (5) |
| Washington: | 8.2% (17,551) |
Number of families with income > $200k:| Southern Slopes: | 5.0% (7) |
| State: | 9.7% (20,653) |
Median non-family income in Southern Slopes in 2022:| Southern Slopes: | $38,345 |
| Washington: | $54,173 |
Change in median non-family income between 2000 and 2022:| Southern Slopes, Washington: | +106.2% |
| State: | +105.8% |
Median per capita income in Southern Slopes in 2022:| Southern Slopes: | $24,651 |
| Washington: | $28,252 |
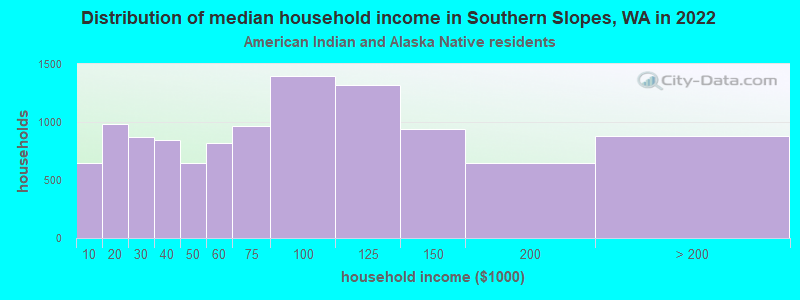
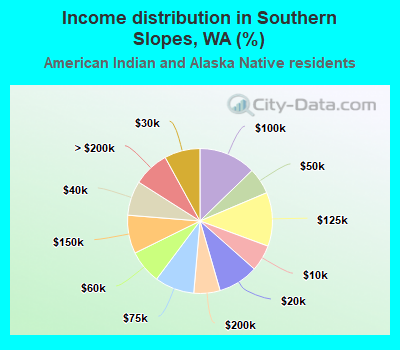
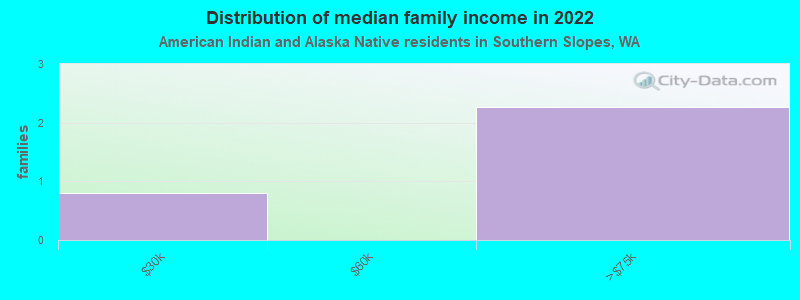
Income statistics for American Indian and Alaska Native residents
Median household income in Southern Slopes, WA in 2022:| Southern Slopes: | $96,923 |
| State: | $71,255 |
Number of households with income < $10k:| Southern Slopes: | 5.9% (645) |
| State: | 5.9% (1,768) |
Number of households with income $10k - 20k:| Southern Slopes: | 9.0% (985) |
| State: | 8.9% (2,694) |
Number of households with income $20k - 30k:| Southern Slopes: | 8.0% (872) |
| Washington: | 8.0% (2,412) |
Number of households with income $30k - 40k:| Southern Slopes: | 7.7% (844) |
| State: | 7.7% (2,327) |
Number of households with income $40k - 50k:| Southern Slopes: | 5.9% (646) |
| Washington: | 5.8% (1,755) |
Number of households with income $50k - 60k:| Southern Slopes: | 7.5% (821) |
| State: | 7.5% (2,259) |
Number of households with income $60k - 75k:| Southern Slopes: | 8.8% (968) |
| Washington: | 8.8% (2,669) |
Number of households with income $75k - 100k:| Southern Slopes: | 12.7% (1,396) |
| Washington: | 12.8% (3,861) |
Number of households with income $100k - 125k:| Southern Slopes: | 12.0% (1,317) |
| State: | 12.0% (3,618) |
Number of households with income $125k - 150k:| Southern Slopes: | 8.6% (941) |
| State: | 8.6% (2,580) |
Number of households with income $150k - 200k:| Southern Slopes: | 5.9% (643) |
| State: | 5.9% (1,774) |
Number of households with income > $200k:| Southern Slopes: | 8.0% (881) |
| State: | 8.1% (2,447) |
Aggregate household income in Southern Slopes in 2022: $1,837,586
Median family income in Southern Slopes in 2022:| Southern Slopes: | $114,347 |
| Washington: | $79,010 |
Median per capita income in Southern Slopes in 2022:| Southern Slopes: | $24,907 |
| State: | $27,053 |
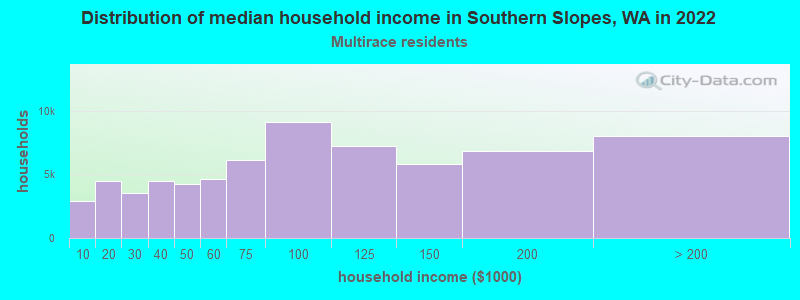
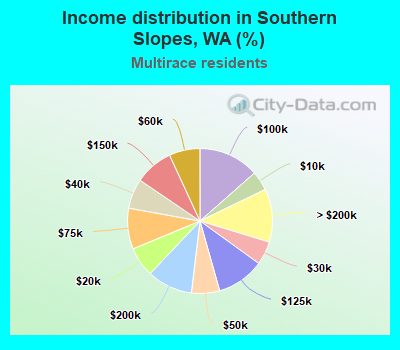
Income statistics for Multirace residents
Median household income in Southern Slopes, WA in 2022:| Southern Slopes: | $39,631 |
| Washington: | $84,303 |
Change in median household income between 2000 and 2022:| Southern Slopes, Washington: | +118.1% |
| State: | +125.7% |
Number of households with income < $10k:| Southern Slopes: | 4.3% (2,928) |
| State: | 4.3% (12,040) |
Number of households with income $10k - 20k:| Southern Slopes: | 6.6% (4,485) |
| State: | 6.6% (18,437) |
Number of households with income $20k - 30k:| Southern Slopes: | 5.2% (3,539) |
| State: | 5.2% (14,559) |
Number of households with income $30k - 40k:| Southern Slopes: | 6.7% (4,497) |
| Washington: | 6.7% (18,491) |
Number of households with income $40k - 50k:| Southern Slopes: | 6.3% (4,248) |
| State: | 6.3% (17,459) |
Number of households with income $50k - 60k:| Southern Slopes: | 6.9% (4,640) |
| Washington: | 6.9% (19,086) |
Number of households with income $60k - 75k:| Southern Slopes: | 9.1% (6,156) |
| State: | 9.1% (25,310) |
Number of households with income $75k - 100k:| Southern Slopes: | 13.5% (9,117) |
| Washington: | 13.5% (37,493) |
Number of households with income $100k - 125k:| Southern Slopes: | 10.7% (7,203) |
| State: | 10.7% (29,626) |
Number of households with income $125k - 150k:| Southern Slopes: | 8.6% (5,812) |
| State: | 8.6% (23,899) |
Number of households with income $150k - 200k:| Southern Slopes: | 10.2% (6,864) |
| State: | 10.2% (28,214) |
Number of households with income > $200k:| Southern Slopes: | 11.9% (8,011) |
| State: | 11.9% (32,947) |
Aggregate household income in Southern Slopes in 2022: $26,266,588
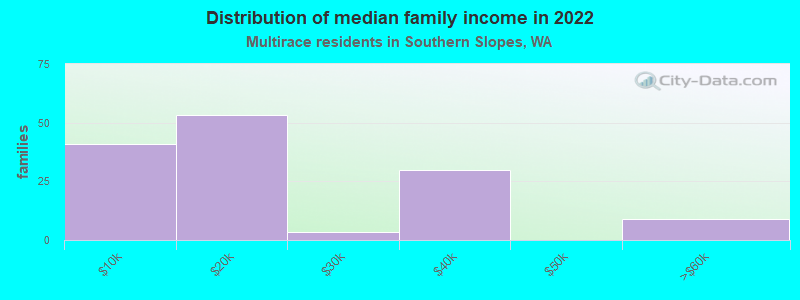
Median family income in Southern Slopes in 2022:| Southern Slopes: | $42,899 |
| State: | $95,629 |
Number of families with income < $10k:| Southern Slopes: | 30.0% (41) |
| State: | 3.5% (6,121) |
Number of families with income $10k - 20k:| Southern Slopes: | 39.0% (53) |
| State: | 4.3% (7,519) |
Number of families with income $20k - 30k:| Southern Slopes: | 2.6% (4) |
| State: | 4.4% (7,775) |
Number of families with income $30k - 40k:| Southern Slopes: | 21.7% (30) |
| Washington: | 5.8% (10,186) |
Number of families with income $50k - 60k:| Southern Slopes: | 6.6% (9) |
| Washington: | 5.6% (9,922) |
Median non-family income in Southern Slopes in 2022:| Southern Slopes: | $32,423 |
| State: | $56,573 |
Change in median non-family income between 2000 and 2022:| Southern Slopes, Washington: | +52.6% |
| Washington: | +115.0% |
Median per capita income in Southern Slopes in 2022:| Southern Slopes: | $13,383 |
| State: | $32,496 |
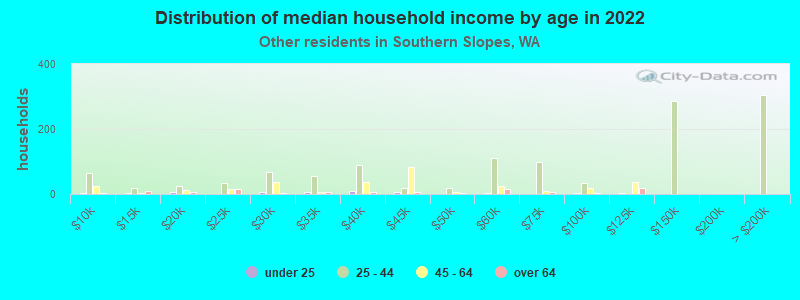
Income statistics for other residents
Number of households with income < $10k:| Southern Slopes: | 3.9% (78) |
| State: | 5.3% (6,540) |
Number of households with income $10k - 20k:| Southern Slopes: | 6.9% (137) |
| State: | 6.0% (7,385) |
Number of households with income $20k - 30k:| Southern Slopes: | 9.2% (184) |
| State: | 7.5% (9,289) |
Number of households with income $30k - 40k:| Southern Slopes: | 10.2% (204) |
| Washington: | 8.9% (11,015) |
Number of households with income $40k - 50k:| Southern Slopes: | 8.7% (174) |
| State: | 7.6% (9,399) |
Number of households with income $50k - 60k:| Southern Slopes: | 8.0% (159) |
| State: | 7.2% (8,867) |
Number of households with income $60k - 75k:| Southern Slopes: | 9.6% (192) |
| State: | 10.5% (13,032) |
Number of households with income $75k - 100k:| Southern Slopes: | 13.1% (261) |
| State: | 14.6% (18,007) |
Number of households with income $100k - 125k:| Southern Slopes: | 12.4% (247) |
| Washington: | 12.2% (15,128) |
Number of households with income $125k - 150k:| Southern Slopes: | 5.2% (103) |
| Washington: | 5.6% (6,950) |
Number of households with income $150k - 200k:| Southern Slopes: | 6.1% (121) |
| Washington: | 7.1% (8,749) |
Number of households with income > $200k:| Southern Slopes: | 6.8% (135) |
| State: | 7.5% (9,208) |
Aggregate household income in Southern Slopes in 2022: $103,072,197
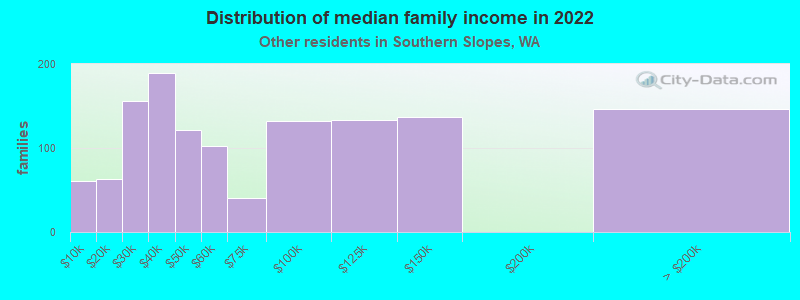
Median family income in Southern Slopes in 2022:| Southern Slopes: | $73,625 |
| State: | $72,588 |
Number of families with income < $10k:| Southern Slopes: | 4.8% (61) |
| Washington: | 5.5% (5,287) |
Number of families with income $10k - 20k:| Southern Slopes: | 4.9% (63) |
| State: | 4.0% (3,814) |
Number of families with income $20k - 30k:| Southern Slopes: | 12.2% (156) |
| Washington: | 6.6% (6,293) |
Number of families with income $30k - 40k:| Southern Slopes: | 14.7% (189) |
| Washington: | 9.2% (8,827) |
Number of families with income $40k - 50k:| Southern Slopes: | 9.5% (122) |
| Washington: | 8.0% (7,634) |
Number of families with income $50k - 60k:| Southern Slopes: | 7.9% (102) |
| State: | 7.7% (7,357) |
Number of families with income $60k - 75k:| Southern Slopes: | 3.2% (41) |
| State: | 10.3% (9,864) |
Number of families with income $75k - 100k:| Southern Slopes: | 10.3% (132) |
| State: | 14.5% (13,800) |
Number of families with income $100k - 125k:| Southern Slopes: | 10.4% (133) |
| Washington: | 12.9% (12,298) |
Number of families with income $125k - 150k:| Southern Slopes: | 10.7% (137) |
| State: | 6.0% (5,679) |
Number of families with income > $200k:| Southern Slopes: | 11.4% (146) |
| State: | 7.1% (6,764) |
Median non-family income in Southern Slopes in 2022:| Southern Slopes: | $23,766 |
| State: | $44,777 |
Change in median non-family income between 2000 and 2022:| Southern Slopes, Washington: | +90.1% |
| State: | +84.2% |
Median per capita income in Southern Slopes in 2022:| Southern Slopes: | $19,331 |
| Washington: | $27,542 |
Change in median per capita income between 2000 and 2022:| Southern Slopes, Washington: | +118.1% |
| State: | +167.8% |