The median household income in Shelbyville, TN in 2022 was $51,659, which was 26.3% less than the median annual income of $65,254 across the entire state of Tennessee. Compared to the median income of $31,593 in 2000 this represents an increase of 38.8%. The per capita income in 2022 was $23,327, which means an increase of 38.9% compared to 2000 when it was $14,260.
Whole page based on the data from 2000 / 2022 when the population of Shelbyville, Tennessee was 16,105 / 24,112
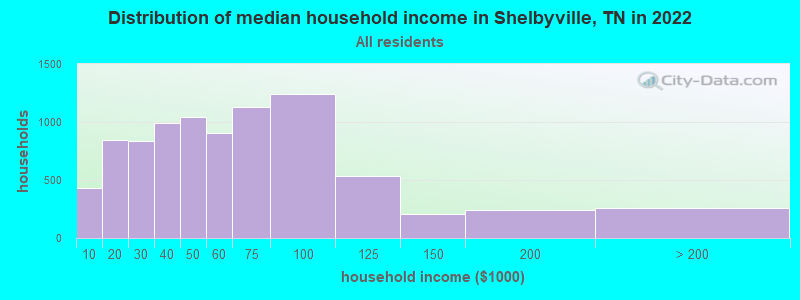
Income statistics for all residents
Median household income in Shelbyville, TN in 2022:
Shelbyville:
$51,659
Tennessee:
$65,254
Change in median household income between 2000 and 2022:
Shelbyville, Tennessee:
+63.5%
Tennessee:
+79.5%
Number of households with income < $10k:
Shelbyville:
5.0% (429)
State:
5.4% (154,793)
Number of households with income $10k - 20k:
Shelbyville:
9.8% (848)
Tennessee:
8.0% (228,599)
Number of households with income $20k - 30k:
Shelbyville:
9.7% (839)
Tennessee:
7.9% (224,908)
Number of households with income $30k - 40k:
Shelbyville:
11.5% (995)
State:
8.6% (244,297)
Number of households with income $40k - 50k:
Shelbyville:
12.0% (1,041)
Tennessee:
8.4% (238,949)
Number of households with income $50k - 60k:
Shelbyville:
10.4% (903)
State:
7.7% (218,438)
Number of households with income $60k - 75k:
Shelbyville:
13.0% (1,127)
Tennessee:
10.3% (294,172)
Number of households with income $75k - 100k:
Shelbyville:
14.3% (1,239)
Tennessee:
13.3% (377,310)
Number of households with income $100k - 125k:
Shelbyville:
6.1% (531)
Tennessee:
9.5% (269,124)
Number of households with income $125k - 150k:
Shelbyville:
2.4% (207)
State:
6.3% (178,328)
Number of households with income $150k - 200k:
Shelbyville:
2.8% (245)
State:
7.2% (204,030)
Number of households with income > $200k:
Shelbyville:
3.0% (256)
Tennessee:
7.5% (213,736)
Aggregate household income in Shelbyville in 2022: $538,085,086
Median family income in Shelbyville in 2022:
Shelbyville:
$55,590
Tennessee:
$80,910
Number of families with income < $10k:
Shelbyville:
5.3% (296)
Tennessee:
3.9% (72,917)
Number of families with income $10k - 20k:
Shelbyville:
9.0% (498)
State:
4.0% (73,770)
Number of families with income $20k - 30k:
Shelbyville:
8.8% (488)
Tennessee:
5.6% (104,070)
Number of families with income $30k - 40k:
Shelbyville:
10.4% (579)
State:
7.2% (133,292)
Number of families with income $40k - 50k:
Shelbyville:
11.1% (617)
Tennessee:
7.4% (136,997)
Number of families with income $50k - 60k:
Shelbyville:
7.5% (417)
State:
7.1% (131,374)
Number of families with income $60k - 75k:
Shelbyville:
13.0% (721)
State:
10.8% (198,685)
Number of families with income $75k - 100k:
Shelbyville:
18.5% (1,026)
State:
15.1% (279,195)
Number of families with income $100k - 125k:
Shelbyville:
8.0% (445)
State:
11.7% (216,356)
Number of families with income $125k - 150k:
Shelbyville:
1.7% (92)
State:
7.8% (144,000)
Number of families with income $150k - 200k:
Shelbyville:
4.4% (243)
Tennessee:
9.3% (172,160)
Number of families with income > $200k:
Shelbyville:
2.4% (133)
State:
10.0% (183,756)
Median non-family income in Shelbyville in 2022:
Shelbyville:
$41,232
Tennessee:
$40,285
Change in median non-family income between 2000 and 2022:
Shelbyville, Tennessee:
+149.0%
State:
+91.5%
Median per capita income in Shelbyville in 2022:
Shelbyville:
$23,327
Tennessee:
$36,704
Change in median per capita income between 2000 and 2022:
Shelbyville, Tennessee:
+63.6%
State:
+89.3%
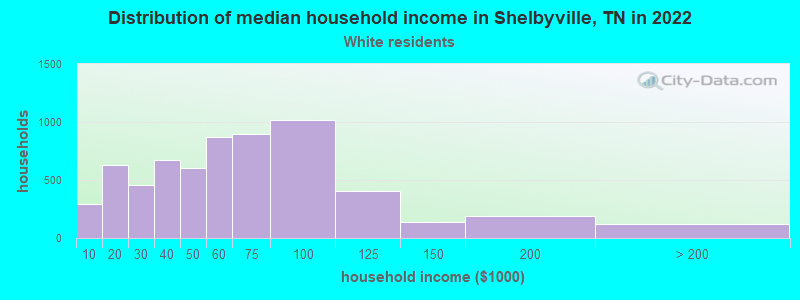
Income statistics for White residents
Median household income in Shelbyville, TN in 2022:
Shelbyville:
$54,778
Tennessee:
$69,826
Change in median household income between 2000 and 2022:
Shelbyville, Tennessee:
+69.1%
State:
+82.9%
Number of households with income < $10k:
Shelbyville:
4.7% (295)
Tennessee:
4.6% (100,279)
Number of households with income $10k - 20k:
Shelbyville:
10.0% (629)
State:
7.6% (165,031)
Number of households with income $20k - 30k:
Shelbyville:
7.3% (461)
Tennessee:
7.4% (160,229)
Number of households with income $30k - 40k:
Shelbyville:
10.7% (675)
Tennessee:
8.1% (174,784)
Number of households with income $40k - 50k:
Shelbyville:
9.6% (602)
Tennessee:
7.8% (169,622)
Number of households with income $50k - 60k:
Shelbyville:
13.9% (874)
Tennessee:
7.6% (165,508)
Number of households with income $60k - 75k:
Shelbyville:
14.2% (895)
Tennessee:
10.3% (223,937)
Number of households with income $75k - 100k:
Shelbyville:
16.2% (1,019)
State:
13.5% (292,688)
Number of households with income $100k - 125k:
Shelbyville:
6.4% (404)
Tennessee:
10.1% (219,251)
Number of households with income $125k - 150k:
Shelbyville:
2.2% (136)
Tennessee:
6.6% (142,574)
Number of households with income $150k - 200k:
Shelbyville:
3.0% (187)
Tennessee:
7.7% (166,039)
Number of households with income > $200k:
Shelbyville:
1.9% (117)
Tennessee:
8.5% (184,546)
Aggregate household income in Shelbyville in 2022: $396,444,715
Median family income in Shelbyville in 2022:
Shelbyville:
$55,476
State:
$86,015
Number of families with income < $10k:
Shelbyville:
5.0% (211)
State:
3.1% (43,751)
Number of families with income $10k - 20k:
Shelbyville:
9.3% (392)
State:
3.5% (49,925)
Number of families with income $20k - 30k:
Shelbyville:
9.1% (380)
Tennessee:
5.0% (70,431)
Number of families with income $30k - 40k:
Shelbyville:
9.3% (388)
Tennessee:
6.6% (93,498)
Number of families with income $40k - 50k:
Shelbyville:
11.1% (464)
Tennessee:
6.8% (96,726)
Number of families with income $50k - 60k:
Shelbyville:
8.4% (351)
State:
7.2% (101,879)
Number of families with income $60k - 75k:
Shelbyville:
12.1% (507)
Tennessee:
10.7% (151,997)
Number of families with income $75k - 100k:
Shelbyville:
19.9% (835)
State:
15.4% (218,373)
Number of families with income $100k - 125k:
Shelbyville:
7.6% (320)
Tennessee:
12.6% (178,761)
Number of families with income $125k - 150k:
Shelbyville:
1.5% (62)
State:
8.2% (116,575)
Number of families with income $150k - 200k:
Shelbyville:
4.4% (185)
State:
9.9% (141,123)
Number of families with income > $200k:
Shelbyville:
2.4% (102)
State:
11.2% (159,431)
Median non-family income in Shelbyville in 2022:
Shelbyville:
$48,704
State:
$41,178
Median per capita income in Shelbyville in 2022:
Shelbyville:
$24,523
State:
$40,126
Change in median per capita income between 2000 and 2022:
Shelbyville, Tennessee:
+60.3%
State:
+92.6%
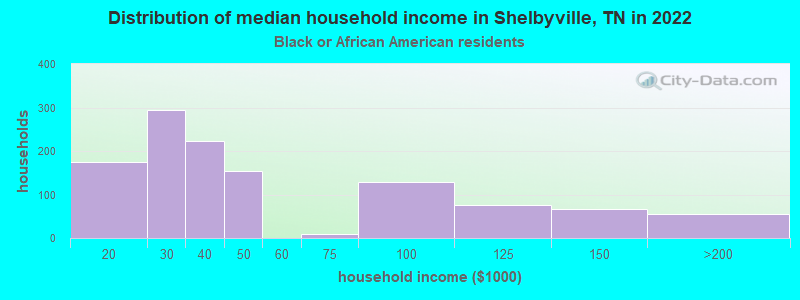
Income statistics for Black or African American residents
Median household income in Shelbyville, TN in 2022:
Shelbyville:
$38,721
Tennessee:
$49,531
Change in median household income between 2000 and 2022:
Shelbyville, Tennessee:
+57.9%
Tennessee:
+82.3%
Number of households with income < $10k:
Shelbyville:
0.0% (0)
Tennessee:
9.1% (39,909)
Number of households with income $10k - 20k:
Shelbyville:
14.7% (174)
Tennessee:
10.5% (46,276)
Number of households with income $20k - 30k:
Shelbyville:
25.0% (295)
State:
10.2% (45,072)
Number of households with income $30k - 40k:
Shelbyville:
18.8% (222)
State:
10.0% (43,885)
Number of households with income $40k - 50k:
Shelbyville:
12.9% (153)
State:
10.7% (47,267)
Number of households with income $50k - 60k:
Shelbyville:
0.0% (0)
Tennessee:
7.7% (33,868)
Number of households with income $60k - 75k:
Shelbyville:
0.8% (9)
Tennessee:
10.5% (46,247)
Number of households with income $75k - 100k:
Shelbyville:
10.9% (129)
Tennessee:
12.6% (55,465)
Number of households with income $100k - 125k:
Shelbyville:
6.5% (77)
State:
6.7% (29,515)
Number of households with income $125k - 150k:
Shelbyville:
5.7% (67)
State:
4.8% (21,306)
Number of households with income $150k - 200k:
Shelbyville:
4.7% (56)
Tennessee:
4.6% (20,425)
Number of households with income > $200k:
Shelbyville:
0.0% (0)
State:
2.5% (11,183)
Aggregate household income in Shelbyville in 2022: $64,268,649
Median non-family income in Shelbyville in 2022:
Shelbyville:
$26,564
Tennessee:
$35,793
Change in median non-family income between 2000 and 2022:
Shelbyville, Tennessee:
+89.7%
State:
+104.3%
Median per capita income in Shelbyville in 2022:
Shelbyville:
$27,018
Tennessee:
$27,306
Change in median per capita income between 2000 and 2022:
Shelbyville, Tennessee:
+137.8%
State:
+105.3%
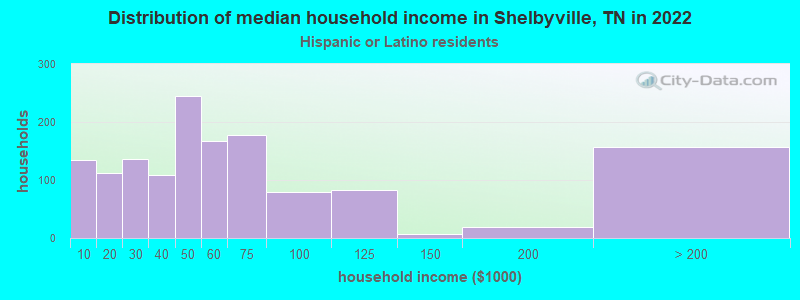
Income statistics for Hispanic or Latino residents
Median household income in Shelbyville, TN in 2022:
Shelbyville:
$51,631
State:
$58,385
Change in median household income between 2000 and 2022:
Shelbyville, Tennessee:
+21.6%
Tennessee:
+82.3%
Number of households with income < $10k:
Shelbyville:
9.5% (135)
State:
7.2% (8,567)
Number of households with income $10k - 20k:
Shelbyville:
7.8% (112)
Tennessee:
6.4% (7,670)
Number of households with income $20k - 30k:
Shelbyville:
9.6% (137)
Tennessee:
9.4% (11,247)
Number of households with income $30k - 40k:
Shelbyville:
7.6% (109)
State:
10.1% (12,072)
Number of households with income $40k - 50k:
Shelbyville:
17.1% (244)
Tennessee:
10.0% (11,947)
Number of households with income $50k - 60k:
Shelbyville:
11.8% (168)
Tennessee:
8.0% (9,569)
Number of households with income $60k - 75k:
Shelbyville:
12.5% (178)
State:
10.3% (12,315)
Number of households with income $75k - 100k:
Shelbyville:
5.5% (79)
State:
15.3% (18,285)
Number of households with income $100k - 125k:
Shelbyville:
5.8% (83)
State:
8.3% (9,886)
Number of households with income $125k - 150k:
Shelbyville:
0.5% (7)
State:
5.9% (7,066)
Number of households with income $150k - 200k:
Shelbyville:
1.3% (19)
State:
4.9% (5,822)
Number of households with income > $200k:
Shelbyville:
11.0% (157)
State:
4.5% (5,337)
Aggregate household income in Shelbyville in 2022: $96,550,932
Median family income in Shelbyville in 2022:
Shelbyville:
$48,429
State:
$64,014
Number of families with income < $10k:
Shelbyville:
7.5% (76)
State:
6.5% (5,773)
Number of families with income $10k - 20k:
Shelbyville:
12.6% (128)
State:
5.4% (4,773)
Number of families with income $20k - 30k:
Shelbyville:
10.8% (110)
State:
9.2% (8,233)
Number of families with income $30k - 40k:
Shelbyville:
16.6% (169)
State:
9.6% (8,514)
Number of families with income $40k - 50k:
Shelbyville:
7.7% (78)
Tennessee:
8.8% (7,850)
Number of families with income $50k - 60k:
Shelbyville:
9.8% (99)
State:
7.9% (7,017)
Number of families with income $60k - 75k:
Shelbyville:
15.8% (161)
State:
10.8% (9,605)
Number of families with income $75k - 100k:
Shelbyville:
6.7% (68)
Tennessee:
16.6% (14,820)
Number of families with income $100k - 125k:
Shelbyville:
4.4% (45)
State:
8.4% (7,480)
Number of families with income $125k - 150k:
Shelbyville:
0.7% (7)
State:
6.3% (5,594)
Number of families with income $150k - 200k:
Shelbyville:
2.0% (21)
State:
5.4% (4,817)
Number of families with income > $200k:
Shelbyville:
5.3% (54)
Tennessee:
5.1% (4,577)
Median non-family income in Shelbyville in 2022:
Shelbyville:
$41,783
State:
$39,279
Change in median non-family income between 2000 and 2022:
Shelbyville, Tennessee:
+0.7%
State:
+69.2%
Median per capita income in Shelbyville in 2022:
Shelbyville:
$17,472
State:
$21,276
Change in median per capita income between 2000 and 2022:
Shelbyville, Tennessee:
+89.0%
Tennessee:
+76.0%
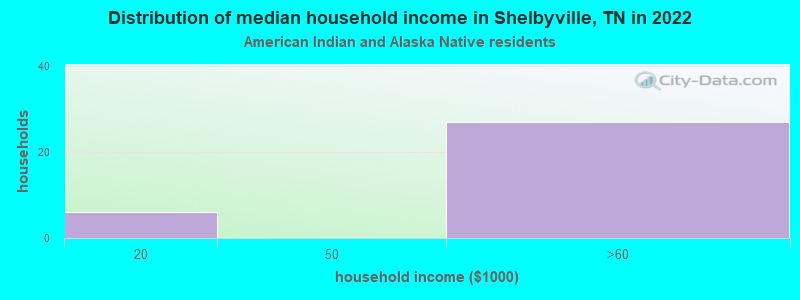
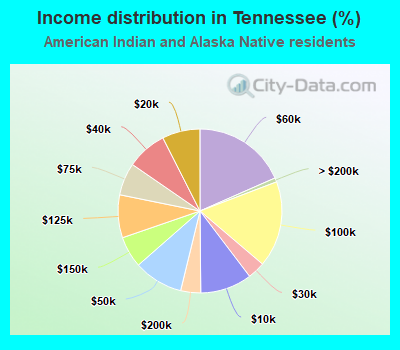
Income statistics for American Indian and Alaska Native residents
Number of households with income < $10k:
Shelbyville:
0.0% (0)
Tennessee:
10.2% (535)
Number of households with income $10k - 20k:
Shelbyville:
18.2% (6)
State:
7.5% (392)
Number of households with income $20k - 30k:
Shelbyville:
0.0% (0)
Tennessee:
3.4% (181)
Number of households with income $30k - 40k:
Shelbyville:
0.0% (0)
State:
7.9% (416)
Number of households with income $40k - 50k:
Shelbyville:
0.0% (0)
State:
9.7% (511)
Number of households with income $50k - 60k:
Shelbyville:
81.8% (27)
Tennessee:
18.4% (966)
Number of households with income $60k - 75k:
Shelbyville:
0.0% (0)
Tennessee:
6.4% (337)
Number of households with income $75k - 100k:
Shelbyville:
0.0% (0)
Tennessee:
17.0% (892)
Number of households with income $100k - 125k:
Shelbyville:
0.0% (0)
State:
8.5% (444)
Number of households with income $125k - 150k:
Shelbyville:
0.0% (0)
State:
6.2% (324)
Number of households with income $150k - 200k:
Shelbyville:
0.0% (0)
State:
3.9% (207)
Number of households with income > $200k:
Shelbyville:
0.0% (0)
State:
0.8% (43)
Aggregate household income in Shelbyville in 2022: $2,842,361
Median per capita income in Shelbyville in 2022:
Shelbyville:
$1,840
Tennessee:
$25,981
Change in median per capita income between 2000 and 2022:: -91.8%
Shelbyville, Tennessee:
-91.8%
State:
+40.2%
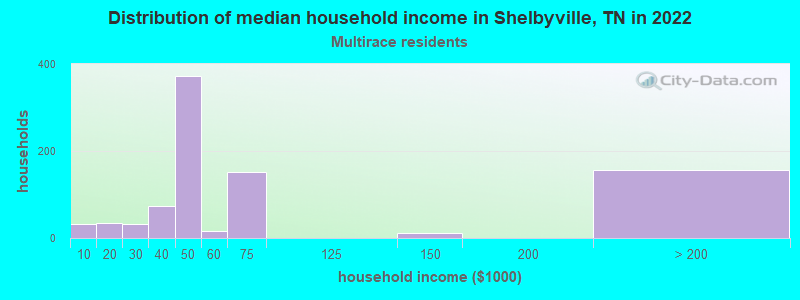
Income statistics for Multirace residents
Median household income in Shelbyville, TN in 2022:
Shelbyville:
$45,628
State:
$57,741
Change in median household income between 2000 and 2022:
Shelbyville, Tennessee:
+113.2%
Tennessee:
+87.1%
Number of households with income < $10k:
Shelbyville:
3.6% (32)
Tennessee:
6.7% (9,867)
Number of households with income $10k - 20k:
Shelbyville:
3.9% (34)
State:
8.6% (12,639)
Number of households with income $20k - 30k:
Shelbyville:
3.7% (33)
State:
9.2% (13,555)
Number of households with income $30k - 40k:
Shelbyville:
8.4% (74)
Tennessee:
10.3% (15,117)
Number of households with income $40k - 50k:
Shelbyville:
42.2% (372)
State:
9.4% (13,829)
Number of households with income $50k - 60k:
Shelbyville:
1.9% (17)
State:
7.5% (10,969)
Number of households with income $60k - 75k:
Shelbyville:
17.2% (152)
State:
9.2% (13,568)
Number of households with income $75k - 100k:
Shelbyville:
0.0% (0)
State:
12.6% (18,516)
Number of households with income $100k - 125k:
Shelbyville:
0.0% (0)
State:
8.6% (12,656)
Number of households with income $125k - 150k:
Shelbyville:
1.2% (11)
Tennessee:
5.9% (8,674)
Number of households with income $150k - 200k:
Shelbyville:
0.0% (0)
State:
7.2% (10,611)
Number of households with income > $200k:
Shelbyville:
17.8% (157)
Tennessee:
4.8% (6,986)
Aggregate household income in Shelbyville in 2022: $73,603,620
Median family income in Shelbyville in 2022:
Shelbyville:
$48,287
State:
$70,058
Number of families with income < $10k:
Shelbyville:
5.3% (25)
Tennessee:
5.6% (5,426)
Number of families with income $10k - 20k:
Shelbyville:
16.3% (75)
State:
6.6% (6,301)
Number of families with income $20k - 30k:
Shelbyville:
1.4% (6)
State:
7.7% (7,412)
Number of families with income $30k - 40k:
Shelbyville:
12.6% (58)
State:
9.0% (8,699)
Number of families with income $40k - 50k:
Shelbyville:
20.9% (96)
State:
8.2% (7,919)
Number of families with income $50k - 60k:
Shelbyville:
1.4% (6)
State:
6.9% (6,630)
Number of families with income $60k - 75k:
Shelbyville:
31.0% (143)
Tennessee:
9.6% (9,232)
Number of families with income $125k - 150k:
Shelbyville:
2.3% (11)
State:
7.3% (7,035)
Number of families with income > $200k:
Shelbyville:
8.6% (39)
State:
6.2% (5,974)
Median per capita income in Shelbyville in 2022:
Shelbyville:
$23,905
Tennessee:
$24,436
Change in median per capita income between 2000 and 2022:
Shelbyville, Tennessee:
+117.0%
State:
+84.3%
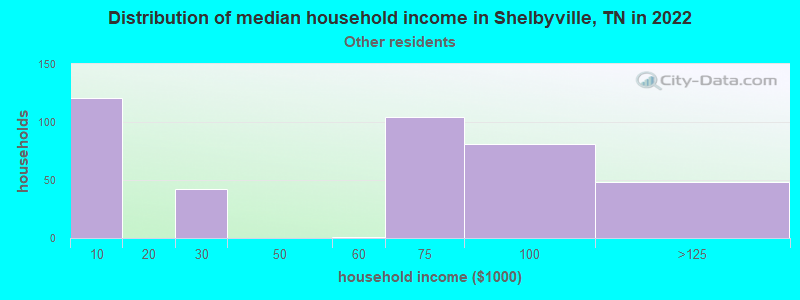
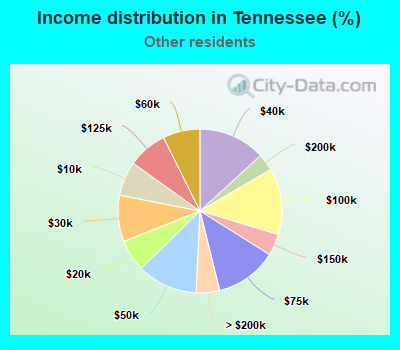
Income statistics for other residents
Median household income in Shelbyville, TN in 2022:
Shelbyville:
$60,459
Tennessee:
$54,475
Number of households with income < $10k:
Shelbyville:
30.5% (121)
State:
6.8% (2,986)
Number of households with income $10k - 20k:
Shelbyville:
0.0% (0)
State:
6.3% (2,777)
Number of households with income $20k - 30k:
Shelbyville:
10.6% (42)
State:
9.2% (4,034)
Number of households with income $30k - 40k:
Shelbyville:
0.0% (0)
State:
13.2% (5,819)
Number of households with income $40k - 50k:
Shelbyville:
0.0% (0)
Tennessee:
11.9% (5,244)
Number of households with income $50k - 60k:
Shelbyville:
0.3% (1)
State:
7.3% (3,232)
Number of households with income $60k - 75k:
Shelbyville:
26.2% (104)
State:
12.2% (5,384)
Number of households with income $75k - 100k:
Shelbyville:
20.4% (81)
State:
13.1% (5,771)
Number of households with income $100k - 125k:
Shelbyville:
12.1% (48)
State:
7.8% (3,429)
Number of households with income $125k - 150k:
Shelbyville:
0.0% (0)
Tennessee:
4.3% (1,881)
Number of households with income $150k - 200k:
Shelbyville:
0.0% (0)
Tennessee:
3.4% (1,486)
Number of households with income > $200k:
Shelbyville:
0.0% (0)
Tennessee:
4.6% (2,040)
Aggregate household income in Shelbyville in 2022: $18,105,744
Median family income in Shelbyville in 2022:
Shelbyville:
$66,388
Tennessee:
$60,601
Number of families with income < $10k:
Shelbyville:
21.4% (75)
Tennessee:
6.9% (2,348)
Number of families with income $20k - 30k:
Shelbyville:
7.9% (28)
Tennessee:
9.5% (3,232)
Number of families with income $50k - 60k:
Shelbyville:
0.3% (1)
State:
7.0% (2,361)
Number of families with income $60k - 75k:
Shelbyville:
34.4% (120)
State:
12.1% (4,114)
Number of families with income $75k - 100k:
Shelbyville:
21.0% (73)
State:
16.5% (5,571)
Number of families with income $100k - 125k:
Shelbyville:
15.0% (52)
State:
8.1% (2,757)
Median per capita income in Shelbyville in 2022:
Shelbyville:
$11,462
State:
$21,430
Change in median per capita income between 2000 and 2022:
Shelbyville, Tennessee:
+46.2%
Tennessee:
+105.6%
Discuss Shelbyville, Tennessee (TN) on our hugely popular Tennessee forum.