The median household income in Putnam, CT in 2022 was $72,778, which was 21.5% less than the median annual income of $88,429 across the entire state of Connecticut. Compared to the median income of $43,010 in 2000 this represents an increase of 40.9%. The per capita income in 2022 was $37,678, which means an increase of 45.3% compared to 2000 when it was $20,597.
Income statistics for all residents
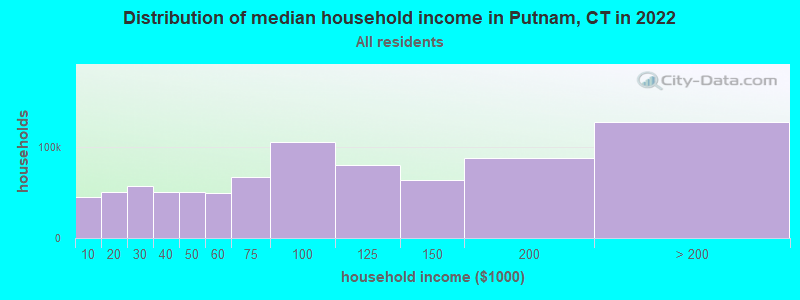
Median household income in Putnam, CT in 2022:
Putnam:
$72,779
State:
$88,429
Change in median household income between 2000 and 2022:
Putnam, Connecticut:
+69.2%
State:
+64.0%
Number of households with income < $10k:
Putnam:
5.2% (29,644)
Connecticut:
5.1% (72,746)
Number of households with income $10k - 20k:
Putnam:
5.8% (33,428)
State:
5.7% (81,643)
Number of households with income $20k - 30k:
Putnam:
6.6% (37,838)
State:
6.5% (92,844)
Number of households with income $30k - 40k:
Putnam:
5.9% (33,957)
State:
5.9% (83,934)
Number of households with income $40k - 50k:
Putnam:
5.9% (33,739)
State:
5.8% (83,025)
Number of households with income $50k - 60k:
Putnam:
5.8% (33,083)
Connecticut:
5.7% (81,788)
Number of households with income $60k - 75k:
Putnam:
8.1% (46,354)
State:
8.1% (115,651)
Number of households with income $75k - 100k:
Putnam:
12.6% (72,394)
Connecticut:
12.6% (180,173)
Number of households with income $100k - 125k:
Putnam:
9.8% (56,358)
State:
9.9% (141,231)
Number of households with income $125k - 150k:
Putnam:
7.8% (45,007)
State:
7.9% (112,826)
Number of households with income $150k - 200k:
Putnam:
10.7% (61,566)
State:
10.8% (154,641)
Number of households with income > $200k:
Putnam:
16.0% (91,976)
Connecticut:
16.3% (233,133)
Aggregate household income in Putnam in 2022: $7,768,626,985
Median family income in Putnam in 2022:
Putnam:
$95,479
State:
$115,183
Median non-family income in Putnam in 2022:
Putnam:
$43,108
State:
$50,964
Change in median non-family income between 2000 and 2022:
Putnam, Connecticut:
+71.5%
Connecticut:
+65.1%
Median per capita income in Putnam in 2022:
Putnam:
$37,678
State:
$51,581
Change in median per capita income between 2000 and 2022:
Putnam, Connecticut:
+82.9%
State:
+79.3%
Income statistics for White residents
Median household income in Putnam, CT in 2022:
Putnam:
$72,980
Connecticut:
$96,890
Change in median household income between 2000 and 2022:
Putnam, Connecticut:
+69.4%
Connecticut:
+68.5%
Number of households with income < $10k:
Putnam:
4.2% (15,962)
State:
4.2% (42,265)
Number of households with income $10k - 20k:
Putnam:
4.9% (18,352)
State:
4.8% (48,323)
Number of households with income $20k - 30k:
Putnam:
5.8% (21,825)
State:
5.7% (57,716)
Number of households with income $30k - 40k:
Putnam:
5.4% (20,202)
State:
5.3% (53,827)
Number of households with income $40k - 50k:
Putnam:
5.3% (20,119)
State:
5.3% (53,301)
Number of households with income $50k - 60k:
Putnam:
5.6% (20,938)
Connecticut:
5.5% (55,690)
Number of households with income $60k - 75k:
Putnam:
7.9% (29,921)
Connecticut:
8.0% (80,329)
Number of households with income $75k - 100k:
Putnam:
12.7% (47,945)
State:
12.7% (128,070)
Number of households with income $100k - 125k:
Putnam:
10.0% (37,648)
Connecticut:
10.0% (101,210)
Number of households with income $125k - 150k:
Putnam:
8.0% (30,225)
Connecticut:
8.0% (81,250)
Number of households with income $150k - 200k:
Putnam:
11.8% (44,443)
State:
11.8% (119,527)
Number of households with income > $200k:
Putnam:
18.4% (69,573)
Connecticut:
18.6% (187,875)
Aggregate household income in Putnam in 2022: $5,723,241,227
Median family income in Putnam in 2022:
Putnam:
$98,150
State:
$128,955
Number of families with income < $10k:
Putnam:
5.8% (73)
State:
1.9% (11,537)
Number of families with income $10k - 20k:
Putnam:
3.7% (47)
Connecticut:
1.8% (11,289)
Number of families with income $20k - 30k:
Putnam:
6.3% (80)
State:
3.0% (18,506)
Number of families with income $30k - 40k:
Putnam:
7.9% (100)
State:
2.9% (18,160)
Number of families with income $40k - 50k:
Putnam:
9.2% (117)
Connecticut:
3.9% (24,550)
Number of families with income $50k - 60k:
Putnam:
8.9% (113)
Connecticut:
4.3% (26,723)
Number of families with income $60k - 75k:
Putnam:
13.1% (166)
State:
7.1% (44,075)
Number of families with income $75k - 100k:
Putnam:
16.4% (208)
Connecticut:
12.5% (77,679)
Number of families with income $100k - 125k:
Putnam:
9.1% (116)
State:
11.1% (69,086)
Number of families with income $125k - 150k:
Putnam:
4.6% (59)
State:
9.6% (59,616)
Number of families with income $150k - 200k:
Putnam:
4.8% (61)
Connecticut:
15.7% (97,890)
Number of families with income > $200k:
Putnam:
10.2% (130)
Connecticut:
26.3% (163,417)
Median non-family income in Putnam in 2022:
Putnam:
$43,636
State:
$54,067
Change in median non-family income between 2000 and 2022:
Putnam, Connecticut:
+73.7%
State:
+68.7%
Median per capita income in Putnam in 2022:
Putnam:
$40,254
State:
$59,916
Change in median per capita income between 2000 and 2022:
Putnam, Connecticut:
+92.1%
Connecticut:
+90.2%
Income statistics for Black or African American residents
Median household income in Putnam, CT in 2022:
Putnam:
$31,779
State:
$61,803
Change in median household income between 2000 and 2022:
Putnam, Connecticut:
+60.9%
Connecticut:
+76.1%
Number of households with income < $10k:
Putnam:
6.8% (5,341)
State:
6.8% (9,494)
Number of households with income $10k - 20k:
Putnam:
7.9% (6,191)
State:
7.9% (11,003)
Number of households with income $20k - 30k:
Putnam:
10.8% (8,465)
State:
10.8% (15,045)
Number of households with income $30k - 40k:
Putnam:
8.2% (6,470)
State:
8.2% (11,501)
Number of households with income $40k - 50k:
Putnam:
7.4% (5,860)
State:
7.4% (10,416)
Number of households with income $50k - 60k:
Putnam:
7.5% (5,927)
State:
7.5% (10,534)
Number of households with income $60k - 75k:
Putnam:
8.0% (6,326)
Connecticut:
8.0% (11,244)
Number of households with income $75k - 100k:
Putnam:
9.6% (7,522)
State:
9.6% (13,370)
Number of households with income $100k - 125k:
Putnam:
10.2% (8,014)
State:
10.2% (14,244)
Number of households with income $125k - 150k:
Putnam:
8.0% (6,327)
State:
8.0% (11,246)
Number of households with income $150k - 200k:
Putnam:
7.7% (6,035)
State:
7.7% (10,727)
Number of households with income > $200k:
Putnam:
7.9% (6,237)
Connecticut:
7.9% (11,086)
Aggregate household income in Putnam in 2022: $11,629,023
Median family income in Putnam in 2022:
Putnam:
$42,897
State:
$87,228
Number of families with income $10k - 20k:
Putnam:
26.3% (15)
State:
4.8% (4,026)
Number of families with income $20k - 30k:
Putnam:
7.7% (4)
Connecticut:
6.0% (5,015)
Number of families with income $50k - 60k:
Putnam:
13.0% (7)
State:
5.4% (4,480)
Number of families with income $125k - 150k:
Putnam:
53.0% (30)
State:
11.2% (9,356)
Median non-family income in Putnam in 2022:
Putnam:
$44,799
Connecticut:
$38,608
Change in median non-family income between 2000 and 2022:
Putnam, Connecticut:
+77.0%
State:
+77.0%
Median per capita income in Putnam in 2022:
Putnam:
$24,317
Connecticut:
$36,289
Change in median per capita income between 2000 and 2022:
Putnam, Connecticut:
+115.2%
State:
+117.5%
Income statistics for Asian residents
Median household income in Putnam, CT in 2022:
Putnam:
$44,644
Connecticut:
$110,568
Change in median household income between 2000 and 2022:
Putnam, Connecticut:
+110.1%
State:
+79.5%
Number of households with income < $10k:
Putnam:
7.1% (1,465)
Connecticut:
7.1% (4,245)
Number of households with income $10k - 20k:
Putnam:
3.5% (720)
State:
3.5% (2,087)
Number of households with income $20k - 30k:
Putnam:
4.1% (850)
State:
4.1% (2,464)
Number of households with income $30k - 40k:
Putnam:
4.1% (855)
Connecticut:
4.1% (2,478)
Number of households with income $40k - 50k:
Putnam:
3.3% (685)
State:
3.3% (1,983)
Number of households with income $50k - 60k:
Putnam:
3.9% (803)
State:
3.9% (2,328)
Number of households with income $60k - 75k:
Putnam:
7.0% (1,459)
Connecticut:
7.0% (4,228)
Number of households with income $75k - 100k:
Putnam:
11.5% (2,385)
Connecticut:
11.5% (6,911)
Number of households with income $100k - 125k:
Putnam:
10.2% (2,114)
State:
10.2% (6,127)
Number of households with income $125k - 150k:
Putnam:
8.5% (1,752)
State:
8.5% (5,079)
Number of households with income $150k - 200k:
Putnam:
12.4% (2,565)
Connecticut:
12.4% (7,434)
Number of households with income > $200k:
Putnam:
24.4% (5,059)
Connecticut:
24.4% (14,661)
Aggregate household income in Putnam in 2022: $603,906
Median family income in Putnam in 2022:
Putnam:
$44,160
State:
$134,548
Median per capita income in Putnam in 2022:
Putnam:
$20,364
State:
$55,295
Change in median per capita income between 2000 and 2022:
Putnam, Connecticut:
+103.6%
State:
+97.8%
Income statistics for Hispanic or Latino residents
Median household income in Putnam, CT in 2022:
Putnam:
$91,763
Connecticut:
$60,275
Change in median household income between 2000 and 2022:
Putnam, Connecticut:
+67.8%
State:
+87.9%
Number of households with income < $10k:
Putnam:
8.7% (31,686)
State:
8.7% (18,584)
Number of households with income $10k - 20k:
Putnam:
9.1% (32,795)
Connecticut:
9.1% (19,235)
Number of households with income $20k - 30k:
Putnam:
8.9% (32,376)
State:
8.9% (18,989)
Number of households with income $30k - 40k:
Putnam:
7.5% (27,223)
State:
7.5% (15,967)
Number of households with income $40k - 50k:
Putnam:
8.7% (31,485)
State:
8.7% (18,466)
Number of households with income $50k - 60k:
Putnam:
6.9% (25,074)
State:
6.9% (14,706)
Number of households with income $60k - 75k:
Putnam:
8.9% (32,204)
Connecticut:
8.9% (18,888)
Number of households with income $75k - 100k:
Putnam:
13.5% (48,881)
Connecticut:
13.5% (28,669)
Number of households with income $100k - 125k:
Putnam:
8.2% (29,725)
State:
8.2% (17,434)
Number of households with income $125k - 150k:
Putnam:
6.5% (23,447)
State:
6.5% (13,752)
Number of households with income $150k - 200k:
Putnam:
6.6% (24,064)
State:
6.6% (14,114)
Number of households with income > $200k:
Putnam:
6.4% (23,239)
State:
6.4% (13,630)
Aggregate household income in Putnam in 2022: $11,423,348
Median family income in Putnam in 2022:
Putnam:
$93,561
Connecticut:
$68,336
Number of families with income < $10k:
Putnam:
8.2% (37)
Connecticut:
5.2% (7,456)
Number of families with income $10k - 20k:
Putnam:
8.0% (36)
State:
6.0% (8,616)
Number of families with income $20k - 30k:
Putnam:
14.8% (66)
Connecticut:
8.9% (12,680)
Number of families with income $30k - 40k:
Putnam:
12.5% (56)
State:
8.5% (12,090)
Number of families with income $40k - 50k:
Putnam:
13.6% (61)
Connecticut:
8.8% (12,624)
Number of families with income $50k - 60k:
Putnam:
11.6% (52)
Connecticut:
8.4% (11,924)
Number of families with income $60k - 75k:
Putnam:
9.9% (44)
State:
8.9% (12,677)
Number of families with income $75k - 100k:
Putnam:
12.0% (54)
Connecticut:
14.3% (20,457)
Number of families with income $100k - 125k:
Putnam:
4.1% (18)
Connecticut:
8.2% (11,720)
Number of families with income $125k - 150k:
Putnam:
2.5% (11)
Connecticut:
8.2% (11,729)
Number of families with income $150k - 200k:
Putnam:
1.3% (6)
Connecticut:
7.1% (10,096)
Number of families with income > $200k:
Putnam:
1.6% (7)
Connecticut:
7.4% (10,622)
Median per capita income in Putnam in 2022:
Putnam:
$14,069
Connecticut:
$28,507
Change in median per capita income between 2000 and 2022:
Putnam, Connecticut:
+80.3%
State:
+117.2%
Income statistics for American Indian and Alaska Native residents
Number of households with income < $10k:
Putnam:
8.4% (32,096)
State:
10.2% (340)
Number of households with income $10k - 20k:
Putnam:
9.4% (35,819)
State:
8.5% (283)
Number of households with income $20k - 30k:
Putnam:
8.5% (32,399)
State:
9.4% (314)
Number of households with income $30k - 40k:
Putnam:
9.1% (34,711)
State:
10.1% (337)
Number of households with income $40k - 50k:
Putnam:
8.3% (31,840)
State:
13.4% (447)
Number of households with income $50k - 60k:
Putnam:
7.8% (30,022)
State:
3.1% (104)
Number of households with income $60k - 75k:
Putnam:
9.8% (37,421)
Connecticut:
5.6% (188)
Number of households with income $75k - 100k:
Putnam:
12.6% (48,304)
State:
13.4% (447)
Number of households with income $100k - 125k:
Putnam:
9.4% (36,122)
State:
9.5% (317)
Number of households with income $125k - 150k:
Putnam:
5.6% (21,626)
State:
3.9% (131)
Number of households with income $150k - 200k:
Putnam:
6.0% (22,798)
State:
6.3% (212)
Number of households with income > $200k:
Putnam:
5.2% (19,733)
State:
6.8% (228)
Median per capita income in Putnam in 2022:
Putnam:
$6,938
State:
$25,355
Change in median per capita income between 2000 and 2022:
Putnam, Connecticut:
+45.9%
State:
+39.4%
Income statistics for Multirace residents
Median household income in Putnam, CT in 2022:
Putnam:
$121,609
State:
$77,277
Change in median household income between 2000 and 2022:
Putnam, Connecticut:
+119.4%
Connecticut:
+113.6%
Number of households with income < $10k:
Putnam:
6.0% (11,420)
State:
6.0% (7,457)
Number of households with income $10k - 20k:
Putnam:
8.1% (15,527)
State:
8.1% (10,139)
Number of households with income $20k - 30k:
Putnam:
7.0% (13,327)
Connecticut:
7.0% (8,702)
Number of households with income $30k - 40k:
Putnam:
6.9% (13,088)
State:
6.9% (8,546)
Number of households with income $40k - 50k:
Putnam:
7.0% (13,342)
Connecticut:
7.0% (8,712)
Number of households with income $50k - 60k:
Putnam:
5.9% (11,227)
State:
5.9% (7,331)
Number of households with income $60k - 75k:
Putnam:
8.5% (16,285)
Connecticut:
8.5% (10,634)
Number of households with income $75k - 100k:
Putnam:
14.1% (26,953)
State:
14.1% (17,600)
Number of households with income $100k - 125k:
Putnam:
9.9% (18,964)
State:
9.9% (12,383)
Number of households with income $125k - 150k:
Putnam:
7.2% (13,662)
State:
7.2% (8,921)
Number of households with income $150k - 200k:
Putnam:
8.8% (16,726)
Connecticut:
8.8% (10,922)
Number of households with income > $200k:
Putnam:
10.6% (20,287)
State:
10.6% (13,247)
Aggregate household income in Putnam in 2022: $49,951,581
Median family income in Putnam in 2022:
Putnam:
$135,941
State:
$84,255
Number of families with income $20k - 30k:
Putnam:
17.2% (43)
State:
6.9% (5,812)
Number of families with income $50k - 60k:
Putnam:
10.8% (27)
Connecticut:
7.6% (6,420)
Number of families with income $60k - 75k:
Putnam:
21.1% (53)
State:
7.8% (6,550)
Number of families with income $75k - 100k:
Putnam:
50.9% (129)
State:
14.5% (12,236)
Median non-family income in Putnam in 2022:
Putnam:
$58,832
State:
$44,462
Change in median non-family income between 2000 and 2022:
Putnam, Connecticut:
+81.0%
Connecticut:
+97.6%
Median per capita income in Putnam in 2022:
Putnam:
$33,144
State:
$32,794
Change in median per capita income between 2000 and 2022:
Putnam, Connecticut:
+95.5%
State:
+117.2%
Income statistics for other residents
Number of households with income < $10k:
Putnam:
9.0% (10,783)
State:
9.0% (8,596)
Number of households with income $10k - 20k:
Putnam:
10.2% (12,260)
Connecticut:
10.2% (9,773)
Number of households with income $20k - 30k:
Putnam:
9.1% (10,902)
State:
9.1% (8,691)
Number of households with income $30k - 40k:
Putnam:
7.8% (9,342)
State:
7.8% (7,447)
Number of households with income $40k - 50k:
Putnam:
8.2% (9,860)
State:
8.2% (7,860)
Number of households with income $50k - 60k:
Putnam:
6.0% (7,222)
State:
6.0% (5,757)
Number of households with income $60k - 75k:
Putnam:
9.3% (11,217)
Connecticut:
9.3% (8,942)
Number of households with income $75k - 100k:
Putnam:
14.3% (17,185)
Connecticut:
14.3% (13,700)
Number of households with income $100k - 125k:
Putnam:
7.2% (8,663)
Connecticut:
7.2% (6,906)
Number of households with income $125k - 150k:
Putnam:
6.5% (7,796)
State:
6.5% (6,215)
Number of households with income $150k - 200k:
Putnam:
6.1% (7,357)
Connecticut:
6.1% (5,865)
Number of households with income > $200k:
Putnam:
6.3% (7,608)
State:
6.3% (6,065)
Median per capita income in Putnam in 2022:
Putnam:
$36,352
Connecticut:
$29,353
Discuss Putnam, Connecticut (CT) on our hugely popular Connecticut forum.