Norwell, Massachusetts (MA) income map, earnings map, and wages data
The median household income in Norwell, MA in 2022 was $162,132, which was 41.7% greater than the median annual income of $94,488 across the entire state of Massachusetts. Compared to the median income of $87,397 in 2000 this represents an increase of 46.1%. The per capita income in 2022 was $81,328, which means an increase of 54.2% compared to 2000 when it was $37,222.
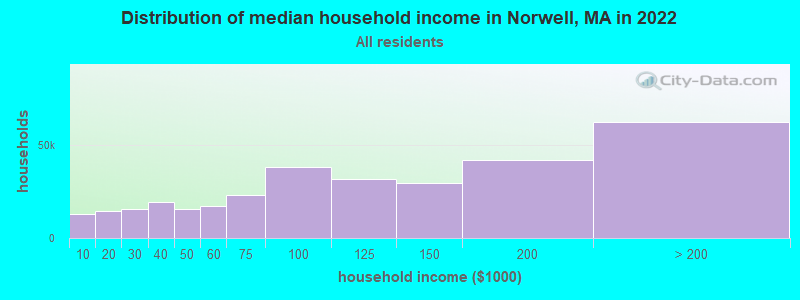
Income statistics for all residents
Median household income in Norwell, MA in 2022:| Norwell: | $162,133 |
| State: | $94,488 |
Change in median household income between 2000 and 2022:| Norwell, Massachusetts: | +85.5% |
| State: | +87.1% |
Number of households with income < $10k:| Norwell: | 4.0% (12,985) |
| Massachusetts: | 5.2% (146,170) |
Number of households with income $10k - 20k:| Norwell: | 4.5% (14,597) |
| Massachusetts: | 6.4% (180,001) |
Number of households with income $20k - 30k:| Norwell: | 4.9% (15,752) |
| Massachusetts: | 5.6% (156,667) |
Number of households with income $30k - 40k:| Norwell: | 6.0% (19,358) |
| State: | 5.6% (157,168) |
Number of households with income $40k - 50k:| Norwell: | 4.8% (15,360) |
| Massachusetts: | 5.4% (151,455) |
Number of households with income $50k - 60k:| Norwell: | 5.4% (17,401) |
| State: | 5.1% (142,726) |
Number of households with income $60k - 75k:| Norwell: | 7.1% (22,958) |
| Massachusetts: | 7.6% (212,203) |
Number of households with income $75k - 100k:| Norwell: | 11.8% (38,209) |
| Massachusetts: | 11.3% (317,064) |
Number of households with income $100k - 125k:| Norwell: | 9.9% (31,913) |
| Massachusetts: | 9.7% (270,603) |
Number of households with income $125k - 150k:| Norwell: | 9.2% (29,610) |
| State: | 8.0% (223,140) |
Number of households with income $150k - 200k:| Norwell: | 13.1% (42,089) |
| Massachusetts: | 11.0% (308,695) |
Number of households with income > $200k:| Norwell: | 19.3% (62,261) |
| State: | 19.0% (531,884) |
Aggregate household income in Norwell in 2022: $4,838,566,359
Median family income in Norwell in 2022:| Norwell: | $184,292 |
| Massachusetts: | $120,263 |
Median non-family income in Norwell in 2022:| Norwell: | $55,990 |
| State: | $55,979 |
Change in median non-family income between 2000 and 2022:| Norwell, Massachusetts: | +86.5% |
| Massachusetts: | +88.0% |
Median per capita income in Norwell in 2022:| Norwell: | $81,329 |
| Massachusetts: | $54,025 |
Change in median per capita income between 2000 and 2022:| Norwell, Massachusetts: | +118.5% |
| State: | +108.2% |
Income statistics for White residents
Median household income in Norwell, MA in 2022:| Norwell: | $162,624 |
| Massachusetts: | $101,391 |
Change in median household income between 2000 and 2022:| Norwell, Massachusetts: | +87.1% |
| State: | +93.3% |
Number of households with income < $10k:| Norwell: | 3.7% (9,342) |
| State: | 4.4% (91,120) |
Number of households with income $10k - 20k:| Norwell: | 4.0% (10,038) |
| Massachusetts: | 5.9% (122,055) |
Number of households with income $20k - 30k:| Norwell: | 4.7% (11,790) |
| State: | 5.1% (105,311) |
Number of households with income $30k - 40k:| Norwell: | 5.9% (14,760) |
| State: | 5.3% (110,239) |
Number of households with income $40k - 50k:| Norwell: | 4.6% (11,477) |
| State: | 5.0% (104,636) |
Number of households with income $50k - 60k:| Norwell: | 5.0% (12,670) |
| Massachusetts: | 4.8% (99,486) |
Number of households with income $60k - 75k:| Norwell: | 6.7% (16,854) |
| State: | 7.5% (155,124) |
Number of households with income $75k - 100k:| Norwell: | 11.6% (29,171) |
| Massachusetts: | 11.4% (236,252) |
Number of households with income $100k - 125k:| Norwell: | 10.8% (27,246) |
| State: | 9.9% (204,731) |
Number of households with income $125k - 150k:| Norwell: | 9.3% (23,455) |
| State: | 8.5% (175,324) |
Number of households with income $150k - 200k:| Norwell: | 13.0% (32,812) |
| Massachusetts: | 11.7% (242,980) |
Number of households with income > $200k:| Norwell: | 20.8% (52,314) |
| State: | 20.5% (425,966) |
Aggregate household income in Norwell in 2022: $3,993,351,957
Median family income in Norwell in 2022:| Norwell: | $189,568 |
| State: | $133,153 |
Number of families with income < $10k:| Norwell: | 0.3% (15) |
| Massachusetts: | 2.0% (25,038) |
Number of families with income $10k - 20k:| Norwell: | 0.8% (40) |
| State: | 2.1% (26,403) |
Number of families with income $20k - 30k:| Norwell: | 0.3% (16) |
| Massachusetts: | 2.6% (32,525) |
Number of families with income $30k - 40k:| Norwell: | 1.2% (60) |
| State: | 3.9% (48,079) |
Number of families with income $40k - 50k:| Norwell: | 2.0% (100) |
| State: | 3.8% (46,908) |
Number of families with income $50k - 60k:| Norwell: | 1.4% (72) |
| Massachusetts: | 3.8% (46,476) |
Number of families with income $60k - 75k:| Norwell: | 2.1% (108) |
| Massachusetts: | 6.4% (79,040) |
Number of families with income $75k - 100k:| Norwell: | 5.7% (288) |
| State: | 11.1% (137,395) |
Number of families with income $100k - 125k:| Norwell: | 9.0% (461) |
| Massachusetts: | 11.1% (136,771) |
Number of families with income $125k - 150k:| Norwell: | 10.9% (555) |
| State: | 10.0% (123,709) |
Number of families with income $150k - 200k:| Norwell: | 19.5% (996) |
| State: | 14.7% (181,602) |
Number of families with income > $200k:| Norwell: | 46.8% (2,388) |
| State: | 28.5% (351,887) |
Median non-family income in Norwell in 2022:| Norwell: | $56,224 |
| Massachusetts: | $59,323 |
Change in median non-family income between 2000 and 2022:| Norwell, Massachusetts: | +86.1% |
| State: | +94.3% |
Median per capita income in Norwell in 2022:| Norwell: | $84,866 |
| State: | $60,804 |
Change in median per capita income between 2000 and 2022:| Norwell, Massachusetts: | +127.4% |
| State: | +118.7% |
Income statistics for Black or African American residents
Median household income in Norwell, MA in 2022:| Norwell: | $26,842 |
| Massachusetts: | $63,189 |
Change in median household income between 2000 and 2022:| Norwell, Massachusetts: | +121.0% |
| State: | +87.4% |
Number of households with income < $10k:| Norwell: | 6.1% (289) |
| State: | 9.1% (15,797) |
Number of households with income $10k - 20k:| Norwell: | 7.5% (356) |
| Massachusetts: | 9.4% (16,267) |
Number of households with income $20k - 30k:| Norwell: | 4.0% (188) |
| State: | 7.8% (13,520) |
Number of households with income $30k - 40k:| Norwell: | 5.9% (283) |
| State: | 8.3% (14,412) |
Number of households with income $40k - 50k:| Norwell: | 5.0% (239) |
| State: | 7.9% (13,790) |
Number of households with income $50k - 60k:| Norwell: | 6.1% (289) |
| State: | 5.8% (10,041) |
Number of households with income $60k - 75k:| Norwell: | 10.2% (485) |
| State: | 8.5% (14,822) |
Number of households with income $75k - 100k:| Norwell: | 14.1% (671) |
| State: | 11.0% (19,122) |
Number of households with income $100k - 125k:| Norwell: | 5.5% (260) |
| State: | 8.4% (14,575) |
Number of households with income $125k - 150k:| Norwell: | 8.2% (391) |
| State: | 6.0% (10,429) |
Number of households with income $150k - 200k:| Norwell: | 13.5% (641) |
| Massachusetts: | 7.2% (12,539) |
Number of households with income > $200k:| Norwell: | 14.0% (665) |
| State: | 10.5% (18,185) |
Aggregate household income in Norwell in 2022: $1,593,950
Median family income in Norwell in 2022:| Norwell: | $120,726 |
| State: | $79,815 |
Median non-family income in Norwell in 2022:| Norwell: | $23,318 |
| Massachusetts: | $38,934 |
Change in median non-family income between 2000 and 2022:| Norwell, Massachusetts: | +107.3% |
| State: | +69.2% |
Median per capita income in Norwell in 2022:| Norwell: | $39,308 |
| State: | $33,524 |
Change in median per capita income between 2000 and 2022:| Norwell, Massachusetts: | +127.3% |
| State: | +109.4% |
Income statistics for Asian residents
Median household income in Norwell, MA in 2022:| Norwell: | $250,753 |
| State: | $117,855 |
Change in median household income between 2000 and 2022:| Norwell, Massachusetts: | +57.9% |
| State: | +129.9% |
Number of households with income < $10k:| Norwell: | 6.8% (37,106) |
| State: | 6.8% (11,982) |
Number of households with income $10k - 20k:| Norwell: | 4.8% (25,938) |
| Massachusetts: | 4.8% (8,376) |
Number of households with income $20k - 30k:| Norwell: | 3.7% (20,309) |
| Massachusetts: | 3.7% (6,558) |
Number of households with income $30k - 40k:| Norwell: | 3.3% (17,801) |
| State: | 3.3% (5,748) |
Number of households with income $40k - 50k:| Norwell: | 4.1% (22,272) |
| State: | 4.1% (7,192) |
Number of households with income $50k - 60k:| Norwell: | 5.0% (27,047) |
| Massachusetts: | 5.0% (8,734) |
Number of households with income $60k - 75k:| Norwell: | 5.8% (31,596) |
| Massachusetts: | 5.8% (10,203) |
Number of households with income $75k - 100k:| Norwell: | 8.6% (46,929) |
| State: | 8.6% (15,154) |
Number of households with income $100k - 125k:| Norwell: | 10.8% (58,659) |
| State: | 10.8% (18,942) |
Number of households with income $125k - 150k:| Norwell: | 8.0% (43,469) |
| State: | 8.0% (14,037) |
Number of households with income $150k - 200k:| Norwell: | 12.5% (67,683) |
| State: | 12.5% (21,856) |
Number of households with income > $200k:| Norwell: | 26.6% (144,601) |
| State: | 26.6% (46,694) |
Aggregate household income in Norwell in 2022: $17,717,330
Median family income in Norwell in 2022:| Norwell: | $248,629 |
| State: | $140,113 |
Number of families with income $100k - 125k:| Norwell: | 8.6% (19) |
| State: | 10.0% (11,697) |
Number of families with income $150k - 200k:| Norwell: | 35.3% (76) |
| State: | 13.2% (15,478) |
Number of families with income > $200k:| Norwell: | 56.1% (121) |
| Massachusetts: | 34.0% (39,856) |
Median per capita income in Norwell in 2022:| Norwell: | $106,946 |
| State: | $58,900 |
Income statistics for Hispanic or Latino residents
Median household income in Norwell, MA in 2022:| Norwell: | $34,611 |
| State: | $61,523 |
Change in median household income between 2000 and 2022:| Norwell, Massachusetts: | +113.0% |
| State: | +125.4% |
Number of households with income < $10k:| Norwell: | 3.9% (125) |
| Massachusetts: | 8.8% (25,307) |
Number of households with income $10k - 20k:| Norwell: | 0.0% (0) |
| State: | 10.0% (28,653) |
Number of households with income $20k - 30k:| Norwell: | 9.2% (294) |
| State: | 8.8% (25,189) |
Number of households with income $30k - 40k:| Norwell: | 5.9% (188) |
| Massachusetts: | 7.2% (20,822) |
Number of households with income $40k - 50k:| Norwell: | 7.3% (234) |
| Massachusetts: | 7.2% (20,817) |
Number of households with income $50k - 60k:| Norwell: | 15.1% (484) |
| State: | 6.5% (18,748) |
Number of households with income $60k - 75k:| Norwell: | 9.0% (288) |
| Massachusetts: | 8.8% (25,390) |
Number of households with income $75k - 100k:| Norwell: | 13.1% (420) |
| State: | 12.0% (34,488) |
Number of households with income $100k - 125k:| Norwell: | 7.7% (245) |
| Massachusetts: | 8.6% (24,599) |
Number of households with income $125k - 150k:| Norwell: | 6.8% (219) |
| Massachusetts: | 6.2% (17,743) |
Number of households with income $150k - 200k:| Norwell: | 7.4% (238) |
| State: | 7.3% (21,017) |
Number of households with income > $200k:| Norwell: | 14.5% (464) |
| Massachusetts: | 8.6% (24,606) |
Aggregate household income in Norwell in 2022: $1,620,804
Median family income in Norwell in 2022:| Norwell: | $34,281 |
| State: | $66,072 |
Number of families with income < $10k:| Norwell: | 1.1% (5) |
| Massachusetts: | 6.2% (12,456) |
Number of families with income $10k - 20k:| Norwell: | 2.7% (12) |
| State: | 6.0% (12,071) |
Number of families with income $20k - 30k:| Norwell: | 2.5% (11) |
| Massachusetts: | 10.1% (20,376) |
Number of families with income $30k - 40k:| Norwell: | 4.1% (18) |
| State: | 8.2% (16,470) |
Number of families with income $40k - 50k:| Norwell: | 6.3% (28) |
| Massachusetts: | 7.4% (14,829) |
Number of families with income $50k - 60k:| Norwell: | 4.3% (19) |
| State: | 7.3% (14,643) |
Number of families with income $60k - 75k:| Norwell: | 7.5% (33) |
| State: | 10.6% (21,252) |
Number of families with income $75k - 100k:| Norwell: | 10.8% (47) |
| State: | 12.0% (24,088) |
Number of families with income $100k - 125k:| Norwell: | 11.7% (51) |
| State: | 8.9% (17,954) |
Number of families with income $125k - 150k:| Norwell: | 11.8% (52) |
| State: | 6.9% (13,837) |
Number of families with income $150k - 200k:| Norwell: | 14.4% (63) |
| Massachusetts: | 7.3% (14,683) |
Number of families with income > $200k:| Norwell: | 22.8% (100) |
| State: | 9.3% (18,741) |
Median per capita income in Norwell in 2022:| Norwell: | $64,231 |
| State: | $28,993 |
Income statistics for Multirace residents
Median household income in Norwell, MA in 2022:| Norwell: | $210,149 |
| Massachusetts: | $71,552 |
Change in median household income between 2000 and 2022:| Norwell, Massachusetts: | +105.5% |
| State: | +109.0% |
Number of households with income < $10k:| Norwell: | 1.1% (349) |
| State: | 6.6% (15,127) |
Number of households with income $10k - 20k:| Norwell: | 4.6% (1,493) |
| State: | 9.2% (21,158) |
Number of households with income $20k - 30k:| Norwell: | 6.1% (1,993) |
| State: | 7.8% (18,016) |
Number of households with income $30k - 40k:| Norwell: | 8.7% (2,815) |
| State: | 7.9% (18,260) |
Number of households with income $40k - 50k:| Norwell: | 5.1% (1,644) |
| State: | 5.6% (13,027) |
Number of households with income $50k - 60k:| Norwell: | 3.7% (1,192) |
| Massachusetts: | 5.6% (12,909) |
Number of households with income $60k - 75k:| Norwell: | 10.9% (3,552) |
| State: | 9.0% (20,800) |
Number of households with income $75k - 100k:| Norwell: | 14.8% (4,800) |
| State: | 12.1% (27,875) |
Number of households with income $100k - 125k:| Norwell: | 6.2% (2,013) |
| State: | 8.1% (18,754) |
Number of households with income $125k - 150k:| Norwell: | 11.8% (3,837) |
| Massachusetts: | 6.8% (15,621) |
Number of households with income $150k - 200k:| Norwell: | 17.2% (5,580) |
| State: | 9.4% (21,618) |
Number of households with income > $200k:| Norwell: | 9.9% (3,200) |
| State: | 12.0% (27,592) |
Aggregate household income in Norwell in 2022: $6,448,897
Median family income in Norwell in 2022:| Norwell: | $195,818 |
| Massachusetts: | $78,380 |
Number of families with income $100k - 125k:| Norwell: | 100.0% (36) |
| State: | 7.9% (12,321) |
Median per capita income in Norwell in 2022:| Norwell: | $48,200 |
| State: | $34,029 |
Change in median per capita income between 2000 and 2022:| Norwell, Massachusetts: | +132.9% |
| Massachusetts: | +132.1% |
Income statistics for other residents
Number of households with income < $10k:| Norwell: | 8.4% (57,389) |
| State: | 8.4% (11,559) |
Number of households with income $10k - 20k:| Norwell: | 8.4% (57,091) |
| Massachusetts: | 8.4% (11,499) |
Number of households with income $20k - 30k:| Norwell: | 9.5% (64,891) |
| State: | 9.5% (13,070) |
Number of households with income $30k - 40k:| Norwell: | 6.0% (41,163) |
| Massachusetts: | 6.0% (8,291) |
Number of households with income $40k - 50k:| Norwell: | 9.2% (62,612) |
| Massachusetts: | 9.2% (12,611) |
Number of households with income $50k - 60k:| Norwell: | 7.9% (54,013) |
| State: | 7.9% (10,879) |
Number of households with income $60k - 75k:| Norwell: | 7.5% (50,835) |
| State: | 7.5% (10,239) |
Number of households with income $75k - 100k:| Norwell: | 13.1% (89,527) |
| State: | 13.1% (18,032) |
Number of households with income $100k - 125k:| Norwell: | 9.6% (65,243) |
| Massachusetts: | 9.6% (13,141) |
Number of households with income $125k - 150k:| Norwell: | 5.0% (33,801) |
| State: | 5.0% (6,808) |
Number of households with income $150k - 200k:| Norwell: | 6.4% (43,904) |
| State: | 6.4% (8,843) |
Number of households with income > $200k:| Norwell: | 9.0% (61,545) |
| Massachusetts: | 9.0% (12,396) |
Median per capita income in Norwell in 2022:| Norwell: | $188,043 |
| State: | $30,797 |