Northbridge, Massachusetts (MA) income map, earnings map, and wages data
The median household income in Northbridge, MA in 2022 was $90,911, which was 3.9% less than the median annual income of $94,488 across the entire state of Massachusetts. Compared to the median income of $50,457 in 2000 this represents an increase of 44.5%. The per capita income in 2022 was $43,899, which means an increase of 48.7% compared to 2000 when it was $22,515.
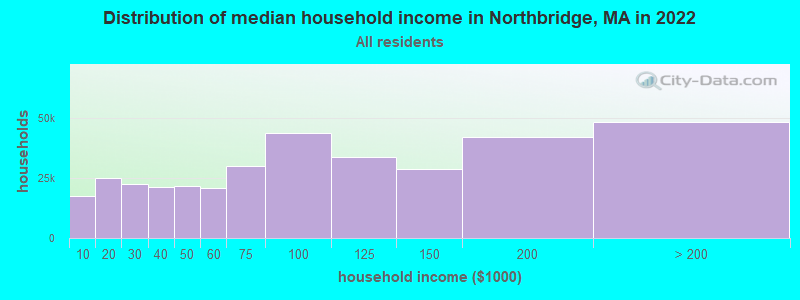
Income statistics for all residents
Median household income in Northbridge, MA in 2022:| Northbridge: | $90,912 |
| State: | $94,488 |
Change in median household income between 2000 and 2022:| Northbridge, Massachusetts: | +80.2% |
| State: | +87.1% |
Number of households with income < $10k:| Northbridge: | 4.9% (17,488) |
| Massachusetts: | 5.2% (146,170) |
Number of households with income $10k - 20k:| Northbridge: | 7.0% (24,951) |
| State: | 6.4% (180,001) |
Number of households with income $20k - 30k:| Northbridge: | 6.4% (22,724) |
| State: | 5.6% (156,667) |
Number of households with income $30k - 40k:| Northbridge: | 5.9% (21,151) |
| Massachusetts: | 5.6% (157,168) |
Number of households with income $40k - 50k:| Northbridge: | 6.1% (21,659) |
| Massachusetts: | 5.4% (151,455) |
Number of households with income $50k - 60k:| Northbridge: | 5.8% (20,738) |
| State: | 5.1% (142,726) |
Number of households with income $60k - 75k:| Northbridge: | 8.4% (30,094) |
| Massachusetts: | 7.6% (212,203) |
Number of households with income $75k - 100k:| Northbridge: | 12.3% (43,770) |
| Massachusetts: | 11.3% (317,064) |
Number of households with income $100k - 125k:| Northbridge: | 9.5% (33,974) |
| Massachusetts: | 9.7% (270,603) |
Number of households with income $125k - 150k:| Northbridge: | 8.1% (29,031) |
| State: | 8.0% (223,140) |
Number of households with income $150k - 200k:| Northbridge: | 11.9% (42,283) |
| Massachusetts: | 11.0% (308,695) |
Number of households with income > $200k:| Northbridge: | 13.6% (48,466) |
| Massachusetts: | 19.0% (531,884) |
Aggregate household income in Northbridge in 2022: $5,202,121,066
Median family income in Northbridge in 2022:| Northbridge: | $114,256 |
| State: | $120,263 |
Median non-family income in Northbridge in 2022:| Northbridge: | $42,673 |
| State: | $55,979 |
Change in median non-family income between 2000 and 2022:| Northbridge, Massachusetts: | +85.7% |
| State: | +88.0% |
Median per capita income in Northbridge in 2022:| Northbridge: | $43,899 |
| State: | $54,025 |
Change in median per capita income between 2000 and 2022:| Northbridge, Massachusetts: | +95.0% |
| State: | +108.2% |
Income statistics for White residents
Median household income in Northbridge, MA in 2022:| Northbridge: | $92,817 |
| State: | $101,391 |
Change in median household income between 2000 and 2022:| Northbridge, Massachusetts: | +85.1% |
| State: | +93.3% |
Number of households with income < $10k:| Northbridge: | 4.6% (12,397) |
| State: | 4.4% (91,120) |
Number of households with income $10k - 20k:| Northbridge: | 6.5% (17,727) |
| Massachusetts: | 5.9% (122,055) |
Number of households with income $20k - 30k:| Northbridge: | 6.1% (16,438) |
| State: | 5.1% (105,311) |
Number of households with income $30k - 40k:| Northbridge: | 5.5% (14,832) |
| Massachusetts: | 5.3% (110,239) |
Number of households with income $40k - 50k:| Northbridge: | 5.6% (15,187) |
| State: | 5.0% (104,636) |
Number of households with income $50k - 60k:| Northbridge: | 5.4% (14,726) |
| State: | 4.8% (99,486) |
Number of households with income $60k - 75k:| Northbridge: | 8.4% (22,805) |
| State: | 7.5% (155,124) |
Number of households with income $75k - 100k:| Northbridge: | 12.2% (33,142) |
| State: | 11.4% (236,252) |
Number of households with income $100k - 125k:| Northbridge: | 10.1% (27,541) |
| State: | 9.9% (204,731) |
Number of households with income $125k - 150k:| Northbridge: | 8.4% (22,713) |
| Massachusetts: | 8.5% (175,324) |
Number of households with income $150k - 200k:| Northbridge: | 12.5% (33,837) |
| State: | 11.7% (242,980) |
Number of households with income > $200k:| Northbridge: | 14.7% (40,022) |
| State: | 20.5% (425,966) |
Aggregate household income in Northbridge in 2022: $4,165,620,861
Median family income in Northbridge in 2022:| Northbridge: | $119,677 |
| State: | $133,153 |
Number of families with income < $10k:| Northbridge: | 1.5% (45) |
| Massachusetts: | 2.0% (25,038) |
Number of families with income $10k - 20k:| Northbridge: | 1.9% (60) |
| Massachusetts: | 2.1% (26,403) |
Number of families with income $20k - 30k:| Northbridge: | 4.2% (128) |
| State: | 2.6% (32,525) |
Number of families with income $30k - 40k:| Northbridge: | 4.7% (144) |
| State: | 3.9% (48,079) |
Number of families with income $40k - 50k:| Northbridge: | 4.7% (146) |
| Massachusetts: | 3.8% (46,908) |
Number of families with income $50k - 60k:| Northbridge: | 4.4% (136) |
| Massachusetts: | 3.8% (46,476) |
Number of families with income $60k - 75k:| Northbridge: | 9.3% (287) |
| State: | 6.4% (79,040) |
Number of families with income $75k - 100k:| Northbridge: | 14.1% (433) |
| State: | 11.1% (137,395) |
Number of families with income $100k - 125k:| Northbridge: | 10.8% (333) |
| State: | 11.1% (136,771) |
Number of families with income $125k - 150k:| Northbridge: | 12.9% (397) |
| State: | 10.0% (123,709) |
Number of families with income $150k - 200k:| Northbridge: | 13.6% (419) |
| State: | 14.7% (181,602) |
Number of families with income > $200k:| Northbridge: | 17.8% (547) |
| Massachusetts: | 28.5% (351,887) |
Median non-family income in Northbridge in 2022:| Northbridge: | $44,308 |
| State: | $59,323 |
Change in median non-family income between 2000 and 2022:| Northbridge, Massachusetts: | +92.0% |
| Massachusetts: | +94.3% |
Median per capita income in Northbridge in 2022:| Northbridge: | $46,701 |
| State: | $60,804 |
Change in median per capita income between 2000 and 2022:| Northbridge, Massachusetts: | +105.3% |
| Massachusetts: | +118.7% |
Income statistics for Black or African American residents
Median household income in Northbridge, MA in 2022:| Northbridge: | $90,357 |
| Massachusetts: | $63,189 |
Change in median household income between 2000 and 2022:| Northbridge, Massachusetts: | +69.8% |
| Massachusetts: | +87.4% |
Number of households with income < $10k:| Northbridge: | 7.3% (1,714) |
| Massachusetts: | 9.1% (15,797) |
Number of households with income $10k - 20k:| Northbridge: | 11.9% (2,800) |
| State: | 9.4% (16,267) |
Number of households with income $20k - 30k:| Northbridge: | 9.8% (2,307) |
| State: | 7.8% (13,520) |
Number of households with income $30k - 40k:| Northbridge: | 3.3% (766) |
| Massachusetts: | 8.3% (14,412) |
Number of households with income $40k - 50k:| Northbridge: | 13.5% (3,174) |
| Massachusetts: | 7.9% (13,790) |
Number of households with income $50k - 60k:| Northbridge: | 5.8% (1,357) |
| State: | 5.8% (10,041) |
Number of households with income $60k - 75k:| Northbridge: | 10.7% (2,524) |
| Massachusetts: | 8.5% (14,822) |
Number of households with income $75k - 100k:| Northbridge: | 13.0% (3,065) |
| State: | 11.0% (19,122) |
Number of households with income $100k - 125k:| Northbridge: | 7.5% (1,769) |
| State: | 8.4% (14,575) |
Number of households with income $125k - 150k:| Northbridge: | 5.0% (1,169) |
| State: | 6.0% (10,429) |
Number of households with income $150k - 200k:| Northbridge: | 7.3% (1,705) |
| State: | 7.2% (12,539) |
Number of households with income > $200k:| Northbridge: | 4.9% (1,161) |
| State: | 10.5% (18,185) |
Aggregate household income in Northbridge in 2022: $5,202,931
Median family income in Northbridge in 2022:| Northbridge: | $87,310 |
| State: | $79,815 |
Number of families with income $20k - 30k:| Northbridge: | 24.1% (11) |
| State: | 6.6% (7,274) |
Number of families with income $50k - 60k:| Northbridge: | 14.7% (7) |
| State: | 6.4% (6,986) |
Number of families with income $60k - 75k:| Northbridge: | 61.3% (28) |
| State: | 7.9% (8,699) |
Median per capita income in Northbridge in 2022:| Northbridge: | $20,322 |
| State: | $33,524 |
Change in median per capita income between 2000 and 2022:| Northbridge, Massachusetts: | +95.7% |
| State: | +109.4% |
Income statistics for Asian residents
Number of households with income < $10k:| Northbridge: | 5.7% (1,256) |
| State: | 6.8% (11,982) |
Number of households with income $10k - 20k:| Northbridge: | 5.8% (1,262) |
| Massachusetts: | 4.8% (8,376) |
Number of households with income $20k - 30k:| Northbridge: | 1.9% (417) |
| State: | 3.7% (6,558) |
Number of households with income $30k - 40k:| Northbridge: | 3.5% (776) |
| Massachusetts: | 3.3% (5,748) |
Number of households with income $40k - 50k:| Northbridge: | 4.9% (1,079) |
| State: | 4.1% (7,192) |
Number of households with income $50k - 60k:| Northbridge: | 3.5% (767) |
| State: | 5.0% (8,734) |
Number of households with income $60k - 75k:| Northbridge: | 4.3% (951) |
| State: | 5.8% (10,203) |
Number of households with income $75k - 100k:| Northbridge: | 6.1% (1,335) |
| Massachusetts: | 8.6% (15,154) |
Number of households with income $100k - 125k:| Northbridge: | 9.7% (2,135) |
| Massachusetts: | 10.8% (18,942) |
Number of households with income $125k - 150k:| Northbridge: | 8.1% (1,769) |
| State: | 8.0% (14,037) |
Number of households with income $150k - 200k:| Northbridge: | 21.1% (4,621) |
| State: | 12.5% (21,856) |
Number of households with income > $200k:| Northbridge: | 25.4% (5,561) |
| Massachusetts: | 26.6% (46,694) |
Median per capita income in Northbridge in 2022:| Northbridge: | $80,364 |
| State: | $58,900 |
Income statistics for Hispanic or Latino residents
Median household income in Northbridge, MA in 2022:| Northbridge: | $95,414 |
| State: | $61,523 |
Change in median household income between 2000 and 2022:| Northbridge, Massachusetts: | +116.0% |
| State: | +125.4% |
Number of households with income < $10k:| Northbridge: | 8.1% (4,883) |
| Massachusetts: | 8.8% (25,307) |
Number of households with income $10k - 20k:| Northbridge: | 10.5% (6,280) |
| Massachusetts: | 10.0% (28,653) |
Number of households with income $20k - 30k:| Northbridge: | 10.3% (6,211) |
| State: | 8.8% (25,189) |
Number of households with income $30k - 40k:| Northbridge: | 9.5% (5,713) |
| State: | 7.2% (20,822) |
Number of households with income $40k - 50k:| Northbridge: | 7.1% (4,273) |
| State: | 7.2% (20,817) |
Number of households with income $50k - 60k:| Northbridge: | 8.0% (4,798) |
| State: | 6.5% (18,748) |
Number of households with income $60k - 75k:| Northbridge: | 11.1% (6,649) |
| State: | 8.8% (25,390) |
Number of households with income $75k - 100k:| Northbridge: | 14.1% (8,460) |
| State: | 12.0% (34,488) |
Number of households with income $100k - 125k:| Northbridge: | 5.7% (3,415) |
| Massachusetts: | 8.6% (24,599) |
Number of households with income $125k - 150k:| Northbridge: | 8.8% (5,304) |
| State: | 6.2% (17,743) |
Number of households with income $150k - 200k:| Northbridge: | 3.6% (2,133) |
| State: | 7.3% (21,017) |
Number of households with income > $200k:| Northbridge: | 3.2% (1,912) |
| State: | 8.6% (24,606) |
Aggregate household income in Northbridge in 2022: $19,701,520
Median family income in Northbridge in 2022:| Northbridge: | $97,544 |
| State: | $66,072 |
Number of families with income < $10k:| Northbridge: | 6.1% (29) |
| Massachusetts: | 6.2% (12,456) |
Number of families with income $10k - 20k:| Northbridge: | 3.4% (16) |
| Massachusetts: | 6.0% (12,071) |
Number of families with income $20k - 30k:| Northbridge: | 12.2% (58) |
| Massachusetts: | 10.1% (20,376) |
Number of families with income $30k - 40k:| Northbridge: | 9.2% (43) |
| State: | 8.2% (16,470) |
Number of families with income $40k - 50k:| Northbridge: | 12.0% (57) |
| Massachusetts: | 7.4% (14,829) |
Number of families with income $50k - 60k:| Northbridge: | 9.8% (46) |
| Massachusetts: | 7.3% (14,643) |
Number of families with income $60k - 75k:| Northbridge: | 10.5% (50) |
| State: | 10.6% (21,252) |
Number of families with income $75k - 100k:| Northbridge: | 13.6% (64) |
| State: | 12.0% (24,088) |
Number of families with income $100k - 125k:| Northbridge: | 4.5% (21) |
| State: | 8.9% (17,954) |
Number of families with income $125k - 150k:| Northbridge: | 12.5% (59) |
| State: | 6.9% (13,837) |
Number of families with income $150k - 200k:| Northbridge: | 2.8% (13) |
| Massachusetts: | 7.3% (14,683) |
Number of families with income > $200k:| Northbridge: | 3.3% (16) |
| State: | 9.3% (18,741) |
Median non-family income in Northbridge in 2022:| Northbridge: | $35,296 |
| Massachusetts: | $37,563 |
Change in median non-family income between 2000 and 2022:| Northbridge, Massachusetts: | +95.9% |
| State: | +115.0% |
Median per capita income in Northbridge in 2022:| Northbridge: | $28,117 |
| Massachusetts: | $28,993 |
Change in median per capita income between 2000 and 2022:| Northbridge, Massachusetts: | +110.9% |
| Massachusetts: | +142.4% |
Income statistics for American Indian and Alaska Native residents
Median household income in Northbridge, MA in 2022:| Northbridge: | $294,832 |
| Massachusetts: | $87,730 |
Number of households with income < $10k:| Northbridge: | 6.6% (1,106) |
| State: | 6.6% (451) |
Number of households with income $10k - 20k:| Northbridge: | 7.0% (1,167) |
| State: | 7.0% (476) |
Number of households with income $20k - 30k:| Northbridge: | 2.8% (470) |
| State: | 2.8% (192) |
Number of households with income $30k - 40k:| Northbridge: | 3.2% (534) |
| State: | 3.2% (218) |
Number of households with income $40k - 50k:| Northbridge: | 2.9% (488) |
| State: | 2.9% (199) |
Number of households with income $50k - 60k:| Northbridge: | 9.9% (1,660) |
| State: | 9.9% (677) |
Number of households with income $60k - 75k:| Northbridge: | 11.5% (1,915) |
| State: | 11.5% (781) |
Number of households with income $75k - 100k:| Northbridge: | 9.2% (1,542) |
| State: | 9.2% (629) |
Number of households with income $100k - 125k:| Northbridge: | 6.0% (995) |
| State: | 6.0% (406) |
Number of households with income $125k - 150k:| Northbridge: | 13.5% (2,258) |
| Massachusetts: | 13.5% (921) |
Number of households with income $150k - 200k:| Northbridge: | 12.6% (2,106) |
| Massachusetts: | 12.6% (859) |
Number of households with income > $200k:| Northbridge: | 14.7% (2,459) |
| State: | 14.7% (1,003) |
Aggregate household income in Northbridge in 2022: $4,140,748
Median family income in Northbridge in 2022:| Northbridge: | $274,066 |
| Massachusetts: | $105,715 |
Number of families with income $50k - 60k:| Northbridge: | 26.1% (8) |
| State: | 6.4% (204) |
Number of families with income $75k - 100k:| Northbridge: | 73.9% (24) |
| Massachusetts: | 9.3% (297) |
Median per capita income in Northbridge in 2022:| Northbridge: | $51,898 |
| Massachusetts: | $39,434 |
Change in median per capita income between 2000 and 2022:| Northbridge, Massachusetts: | +80.0% |
| State: | +148.2% |
Income statistics for Multirace residents
Median household income in Northbridge, MA in 2022:| Northbridge: | $113,143 |
| State: | $71,552 |
Change in median household income between 2000 and 2022:| Northbridge, Massachusetts: | +84.7% |
| State: | +109.0% |
Number of households with income < $10k:| Northbridge: | 7.4% (4,213) |
| Massachusetts: | 6.6% (15,127) |
Number of households with income $10k - 20k:| Northbridge: | 10.3% (5,856) |
| Massachusetts: | 9.2% (21,158) |
Number of households with income $20k - 30k:| Northbridge: | 10.2% (5,788) |
| State: | 7.8% (18,016) |
Number of households with income $30k - 40k:| Northbridge: | 11.3% (6,407) |
| State: | 7.9% (18,260) |
Number of households with income $40k - 50k:| Northbridge: | 6.2% (3,514) |
| Massachusetts: | 5.6% (13,027) |
Number of households with income $50k - 60k:| Northbridge: | 8.7% (4,948) |
| State: | 5.6% (12,909) |
Number of households with income $60k - 75k:| Northbridge: | 8.2% (4,628) |
| Massachusetts: | 9.0% (20,800) |
Number of households with income $75k - 100k:| Northbridge: | 13.5% (7,649) |
| Massachusetts: | 12.1% (27,875) |
Number of households with income $100k - 125k:| Northbridge: | 6.2% (3,499) |
| State: | 8.1% (18,754) |
Number of households with income $125k - 150k:| Northbridge: | 6.4% (3,641) |
| State: | 6.8% (15,621) |
Number of households with income $150k - 200k:| Northbridge: | 5.9% (3,360) |
| State: | 9.4% (21,618) |
Number of households with income > $200k:| Northbridge: | 5.6% (3,159) |
| State: | 12.0% (27,592) |
Aggregate household income in Northbridge in 2022: $33,645,369
Median family income in Northbridge in 2022:| Northbridge: | $128,596 |
| State: | $78,380 |
Number of families with income $20k - 30k:| Northbridge: | 1.9% (5) |
| State: | 8.5% (13,245) |
Number of families with income $30k - 40k:| Northbridge: | 14.7% (35) |
| State: | 8.2% (12,705) |
Number of families with income $60k - 75k:| Northbridge: | 26.9% (64) |
| State: | 10.3% (16,064) |
Number of families with income $75k - 100k:| Northbridge: | 34.1% (82) |
| State: | 12.1% (18,758) |
Number of families with income $100k - 125k:| Northbridge: | 22.3% (53) |
| Massachusetts: | 7.9% (12,321) |
Median non-family income in Northbridge in 2022:| Northbridge: | $40,567 |
| Massachusetts: | $42,253 |
Change in median non-family income between 2000 and 2022:| Northbridge, Massachusetts: | +60.0% |
| State: | +93.7% |
Median per capita income in Northbridge in 2022:| Northbridge: | $41,635 |
| State: | $34,029 |
Change in median per capita income between 2000 and 2022:| Northbridge, Massachusetts: | +104.0% |
| State: | +132.1% |
Income statistics for other residents
Number of households with income < $10k:| Northbridge: | 2.5% (4) |
| Massachusetts: | 8.4% (11,559) |
Number of households with income $10k - 20k:| Northbridge: | 6.2% (10) |
| State: | 8.4% (11,499) |
Number of households with income $20k - 30k:| Northbridge: | 6.2% (10) |
| State: | 9.5% (13,070) |
Number of households with income $30k - 40k:| Northbridge: | 10.6% (17) |
| State: | 6.0% (8,291) |
Number of households with income $40k - 50k:| Northbridge: | 9.3% (15) |
| State: | 9.2% (12,611) |
Number of households with income $50k - 60k:| Northbridge: | 8.7% (14) |
| State: | 7.9% (10,879) |
Number of households with income $60k - 75k:| Northbridge: | 11.2% (18) |
| State: | 7.5% (10,239) |
Number of households with income $75k - 100k:| Northbridge: | 18.6% (30) |
| State: | 13.1% (18,032) |
Number of households with income $100k - 125k:| Northbridge: | 6.2% (10) |
| State: | 9.6% (13,141) |
Number of households with income $125k - 150k:| Northbridge: | 8.1% (13) |
| State: | 5.0% (6,808) |
Number of households with income $150k - 200k:| Northbridge: | 8.1% (13) |
| State: | 6.4% (8,843) |
Number of households with income > $200k:| Northbridge: | 4.3% (7) |
| State: | 9.0% (12,396) |
Aggregate household income in Northbridge in 2022: $13,481,000
Median family income in Northbridge in 2022:| Northbridge: | $183,467 |
| Massachusetts: | $66,840 |
Number of families with income $20k - 30k:| Northbridge: | 7.1% (12) |
| State: | 10.4% (10,595) |
Number of families with income $40k - 50k:| Northbridge: | 5.2% (9) |
| State: | 8.9% (9,052) |
Number of families with income $60k - 75k:| Northbridge: | 16.6% (28) |
| State: | 8.5% (8,683) |
Number of families with income $75k - 100k:| Northbridge: | 36.2% (61) |
| State: | 12.8% (12,997) |
Number of families with income $100k - 125k:| Northbridge: | 34.9% (59) |
| Massachusetts: | 9.3% (9,480) |
Median non-family income in Northbridge in 2022:| Northbridge: | $74,359 |
| State: | $36,127 |
Median per capita income in Northbridge in 2022:| Northbridge: | $38,360 |
| State: | $30,797 |