The median household income in Northampton, MA in 2022 was $79,104, which was 19.4% less than the median annual income of $94,488 across the entire state of Massachusetts. Compared to the median income of $41,808 in 2000 this represents an increase of 47.1%. The per capita income in 2022 was $47,352, which means an increase of 49.3% compared to 2000 when it was $24,022.
Whole page based on the data from 2000 / 2022 when the population of Northampton, Massachusetts was 28,978 / 29,833
Income statistics for all residents
Median household income in Northampton, MA in 2022:
Northampton:
$79,105
Massachusetts:
$94,488
Change in median household income between 2000 and 2022:
Northampton, Massachusetts:
+89.2%
State:
+87.1%
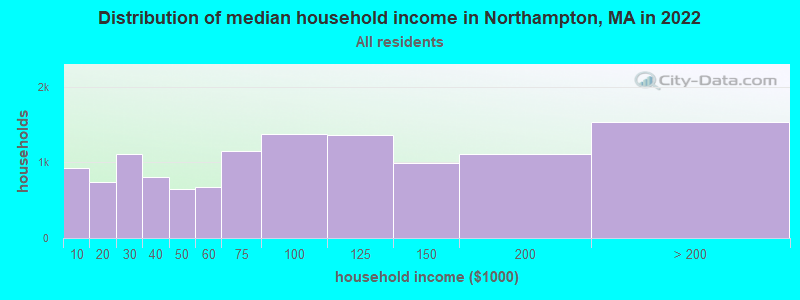
Number of households with income < $10k:
Northampton:
7.4% (923)
State:
5.2% (146,170)
Number of households with income $10k - 20k:
Northampton:
6.0% (745)
State:
6.4% (180,001)
Number of households with income $20k - 30k:
Northampton:
8.9% (1,108)
Massachusetts:
5.6% (156,667)
Number of households with income $30k - 40k:
Northampton:
6.4% (802)
State:
5.6% (157,168)
Number of households with income $40k - 50k:
Northampton:
5.3% (655)
State:
5.4% (151,455)
Number of households with income $50k - 60k:
Northampton:
5.5% (681)
State:
5.1% (142,726)
Number of households with income $60k - 75k:
Northampton:
9.2% (1,151)
Massachusetts:
7.6% (212,203)
Number of households with income $75k - 100k:
Northampton:
11.0% (1,372)
State:
11.3% (317,064)
Number of households with income $100k - 125k:
Northampton:
11.0% (1,366)
State:
9.7% (270,603)
Number of households with income $125k - 150k:
Northampton:
8.0% (997)
State:
8.0% (223,140)
Number of households with income $150k - 200k:
Northampton:
9.0% (1,118)
State:
11.0% (308,695)
Number of households with income > $200k:
Northampton:
12.3% (1,536)
Massachusetts:
19.0% (531,884)
Aggregate household income in Northampton in 2022: $1,371,885,542
Median family income in Northampton in 2022:
Northampton:
$123,182
Massachusetts:
$120,263
Number of families with income < $10k:
Northampton:
0.5% (33)
Massachusetts:
2.9% (49,671)
Number of families with income $10k - 20k:
Northampton:
3.4% (210)
State:
2.9% (50,542)
Number of families with income $20k - 30k:
Northampton:
4.7% (291)
Massachusetts:
3.9% (66,398)
Number of families with income $30k - 40k:
Northampton:
6.7% (413)
State:
4.5% (78,234)
Number of families with income $40k - 50k:
Northampton:
3.1% (193)
Massachusetts:
4.5% (77,656)
Number of families with income $50k - 60k:
Northampton:
4.3% (267)
Massachusetts:
4.5% (77,928)
Number of families with income $60k - 75k:
Northampton:
4.7% (288)
Massachusetts:
7.0% (120,295)
Number of families with income $75k - 100k:
Northampton:
11.1% (688)
State:
11.1% (192,172)
Number of families with income $100k - 125k:
Northampton:
14.0% (863)
Massachusetts:
10.6% (182,105)
Number of families with income $125k - 150k:
Northampton:
12.4% (767)
State:
9.3% (159,566)
Number of families with income $150k - 200k:
Northampton:
13.9% (860)
Massachusetts:
13.4% (231,410)
Number of families with income > $200k:
Northampton:
21.2% (1,311)
State:
25.4% (438,378)
Median non-family income in Northampton in 2022:
Northampton:
$46,174
State:
$55,979
Change in median non-family income between 2000 and 2022:
Northampton, Massachusetts:
+54.9%
State:
+88.0%
Median per capita income in Northampton in 2022:
Northampton:
$47,352
Massachusetts:
$54,025
Change in median per capita income between 2000 and 2022:
Northampton, Massachusetts:
+97.1%
State:
+108.2%
Income statistics for White residents
Median household income in Northampton, MA in 2022:
Northampton:
$84,614
Massachusetts:
$101,391
Change in median household income between 2000 and 2022:
Northampton, Massachusetts:
+100.5%
State:
+93.3%
Number of households with income < $10k:
Northampton:
5.0% (528)
State:
4.4% (91,120)
Number of households with income $10k - 20k:
Northampton:
5.3% (565)
Massachusetts:
5.9% (122,055)
Number of households with income $20k - 30k:
Northampton:
7.7% (819)
State:
5.1% (105,311)
Number of households with income $30k - 40k:
Northampton:
7.2% (764)
State:
5.3% (110,239)
Number of households with income $40k - 50k:
Northampton:
5.4% (571)
Massachusetts:
5.0% (104,636)
Number of households with income $50k - 60k:
Northampton:
5.3% (563)
State:
4.8% (99,486)
Number of households with income $60k - 75k:
Northampton:
10.1% (1,067)
Massachusetts:
7.5% (155,124)
Number of households with income $75k - 100k:
Northampton:
11.2% (1,184)
State:
11.4% (236,252)
Number of households with income $100k - 125k:
Northampton:
11.3% (1,200)
State:
9.9% (204,731)
Number of households with income $125k - 150k:
Northampton:
8.9% (942)
Massachusetts:
8.5% (175,324)
Number of households with income $150k - 200k:
Northampton:
8.9% (946)
Massachusetts:
11.7% (242,980)
Number of households with income > $200k:
Northampton:
13.5% (1,424)
State:
20.5% (425,966)
Aggregate household income in Northampton in 2022: $1,238,087,891
Median family income in Northampton in 2022:
Northampton:
$125,046
Massachusetts:
$133,153
Number of families with income < $10k:
Northampton:
0.7% (38)
State:
2.0% (25,038)
Number of families with income $10k - 20k:
Northampton:
3.1% (168)
State:
2.1% (26,403)
Number of families with income $20k - 30k:
Northampton:
3.8% (209)
State:
2.6% (32,525)
Number of families with income $30k - 40k:
Northampton:
4.8% (263)
Massachusetts:
3.9% (48,079)
Number of families with income $40k - 50k:
Northampton:
2.3% (124)
State:
3.8% (46,908)
Number of families with income $50k - 60k:
Northampton:
4.0% (216)
State:
3.8% (46,476)
Number of families with income $60k - 75k:
Northampton:
5.0% (271)
State:
6.4% (79,040)
Number of families with income $75k - 100k:
Northampton:
11.2% (606)
Massachusetts:
11.1% (137,395)
Number of families with income $100k - 125k:
Northampton:
14.1% (769)
State:
11.1% (136,771)
Number of families with income $125k - 150k:
Northampton:
13.8% (750)
State:
10.0% (123,709)
Number of families with income $150k - 200k:
Northampton:
13.9% (756)
Massachusetts:
14.7% (181,602)
Number of families with income > $200k:
Northampton:
23.2% (1,262)
State:
28.5% (351,887)
Median non-family income in Northampton in 2022:
Northampton:
$53,708
State:
$59,323
Change in median non-family income between 2000 and 2022:
Northampton, Massachusetts:
+82.7%
State:
+94.3%
Median per capita income in Northampton in 2022:
Northampton:
$50,558
State:
$60,804
Change in median per capita income between 2000 and 2022:
Northampton, Massachusetts:
+103.3%
State:
+118.7%
Income statistics for Black or African American residents
Number of households with income < $10k:
Northampton:
57.9% (103)
State:
9.1% (15,797)
Number of households with income $10k - 20k:
Northampton:
6.7% (12)
State:
9.4% (16,267)
Number of households with income $20k - 30k:
Northampton:
0.0% (0)
State:
7.8% (13,520)
Number of households with income $30k - 40k:
Northampton:
0.0% (0)
Massachusetts:
8.3% (14,412)
Number of households with income $40k - 50k:
Northampton:
0.0% (0)
State:
7.9% (13,790)
Number of households with income $50k - 60k:
Northampton:
0.0% (0)
State:
5.8% (10,041)
Number of households with income $60k - 75k:
Northampton:
0.0% (0)
Massachusetts:
8.5% (14,822)
Number of households with income $75k - 100k:
Northampton:
0.0% (0)
State:
11.0% (19,122)
Number of households with income $100k - 125k:
Northampton:
13.5% (24)
State:
8.4% (14,575)
Number of households with income $125k - 150k:
Northampton:
6.2% (11)
State:
6.0% (10,429)
Number of households with income $150k - 200k:
Northampton:
15.7% (28)
State:
7.2% (12,539)
Number of households with income > $200k:
Northampton:
0.0% (0)
State:
10.5% (18,185)
Aggregate household income in Northampton in 2022: $19,390,978
Median family income in Northampton in 2022:
Northampton:
$226,148
State:
$79,815
Number of families with income $100k - 125k:
Northampton:
46.2% (24)
Massachusetts:
10.4% (11,452)
Number of families with income $150k - 200k:
Northampton:
53.8% (28)
Massachusetts:
9.3% (10,230)
Median non-family income in Northampton in 2022:
Northampton:
$3,267
State:
$38,934
Change in median non-family income between 2000 and 2022:: -87.7%
Northampton, Massachusetts:
-87.7%
State:
+69.2%
Median per capita income in Northampton in 2022:
Northampton:
$40,508
Massachusetts:
$33,524
Change in median per capita income between 2000 and 2022:
Northampton, Massachusetts:
+93.8%
Massachusetts:
+109.4%
Income statistics for Asian residents
Median household income in Northampton, MA in 2022:
Northampton:
$92,901
State:
$117,855
Change in median household income between 2000 and 2022:
Northampton, Massachusetts:
+106.7%
State:
+129.9%
Number of households with income < $10k:
Northampton:
11.4% (25)
State:
6.8% (11,982)
Number of households with income $10k - 20k:
Northampton:
0.0% (0)
State:
4.8% (8,376)
Number of households with income $20k - 30k:
Northampton:
26.0% (57)
State:
3.7% (6,558)
Number of households with income $30k - 40k:
Northampton:
3.2% (7)
State:
3.3% (5,748)
Number of households with income $40k - 50k:
Northampton:
1.4% (3)
State:
4.1% (7,192)
Number of households with income $50k - 60k:
Northampton:
0.0% (0)
State:
5.0% (8,734)
Number of households with income $60k - 75k:
Northampton:
1.8% (4)
Massachusetts:
5.8% (10,203)
Number of households with income $75k - 100k:
Northampton:
12.3% (27)
State:
8.6% (15,154)
Number of households with income $100k - 125k:
Northampton:
21.9% (48)
State:
10.8% (18,942)
Number of households with income $125k - 150k:
Northampton:
2.7% (6)
State:
8.0% (14,037)
Number of households with income $150k - 200k:
Northampton:
0.0% (0)
Massachusetts:
12.5% (21,856)
Number of households with income > $200k:
Northampton:
19.2% (42)
State:
26.6% (46,694)
Aggregate household income in Northampton in 2022: $36,947,613
Median family income in Northampton in 2022:
Northampton:
$101,560
State:
$140,113
Number of families with income $20k - 30k:
Northampton:
22.9% (31)
Massachusetts:
2.3% (2,708)
Number of families with income $30k - 40k:
Northampton:
4.8% (6)
Massachusetts:
2.8% (3,234)
Number of families with income $75k - 100k:
Northampton:
20.1% (27)
State:
8.5% (10,022)
Number of families with income $100k - 125k:
Northampton:
20.6% (28)
Massachusetts:
10.0% (11,697)
Number of families with income > $200k:
Northampton:
31.6% (42)
State:
34.0% (39,856)
Median per capita income in Northampton in 2022:
Northampton:
$36,151
Massachusetts:
$58,900
Change in median per capita income between 2000 and 2022:
Northampton, Massachusetts:
+69.4%
Massachusetts:
+174.6%
Income statistics for Hispanic or Latino residents
Median household income in Northampton, MA in 2022:
Northampton:
$42,303
State:
$61,523
Change in median household income between 2000 and 2022:
Northampton, Massachusetts:
+40.6%
Massachusetts:
+125.4%
Number of households with income < $10k:
Northampton:
10.0% (86)
State:
8.8% (25,307)
Number of households with income $10k - 20k:
Northampton:
5.6% (48)
Massachusetts:
10.0% (28,653)
Number of households with income $20k - 30k:
Northampton:
20.4% (175)
State:
8.8% (25,189)
Number of households with income $30k - 40k:
Northampton:
5.5% (47)
Massachusetts:
7.2% (20,822)
Number of households with income $40k - 50k:
Northampton:
9.3% (80)
State:
7.2% (20,817)
Number of households with income $50k - 60k:
Northampton:
3.2% (27)
Massachusetts:
6.5% (18,748)
Number of households with income $60k - 75k:
Northampton:
10.5% (90)
State:
8.8% (25,390)
Number of households with income $75k - 100k:
Northampton:
15.6% (134)
State:
12.0% (34,488)
Number of households with income $100k - 125k:
Northampton:
7.6% (65)
State:
8.6% (24,599)
Number of households with income $125k - 150k:
Northampton:
1.3% (11)
State:
6.2% (17,743)
Number of households with income $150k - 200k:
Northampton:
9.1% (78)
State:
7.3% (21,017)
Number of households with income > $200k:
Northampton:
1.9% (16)
Massachusetts:
8.6% (24,606)
Aggregate household income in Northampton in 2022: $61,660,364
Median per capita income in Northampton in 2022:
Northampton:
$21,289
State:
$28,993
Change in median per capita income between 2000 and 2022:
Northampton, Massachusetts:
+91.3%
State:
+142.4%
Income statistics for American Indian and Alaska Native residents
Median household income in Northampton, MA in 2022:
Northampton:
$60,168
Massachusetts:
$87,730
Number of households with income < $10k:
Northampton:
0.0% (0)
State:
6.6% (451)
Number of households with income $10k - 20k:
Northampton:
0.0% (0)
State:
7.0% (476)
Number of households with income $20k - 30k:
Northampton:
22.7% (5)
State:
2.8% (192)
Number of households with income $30k - 40k:
Northampton:
0.0% (0)
State:
3.2% (218)
Number of households with income $40k - 50k:
Northampton:
50.0% (11)
State:
2.9% (199)
Number of households with income $50k - 60k:
Northampton:
0.0% (0)
State:
9.9% (677)
Number of households with income $60k - 75k:
Northampton:
0.0% (0)
Massachusetts:
11.5% (781)
Number of households with income $75k - 100k:
Northampton:
0.0% (0)
State:
9.2% (629)
Number of households with income $100k - 125k:
Northampton:
0.0% (0)
State:
6.0% (406)
Number of households with income $125k - 150k:
Northampton:
27.3% (6)
State:
13.5% (921)
Number of households with income $150k - 200k:
Northampton:
0.0% (0)
Massachusetts:
12.6% (859)
Number of households with income > $200k:
Northampton:
0.0% (0)
State:
14.7% (1,003)
Aggregate household income in Northampton in 2022: $2,179,703
Median per capita income in Northampton in 2022:
Northampton:
$39,629
State:
$39,434
Income statistics for Multirace residents
Median household income in Northampton, MA in 2022:
Northampton:
$56,107
Massachusetts:
$71,552
Change in median household income between 2000 and 2022:
Northampton, Massachusetts:
+81.9%
State:
+109.0%
Number of households with income < $10k:
Northampton:
0.0% (0)
State:
6.6% (15,127)
Number of households with income $10k - 20k:
Northampton:
11.4% (66)
Massachusetts:
9.2% (21,158)
Number of households with income $20k - 30k:
Northampton:
5.0% (29)
State:
7.8% (18,016)
Number of households with income $30k - 40k:
Northampton:
6.9% (40)
Massachusetts:
7.9% (18,260)
Number of households with income $40k - 50k:
Northampton:
2.6% (15)
State:
5.6% (13,027)
Number of households with income $50k - 60k:
Northampton:
13.8% (80)
Massachusetts:
5.6% (12,909)
Number of households with income $60k - 75k:
Northampton:
4.0% (23)
Massachusetts:
9.0% (20,800)
Number of households with income $75k - 100k:
Northampton:
20.7% (120)
State:
12.1% (27,875)
Number of households with income $100k - 125k:
Northampton:
18.2% (106)
State:
8.1% (18,754)
Number of households with income $125k - 150k:
Northampton:
0.2% (1)
State:
6.8% (15,621)
Number of households with income $150k - 200k:
Northampton:
8.1% (47)
Massachusetts:
9.4% (21,618)
Number of households with income > $200k:
Northampton:
9.3% (54)
State:
12.0% (27,592)
Aggregate household income in Northampton in 2022: $54,514,176
Median family income in Northampton in 2022:
Northampton:
$178,353
State:
$78,380
Number of families with income $10k - 20k:
Northampton:
5.2% (11)
Massachusetts:
4.9% (7,678)
Number of families with income $20k - 30k:
Northampton:
4.6% (9)
State:
8.5% (13,245)
Number of families with income $50k - 60k:
Northampton:
24.6% (51)
State:
6.7% (10,445)
Number of families with income $75k - 100k:
Northampton:
13.0% (27)
Massachusetts:
12.1% (18,758)
Number of families with income $100k - 125k:
Northampton:
2.7% (6)
Massachusetts:
7.9% (12,321)
Number of families with income $150k - 200k:
Northampton:
23.9% (50)
State:
10.3% (15,978)
Number of families with income > $200k:
Northampton:
26.0% (54)
State:
14.0% (21,838)
Median non-family income in Northampton in 2022:
Northampton:
$61,761
Massachusetts:
$42,253
Change in median non-family income between 2000 and 2022:
Northampton, Massachusetts:
+97.6%
Massachusetts:
+93.7%
Median per capita income in Northampton in 2022:
Northampton:
$32,405
Massachusetts:
$34,029
Change in median per capita income between 2000 and 2022:
Northampton, Massachusetts:
+116.7%
Massachusetts:
+132.1%
Income statistics for other residents
Median household income in Northampton, MA in 2022:
Northampton:
$35,987
Massachusetts:
$61,039
Number of households with income < $10k:
Northampton:
19.3% (94)
State:
8.4% (11,559)
Number of households with income $10k - 20k:
Northampton:
7.0% (34)
State:
8.4% (11,499)
Number of households with income $20k - 30k:
Northampton:
24.7% (120)
State:
9.5% (13,070)
Number of households with income $30k - 40k:
Northampton:
6.4% (31)
Massachusetts:
6.0% (8,291)
Number of households with income $40k - 50k:
Northampton:
25.5% (124)
State:
9.2% (12,611)
Number of households with income $50k - 60k:
Northampton:
0.0% (0)
State:
7.9% (10,879)
Number of households with income $60k - 75k:
Northampton:
2.5% (12)
Massachusetts:
7.5% (10,239)
Number of households with income $75k - 100k:
Northampton:
3.7% (18)
Massachusetts:
13.1% (18,032)
Number of households with income $100k - 125k:
Northampton:
1.4% (7)
State:
9.6% (13,141)
Number of households with income $125k - 150k:
Northampton:
1.0% (5)
Massachusetts:
5.0% (6,808)
Number of households with income $150k - 200k:
Northampton:
8.4% (41)
Massachusetts:
6.4% (8,843)
Number of households with income > $200k:
Northampton:
0.0% (0)
State:
9.0% (12,396)
Aggregate household income in Northampton in 2022: $14,727,661
Median family income in Northampton in 2022:
Northampton:
$47,301
State:
$66,840
Number of families with income $10k - 20k:
Northampton:
3.2% (7)
State:
4.7% (4,798)
Number of families with income $20k - 30k:
Northampton:
22.1% (47)
Massachusetts:
10.4% (10,595)
Number of families with income $30k - 40k:
Northampton:
17.4% (37)
State:
7.0% (7,154)
Number of families with income $40k - 50k:
Northampton:
38.6% (81)
State:
8.9% (9,052)
Number of families with income $75k - 100k:
Northampton:
3.5% (7)
State:
12.8% (12,997)
Number of families with income $100k - 125k:
Northampton:
3.3% (7)
State:
9.3% (9,480)
Number of families with income $125k - 150k:
Northampton:
2.4% (5)
State:
5.3% (5,373)
Number of families with income $150k - 200k:
Northampton:
9.5% (20)
State:
7.5% (7,659)
Median per capita income in Northampton in 2022:
Northampton:
$19,726
Massachusetts:
$30,797
Change in median per capita income between 2000 and 2022:
Northampton, Massachusetts:
+121.7%
State:
+188.5%
Discuss Northampton, Massachusetts (MA) on our hugely popular Massachusetts forum.