North Valleys, Nevada (NV) income map, earnings map, and wages data
The median household income in North Valleys, NV in 2022 was $88,447, which was 18.2% greater than the median annual income of $72,333 across the entire state of Nevada. Compared to the median income of $50,574 in 2000 this represents an increase of 42.8%. The per capita income in 2022 was $36,963, which means an increase of 46.3% compared to 2000 when it was $19,867.
Income statistics for all residents
Median household income in North Valleys, NV in 2022:| North Valleys: | $88,448 |
| State: | $72,333 |
Change in median household income between 2000 and 2022:| North Valleys, Nevada: | +74.9% |
| State: | +62.3% |
Number of households with income < $10k:| North Valleys: | 4.7% (10,234) |
| Nevada: | 5.6% (67,608) |
Number of households with income $10k - 20k:| North Valleys: | 5.2% (11,361) |
| State: | 5.8% (69,869) |
Number of households with income $20k - 30k:| North Valleys: | 6.0% (13,074) |
| Nevada: | 7.1% (84,856) |
Number of households with income $30k - 40k:| North Valleys: | 7.2% (15,860) |
| State: | 7.7% (92,600) |
Number of households with income $40k - 50k:| North Valleys: | 7.3% (16,108) |
| Nevada: | 7.9% (94,898) |
Number of households with income $50k - 60k:| North Valleys: | 7.1% (15,622) |
| State: | 7.3% (88,037) |
Number of households with income $60k - 75k:| North Valleys: | 9.2% (20,140) |
| State: | 10.2% (122,705) |
Number of households with income $75k - 100k:| North Valleys: | 14.0% (30,612) |
| State: | 13.6% (162,870) |
Number of households with income $100k - 125k:| North Valleys: | 11.8% (25,977) |
| Nevada: | 10.7% (127,735) |
Number of households with income $125k - 150k:| North Valleys: | 7.9% (17,361) |
| State: | 7.3% (86,891) |
Number of households with income $150k - 200k:| North Valleys: | 8.2% (17,905) |
| State: | 7.9% (94,679) |
Number of households with income > $200k:| North Valleys: | 11.4% (25,069) |
| Nevada: | 8.8% (105,608) |
Aggregate household income in North Valleys in 2022: $6,650,182,318
Median family income in North Valleys in 2022:| North Valleys: | $92,746 |
| State: | $85,593 |
Median non-family income in North Valleys in 2022:| North Valleys: | $61,495 |
| Nevada: | $46,176 |
Change in median non-family income between 2000 and 2022:| North Valleys, Nevada: | +65.9% |
| State: | +53.5% |
Median per capita income in North Valleys in 2022:| North Valleys: | $36,963 |
| State: | $38,183 |
Change in median per capita income between 2000 and 2022:| North Valleys, Nevada: | +86.1% |
| State: | +73.6% |
Income statistics for White residents
Median household income in North Valleys, NV in 2022:| North Valleys: | $87,531 |
| State: | $78,201 |
Change in median household income between 2000 and 2022:| North Valleys, Nevada: | +72.8% |
| State: | +68.9% |
Number of households with income < $10k:| North Valleys: | 4.8% (7,431) |
| State: | 5.3% (36,449) |
Number of households with income $10k - 20k:| North Valleys: | 5.1% (7,870) |
| Nevada: | 5.4% (37,351) |
Number of households with income $20k - 30k:| North Valleys: | 6.2% (9,557) |
| Nevada: | 6.8% (46,880) |
Number of households with income $30k - 40k:| North Valleys: | 7.5% (11,477) |
| Nevada: | 6.8% (46,939) |
Number of households with income $40k - 50k:| North Valleys: | 6.3% (9,722) |
| Nevada: | 7.0% (48,126) |
Number of households with income $50k - 60k:| North Valleys: | 6.8% (10,400) |
| Nevada: | 6.9% (47,402) |
Number of households with income $60k - 75k:| North Valleys: | 9.0% (13,788) |
| State: | 10.0% (68,993) |
Number of households with income $75k - 100k:| North Valleys: | 13.0% (19,949) |
| State: | 13.1% (90,439) |
Number of households with income $100k - 125k:| North Valleys: | 12.1% (18,624) |
| Nevada: | 11.1% (77,026) |
Number of households with income $125k - 150k:| North Valleys: | 7.7% (11,831) |
| State: | 7.7% (53,064) |
Number of households with income $150k - 200k:| North Valleys: | 8.5% (13,085) |
| State: | 9.2% (63,350) |
Number of households with income > $200k:| North Valleys: | 12.9% (19,838) |
| Nevada: | 11.0% (75,795) |
Aggregate household income in North Valleys in 2022: $4,484,027,251
Median family income in North Valleys in 2022:| North Valleys: | $94,656 |
| State: | $96,356 |
Number of families with income < $10k:| North Valleys: | 2.3% (158) |
| Nevada: | 3.2% (13,462) |
Number of families with income $10k - 20k:| North Valleys: | 2.7% (188) |
| State: | 2.8% (11,864) |
Number of families with income $20k - 30k:| North Valleys: | 5.5% (380) |
| State: | 4.1% (17,424) |
Number of families with income $30k - 40k:| North Valleys: | 6.6% (453) |
| State: | 4.9% (21,005) |
Number of families with income $40k - 50k:| North Valleys: | 10.1% (701) |
| State: | 6.2% (26,302) |
Number of families with income $50k - 60k:| North Valleys: | 10.3% (711) |
| State: | 6.1% (26,174) |
Number of families with income $60k - 75k:| North Valleys: | 13.7% (950) |
| Nevada: | 9.7% (41,339) |
Number of families with income $75k - 100k:| North Valleys: | 21.6% (1,496) |
| State: | 14.9% (63,685) |
Number of families with income $100k - 125k:| North Valleys: | 11.0% (763) |
| State: | 13.1% (56,000) |
Number of families with income $125k - 150k:| North Valleys: | 7.0% (486) |
| Nevada: | 9.3% (39,853) |
Number of families with income $150k - 200k:| North Valleys: | 2.8% (196) |
| Nevada: | 11.6% (49,473) |
Number of families with income > $200k:| North Valleys: | 6.3% (437) |
| State: | 14.1% (60,154) |
Median non-family income in North Valleys in 2022:| North Valleys: | $61,114 |
| State: | $49,909 |
Change in median non-family income between 2000 and 2022:| North Valleys, Nevada: | +65.2% |
| State: | +62.2% |
Median per capita income in North Valleys in 2022:| North Valleys: | $41,401 |
| State: | $47,995 |
Change in median per capita income between 2000 and 2022:| North Valleys, Nevada: | +99.7% |
| State: | +98.1% |
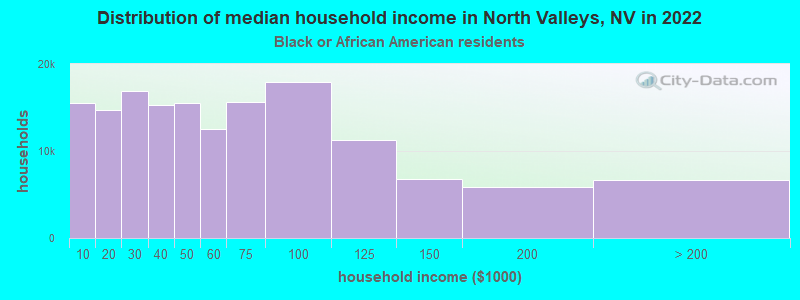
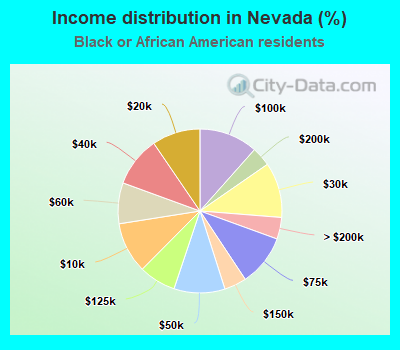
Income statistics for Black or African American residents
Median household income in North Valleys, NV in 2022:| North Valleys: | $80,115 |
| State: | $49,549 |
Change in median household income between 2000 and 2022:| North Valleys, Nevada: | +78.7% |
| Nevada: | +47.3% |
Number of households with income < $10k:| North Valleys: | 10.1% (15,547) |
| State: | 10.1% (11,664) |
Number of households with income $10k - 20k:| North Valleys: | 9.5% (14,722) |
| State: | 9.5% (11,045) |
Number of households with income $20k - 30k:| North Valleys: | 10.9% (16,857) |
| State: | 10.9% (12,647) |
Number of households with income $30k - 40k:| North Valleys: | 9.9% (15,320) |
| State: | 9.9% (11,494) |
Number of households with income $40k - 50k:| North Valleys: | 10.1% (15,573) |
| State: | 10.1% (11,683) |
Number of households with income $50k - 60k:| North Valleys: | 8.1% (12,484) |
| Nevada: | 8.1% (9,366) |
Number of households with income $60k - 75k:| North Valleys: | 10.1% (15,673) |
| State: | 10.1% (11,759) |
Number of households with income $75k - 100k:| North Valleys: | 11.6% (17,893) |
| State: | 11.6% (13,424) |
Number of households with income $100k - 125k:| North Valleys: | 7.3% (11,303) |
| Nevada: | 7.3% (8,480) |
Number of households with income $125k - 150k:| North Valleys: | 4.4% (6,795) |
| State: | 4.4% (5,098) |
Number of households with income $150k - 200k:| North Valleys: | 3.8% (5,887) |
| State: | 3.8% (4,417) |
Number of households with income > $200k:| North Valleys: | 4.3% (6,618) |
| State: | 4.3% (4,965) |
Aggregate household income in North Valleys in 2022: $22,325,099
Median family income in North Valleys in 2022:| North Valleys: | $115,398 |
| Nevada: | $64,687 |
Number of families with income < $10k:| North Valleys: | 2.7% (6) |
| State: | 7.3% (4,591) |
Number of families with income $20k - 30k:| North Valleys: | 7.1% (16) |
| Nevada: | 7.6% (4,775) |
Number of families with income $40k - 50k:| North Valleys: | 13.3% (29) |
| Nevada: | 10.8% (6,837) |
Number of families with income $50k - 60k:| North Valleys: | 5.6% (12) |
| State: | 6.3% (4,007) |
Number of families with income $60k - 75k:| North Valleys: | 7.1% (16) |
| Nevada: | 9.9% (6,249) |
Number of families with income $100k - 125k:| North Valleys: | 12.3% (27) |
| State: | 10.4% (6,588) |
Number of families with income > $200k:| North Valleys: | 51.8% (115) |
| State: | 6.5% (4,121) |
Median non-family income in North Valleys in 2022:| North Valleys: | $4,219 |
| State: | $34,427 |
Change in median non-family income between 2000 and 2022:| North Valleys, Nevada: | +68.8% |
| Nevada: | +41.0% |
Median per capita income in North Valleys in 2022:| North Valleys: | $39,080 |
| Nevada: | $28,788 |
Change in median per capita income between 2000 and 2022:| North Valleys, Nevada: | +60.9% |
| Nevada: | +72.3% |
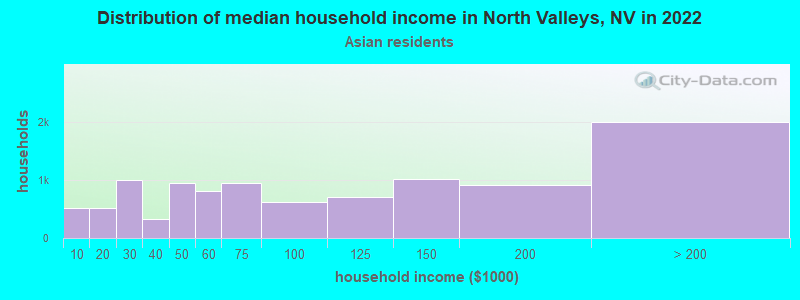
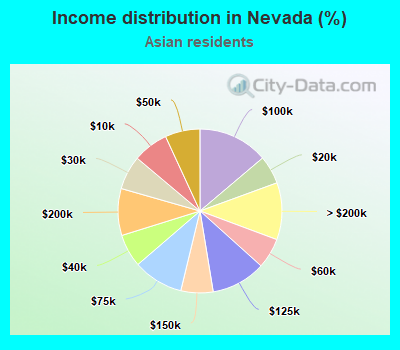
Income statistics for Asian residents
Median household income in North Valleys, NV in 2022:| North Valleys: | $88,429 |
| Nevada: | $78,161 |
Change in median household income between 2000 and 2022:| North Valleys, Nevada: | +76.0% |
| State: | +68.7% |
Number of households with income < $10k:| North Valleys: | 5.0% (517) |
| State: | 7.0% (7,099) |
Number of households with income $10k - 20k:| North Valleys: | 5.0% (512) |
| State: | 5.6% (5,682) |
Number of households with income $20k - 30k:| North Valleys: | 9.7% (1,000) |
| State: | 6.7% (6,820) |
Number of households with income $30k - 40k:| North Valleys: | 3.2% (334) |
| State: | 6.5% (6,583) |
Number of households with income $40k - 50k:| North Valleys: | 9.1% (941) |
| State: | 6.9% (6,984) |
Number of households with income $50k - 60k:| North Valleys: | 7.8% (806) |
| State: | 6.0% (6,068) |
Number of households with income $60k - 75k:| North Valleys: | 9.2% (950) |
| Nevada: | 9.9% (10,078) |
Number of households with income $75k - 100k:| North Valleys: | 5.9% (612) |
| Nevada: | 13.8% (14,050) |
Number of households with income $100k - 125k:| North Valleys: | 6.9% (711) |
| State: | 10.8% (10,934) |
Number of households with income $125k - 150k:| North Valleys: | 9.8% (1,011) |
| State: | 6.4% (6,456) |
Number of households with income $150k - 200k:| North Valleys: | 8.8% (905) |
| State: | 9.2% (9,397) |
Number of households with income > $200k:| North Valleys: | 19.4% (1,999) |
| State: | 11.3% (11,447) |
Aggregate household income in North Valleys in 2022: $76,497,673
Median family income in North Valleys in 2022:| North Valleys: | $127,727 |
| State: | $87,703 |
Number of families with income $10k - 20k:| North Valleys: | 4.4% (12) |
| State: | 4.0% (2,897) |
Number of families with income $20k - 30k:| North Valleys: | 6.9% (18) |
| State: | 5.3% (3,852) |
Number of families with income $40k - 50k:| North Valleys: | 2.6% (7) |
| State: | 5.3% (3,846) |
Number of families with income $50k - 60k:| North Valleys: | 8.2% (21) |
| Nevada: | 6.0% (4,374) |
Number of families with income $60k - 75k:| North Valleys: | 6.0% (16) |
| State: | 9.7% (7,040) |
Number of families with income $75k - 100k:| North Valleys: | 21.8% (57) |
| State: | 15.8% (11,472) |
Number of families with income $100k - 125k:| North Valleys: | 27.3% (71) |
| Nevada: | 13.1% (9,513) |
Number of families with income $125k - 150k:| North Valleys: | 22.9% (60) |
| State: | 7.6% (5,511) |
Median non-family income in North Valleys in 2022:| North Valleys: | $78,709 |
| Nevada: | $44,408 |
Change in median non-family income between 2000 and 2022:| North Valleys, Nevada: | +109.2% |
| State: | +60.0% |
Median per capita income in North Valleys in 2022:| North Valleys: | $54,016 |
| Nevada: | $41,086 |
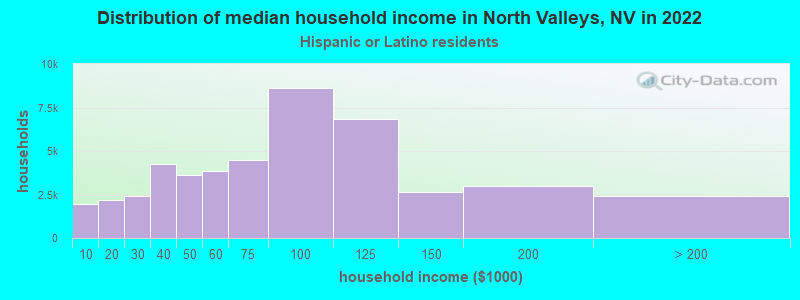
Income statistics for Hispanic or Latino residents
Median household income in North Valleys, NV in 2022:| North Valleys: | $97,668 |
| Nevada: | $68,581 |
Change in median household income between 2000 and 2022:| North Valleys, Nevada: | +103.3% |
| State: | +80.3% |
Number of households with income < $10k:| North Valleys: | 4.2% (1,946) |
| State: | 4.6% (12,224) |
Number of households with income $10k - 20k:| North Valleys: | 4.7% (2,157) |
| State: | 4.3% (11,419) |
Number of households with income $20k - 30k:| North Valleys: | 5.2% (2,386) |
| State: | 6.3% (16,728) |
Number of households with income $30k - 40k:| North Valleys: | 9.2% (4,233) |
| State: | 10.1% (26,750) |
Number of households with income $40k - 50k:| North Valleys: | 7.8% (3,600) |
| State: | 9.2% (24,344) |
Number of households with income $50k - 60k:| North Valleys: | 8.3% (3,837) |
| Nevada: | 8.8% (23,471) |
Number of households with income $60k - 75k:| North Valleys: | 9.7% (4,492) |
| Nevada: | 11.4% (30,149) |
Number of households with income $75k - 100k:| North Valleys: | 18.6% (8,615) |
| Nevada: | 16.8% (44,550) |
Number of households with income $100k - 125k:| North Valleys: | 14.8% (6,859) |
| State: | 11.0% (29,133) |
Number of households with income $125k - 150k:| North Valleys: | 5.8% (2,664) |
| Nevada: | 7.1% (18,850) |
Number of households with income $150k - 200k:| North Valleys: | 6.5% (3,011) |
| State: | 6.2% (16,523) |
Number of households with income > $200k:| North Valleys: | 5.3% (2,439) |
| Nevada: | 4.2% (11,154) |
Aggregate household income in North Valleys in 2022: $216,828,610
Median family income in North Valleys in 2022:| North Valleys: | $100,535 |
| State: | $72,789 |
Number of families with income < $10k:| North Valleys: | 4.3% (118) |
| State: | 4.2% (8,462) |
Number of families with income $10k - 20k:| North Valleys: | 3.7% (102) |
| State: | 3.4% (6,823) |
Number of families with income $20k - 30k:| North Valleys: | 4.9% (137) |
| Nevada: | 5.7% (11,542) |
Number of families with income $30k - 40k:| North Valleys: | 10.4% (288) |
| State: | 8.8% (17,635) |
Number of families with income $40k - 50k:| North Valleys: | 10.3% (285) |
| State: | 9.1% (18,242) |
Number of families with income $50k - 60k:| North Valleys: | 10.3% (284) |
| State: | 8.8% (17,626) |
Number of families with income $60k - 75k:| North Valleys: | 14.9% (413) |
| State: | 12.1% (24,335) |
Number of families with income $75k - 100k:| North Valleys: | 24.1% (666) |
| State: | 17.9% (35,984) |
Number of families with income $100k - 125k:| North Valleys: | 10.8% (300) |
| State: | 10.8% (21,730) |
Number of families with income $125k - 150k:| North Valleys: | 3.6% (100) |
| Nevada: | 7.8% (15,764) |
Number of families with income $150k - 200k:| North Valleys: | 1.2% (34) |
| State: | 6.6% (13,251) |
Number of families with income > $200k:| North Valleys: | 1.4% (38) |
| State: | 4.9% (9,843) |
Median non-family income in North Valleys in 2022:| North Valleys: | $68,810 |
| Nevada: | $44,232 |
Change in median non-family income between 2000 and 2022:| North Valleys, Nevada: | +83.1% |
| Nevada: | +66.8% |
Median per capita income in North Valleys in 2022:| North Valleys: | $27,198 |
| Nevada: | $24,350 |
Change in median per capita income between 2000 and 2022:| North Valleys, Nevada: | +122.2% |
| Nevada: | +96.3% |
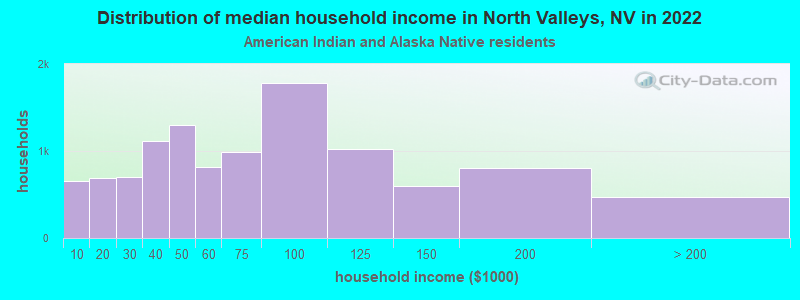
Income statistics for American Indian and Alaska Native residents
Median household income in North Valleys, NV in 2022:| North Valleys: | $118,498 |
| State: | $64,492 |
Change in median household income between 2000 and 2022:| North Valleys, Nevada: | +143.1% |
| State: | +84.7% |
Number of households with income < $10k:| North Valleys: | 6.0% (653) |
| State: | 5.7% (901) |
Number of households with income $10k - 20k:| North Valleys: | 6.3% (693) |
| State: | 6.0% (950) |
Number of households with income $20k - 30k:| North Valleys: | 6.4% (704) |
| State: | 6.3% (987) |
Number of households with income $30k - 40k:| North Valleys: | 10.2% (1,115) |
| State: | 10.2% (1,603) |
Number of households with income $40k - 50k:| North Valleys: | 11.9% (1,302) |
| State: | 11.8% (1,870) |
Number of households with income $50k - 60k:| North Valleys: | 7.4% (814) |
| Nevada: | 7.5% (1,182) |
Number of households with income $60k - 75k:| North Valleys: | 9.0% (989) |
| Nevada: | 9.1% (1,436) |
Number of households with income $75k - 100k:| North Valleys: | 16.2% (1,779) |
| State: | 16.5% (2,607) |
Number of households with income $100k - 125k:| North Valleys: | 9.3% (1,022) |
| State: | 9.5% (1,505) |
Number of households with income $125k - 150k:| North Valleys: | 5.5% (599) |
| State: | 5.6% (879) |
Number of households with income $150k - 200k:| North Valleys: | 7.4% (807) |
| Nevada: | 7.5% (1,180) |
Number of households with income > $200k:| North Valleys: | 4.3% (472) |
| State: | 4.4% (689) |
Aggregate household income in North Valleys in 2022: $14,262,663
Median family income in North Valleys in 2022:| North Valleys: | $110,900 |
| State: | $71,652 |
Number of families with income $20k - 30k:| North Valleys: | 5.1% (4) |
| State: | 6.5% (683) |
Number of families with income $30k - 40k:| North Valleys: | 6.8% (6) |
| Nevada: | 10.2% (1,062) |
Number of families with income $40k - 50k:| North Valleys: | 45.4% (38) |
| State: | 15.2% (1,588) |
Number of families with income $50k - 60k:| North Valleys: | 9.8% (8) |
| Nevada: | 8.3% (871) |
Number of families with income $60k - 75k:| North Valleys: | 20.5% (17) |
| State: | 6.5% (676) |
Number of families with income $75k - 100k:| North Valleys: | 12.4% (10) |
| State: | 16.7% (1,742) |
Median non-family income in North Valleys in 2022:| North Valleys: | $95,357 |
| State: | $42,455 |
Change in median non-family income between 2000 and 2022:| North Valleys, Nevada: | +106.7% |
| State: | +80.9% |
Median per capita income in North Valleys in 2022:| North Valleys: | $23,101 |
| State: | $25,065 |
Change in median per capita income between 2000 and 2022:| North Valleys, Nevada: | +85.8% |
| State: | +62.9% |
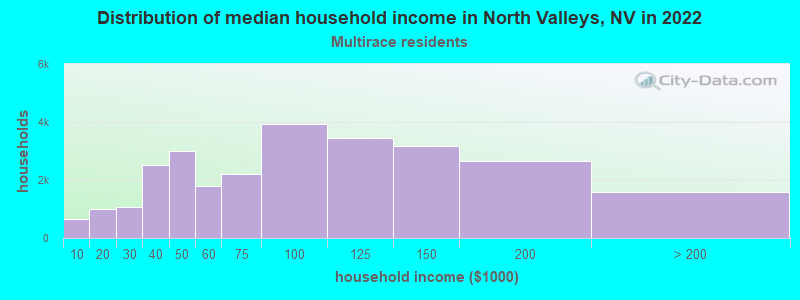
Income statistics for Multirace residents
Median household income in North Valleys, NV in 2022:| North Valleys: | $101,260 |
| State: | $74,091 |
Change in median household income between 2000 and 2022:| North Valleys, Nevada: | +101.8% |
| Nevada: | +87.5% |
Number of households with income < $10k:| North Valleys: | 2.4% (659) |
| State: | 3.6% (5,458) |
Number of households with income $10k - 20k:| North Valleys: | 3.7% (997) |
| Nevada: | 4.6% (6,994) |
Number of households with income $20k - 30k:| North Valleys: | 3.9% (1,052) |
| State: | 6.6% (10,153) |
Number of households with income $30k - 40k:| North Valleys: | 9.4% (2,527) |
| Nevada: | 9.2% (14,065) |
Number of households with income $40k - 50k:| North Valleys: | 11.1% (2,995) |
| State: | 9.7% (14,888) |
Number of households with income $50k - 60k:| North Valleys: | 6.6% (1,789) |
| State: | 7.1% (10,814) |
Number of households with income $60k - 75k:| North Valleys: | 8.1% (2,199) |
| State: | 9.7% (14,785) |
Number of households with income $75k - 100k:| North Valleys: | 14.6% (3,929) |
| State: | 14.6% (22,312) |
Number of households with income $100k - 125k:| North Valleys: | 12.7% (3,440) |
| State: | 12.6% (19,262) |
Number of households with income $125k - 150k:| North Valleys: | 11.7% (3,170) |
| State: | 8.7% (13,275) |
Number of households with income $150k - 200k:| North Valleys: | 9.9% (2,670) |
| Nevada: | 7.1% (10,851) |
Number of households with income > $200k:| North Valleys: | 5.8% (1,571) |
| State: | 6.5% (9,903) |
Aggregate household income in North Valleys in 2022: $227,649,728
Median family income in North Valleys in 2022:| North Valleys: | $106,995 |
| State: | $79,013 |
Number of families with income < $10k:| North Valleys: | 2.4% (34) |
| State: | 2.8% (3,068) |
Number of families with income $10k - 20k:| North Valleys: | 0.8% (12) |
| Nevada: | 3.2% (3,527) |
Number of families with income $20k - 30k:| North Valleys: | 4.0% (56) |
| State: | 6.0% (6,593) |
Number of families with income $30k - 40k:| North Valleys: | 8.4% (118) |
| State: | 6.6% (7,240) |
Number of families with income $40k - 50k:| North Valleys: | 7.4% (103) |
| State: | 9.1% (9,970) |
Number of families with income $50k - 60k:| North Valleys: | 9.8% (137) |
| State: | 8.1% (8,868) |
Number of families with income $60k - 75k:| North Valleys: | 11.3% (160) |
| State: | 10.9% (11,869) |
Number of families with income $75k - 100k:| North Valleys: | 4.4% (62) |
| State: | 14.4% (15,706) |
Number of families with income $100k - 125k:| North Valleys: | 36.1% (507) |
| Nevada: | 12.8% (13,988) |
Number of families with income $125k - 150k:| North Valleys: | 15.4% (217) |
| Nevada: | 9.5% (10,430) |
Median non-family income in North Valleys in 2022:| North Valleys: | $77,233 |
| State: | $46,680 |
Change in median non-family income between 2000 and 2022:| North Valleys, Nevada: | +87.2% |
| State: | +66.3% |
Median per capita income in North Valleys in 2022:| North Valleys: | $27,741 |
| State: | $26,832 |
Change in median per capita income between 2000 and 2022:| North Valleys, Nevada: | +135.9% |
| State: | +98.9% |
Income statistics for other residents
Number of households with income < $10k:| North Valleys: | 6.2% (82) |
| State: | 5.0% (5,632) |
Number of households with income $10k - 20k:| North Valleys: | 6.2% (83) |
| State: | 6.6% (7,517) |
Number of households with income $20k - 30k:| North Valleys: | 4.8% (64) |
| State: | 6.2% (7,053) |
Number of households with income $30k - 40k:| North Valleys: | 5.6% (74) |
| Nevada: | 10.4% (11,739) |
Number of households with income $40k - 50k:| North Valleys: | 7.4% (98) |
| State: | 9.1% (10,276) |
Number of households with income $50k - 60k:| North Valleys: | 9.8% (131) |
| Nevada: | 10.3% (11,711) |
Number of households with income $60k - 75k:| North Valleys: | 13.4% (179) |
| State: | 13.5% (15,261) |
Number of households with income $75k - 100k:| North Valleys: | 24.0% (320) |
| State: | 16.8% (18,986) |
Number of households with income $100k - 125k:| North Valleys: | 11.3% (150) |
| State: | 9.1% (10,333) |
Number of households with income $125k - 150k:| North Valleys: | 2.8% (37) |
| State: | 6.3% (7,104) |
Number of households with income $150k - 200k:| North Valleys: | 4.1% (54) |
| Nevada: | 4.5% (5,061) |
Number of households with income > $200k:| North Valleys: | 4.6% (61) |
| State: | 2.3% (2,619) |
Aggregate household income in North Valleys in 2022: $104,663,824
Median family income in North Valleys in 2022:| North Valleys: | $106,654 |
| State: | $66,209 |
Number of families with income < $10k:| North Valleys: | 2.2% (25) |
| Nevada: | 5.2% (4,485) |
Number of families with income $10k - 20k:| North Valleys: | 0.6% (6) |
| State: | 5.1% (4,452) |
Number of families with income $20k - 30k:| North Valleys: | 2.0% (23) |
| State: | 5.3% (4,626) |
Number of families with income $30k - 40k:| North Valleys: | 3.1% (35) |
| State: | 10.5% (9,093) |
Number of families with income $40k - 50k:| North Valleys: | 5.6% (63) |
| Nevada: | 8.8% (7,610) |
Number of families with income $50k - 60k:| North Valleys: | 7.1% (80) |
| State: | 8.3% (7,162) |
Number of families with income $60k - 75k:| North Valleys: | 17.7% (201) |
| State: | 14.2% (12,301) |
Number of families with income $75k - 100k:| North Valleys: | 37.9% (431) |
| State: | 18.8% (16,302) |
Number of families with income $100k - 125k:| North Valleys: | 14.3% (162) |
| Nevada: | 10.0% (8,709) |
Number of families with income > $200k:| North Valleys: | 9.7% (110) |
| State: | 2.5% (2,202) |
Median non-family income in North Valleys in 2022:| North Valleys: | $41,512 |
| State: | $42,277 |
Change in median non-family income between 2000 and 2022:| North Valleys, Nevada: | +30.2% |
| State: | +54.2% |
Median per capita income in North Valleys in 2022:| North Valleys: | $28,957 |
| State: | $22,891 |
Change in median per capita income between 2000 and 2022:| North Valleys, Nevada: | +118.2% |
| State: | +93.2% |