North Elba, New York (NY) income map, earnings map, and wages data
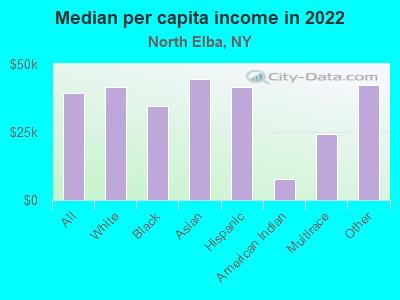
The median household income in North Elba, NY in 2022 was $64,315, which was 23.7% less than the median annual income of $79,557 across the entire state of New York. Compared to the median income of $35,329 in 2000 this represents an increase of 45.1%. The per capita income in 2022 was $39,245, which means an increase of 50.9% compared to 2000 when it was $19,259.
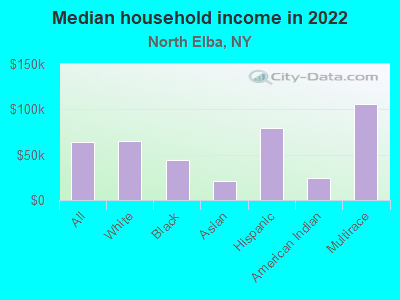
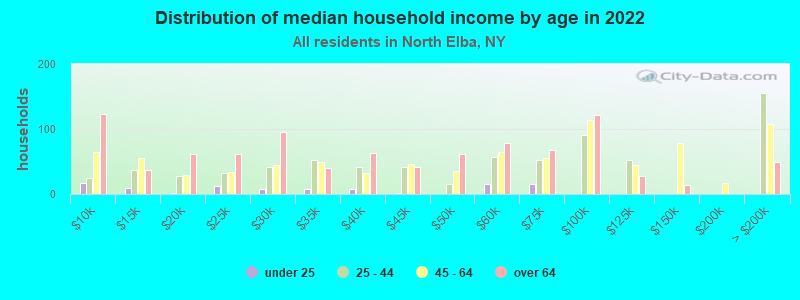
Income statistics for all residents
Median household income in North Elba, NY in 2022:| North Elba: | $64,316 |
| New York: | $79,557 |
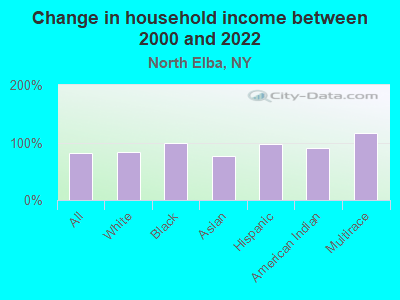
Change in median household income between 2000 and 2022:| North Elba, New York: | +82.0% |
| New York: | +83.3% |
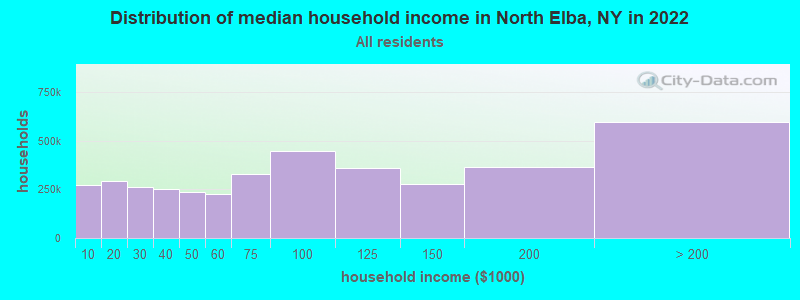
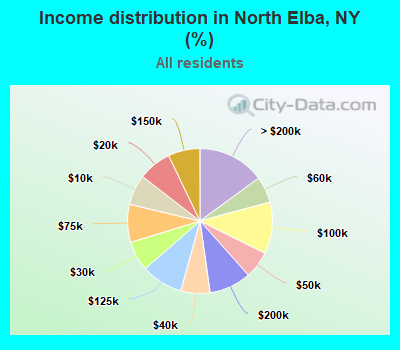
Number of households with income < $10k:| North Elba: | 6.8% (214,884) |
| State: | 6.8% (527,598) |
Number of households with income $10k - 20k:| North Elba: | 7.4% (234,126) |
| State: | 7.4% (574,940) |
Number of households with income $20k - 30k:| North Elba: | 6.7% (210,806) |
| New York: | 6.7% (517,718) |
Number of households with income $30k - 40k:| North Elba: | 6.5% (206,293) |
| State: | 6.5% (506,674) |
Number of households with income $40k - 50k:| North Elba: | 6.1% (191,527) |
| State: | 6.1% (470,439) |
Number of households with income $50k - 60k:| North Elba: | 5.8% (184,849) |
| State: | 5.8% (454,042) |
Number of households with income $60k - 75k:| North Elba: | 8.5% (267,679) |
| State: | 8.5% (657,508) |
Number of households with income $75k - 100k:| North Elba: | 11.6% (366,326) |
| State: | 11.6% (899,824) |
Number of households with income $100k - 125k:| North Elba: | 9.3% (294,681) |
| New York: | 9.3% (723,825) |
Number of households with income $125k - 150k:| North Elba: | 7.1% (224,910) |
| State: | 7.1% (552,420) |
Number of households with income $150k - 200k:| North Elba: | 9.4% (296,042) |
| State: | 9.4% (727,051) |
Number of households with income > $200k:| North Elba: | 15.0% (473,351) |
| State: | 15.0% (1,162,269) |
Aggregate household income in North Elba in 2022: $28,009,075,800
Median family income in North Elba in 2022:| North Elba: | $85,577 |
| New York: | $99,066 |
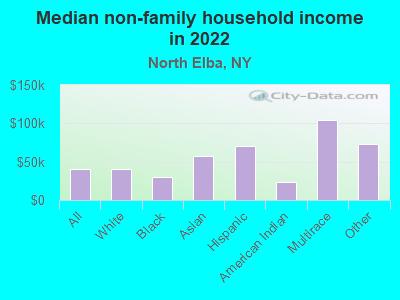
Median non-family income in North Elba in 2022:| North Elba: | $39,803 |
| New York: | $50,181 |
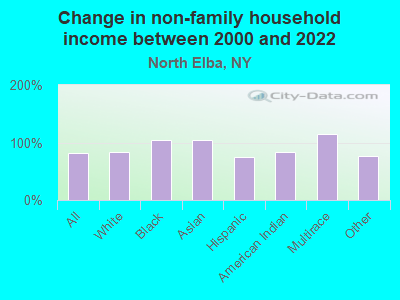
Change in median non-family income between 2000 and 2022:| North Elba, New York: | +81.3% |
| New York: | +85.4% |
Median per capita income in North Elba in 2022:| North Elba: | $39,245 |
| State: | $47,421 |
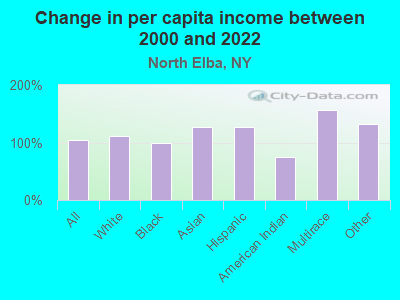
Change in median per capita income between 2000 and 2022:| North Elba, New York: | +103.8% |
| State: | +102.7% |
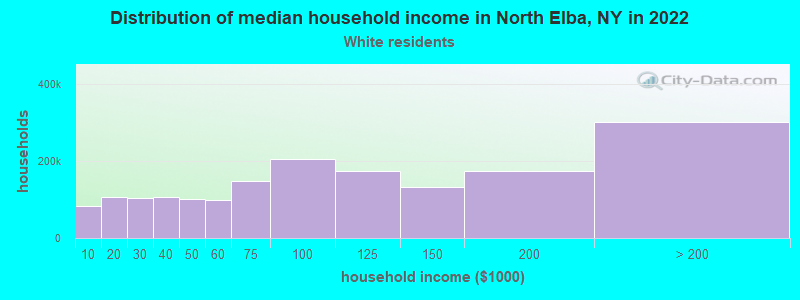
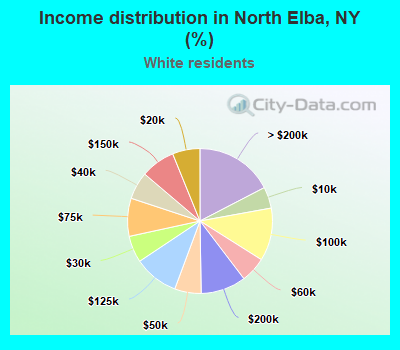
Income statistics for White residents
Median household income in North Elba, NY in 2022:| North Elba: | $64,854 |
| State: | $89,408 |
Change in median household income between 2000 and 2022:| North Elba, New York: | +83.3% |
| State: | +85.5% |
Number of households with income < $10k:| North Elba: | 4.8% (82,412) |
| State: | 4.8% (225,550) |
Number of households with income $10k - 20k:| North Elba: | 6.1% (106,183) |
| State: | 6.1% (289,425) |
Number of households with income $20k - 30k:| North Elba: | 6.0% (102,994) |
| State: | 5.9% (280,254) |
Number of households with income $30k - 40k:| North Elba: | 6.1% (106,055) |
| State: | 6.1% (288,263) |
Number of households with income $40k - 50k:| North Elba: | 5.9% (102,413) |
| State: | 5.9% (278,079) |
Number of households with income $50k - 60k:| North Elba: | 5.7% (98,592) |
| State: | 5.7% (267,554) |
Number of households with income $60k - 75k:| North Elba: | 8.5% (146,823) |
| State: | 8.4% (398,344) |
Number of households with income $75k - 100k:| North Elba: | 11.8% (204,465) |
| State: | 11.8% (554,841) |
Number of households with income $100k - 125k:| North Elba: | 10.0% (172,632) |
| State: | 10.0% (469,794) |
Number of households with income $125k - 150k:| North Elba: | 7.7% (132,388) |
| State: | 7.6% (360,467) |
Number of households with income $150k - 200k:| North Elba: | 10.1% (174,387) |
| New York: | 10.1% (477,078) |
Number of households with income > $200k:| North Elba: | 17.4% (300,806) |
| State: | 17.6% (829,233) |
Aggregate household income in North Elba in 2022: $18,608,485,100
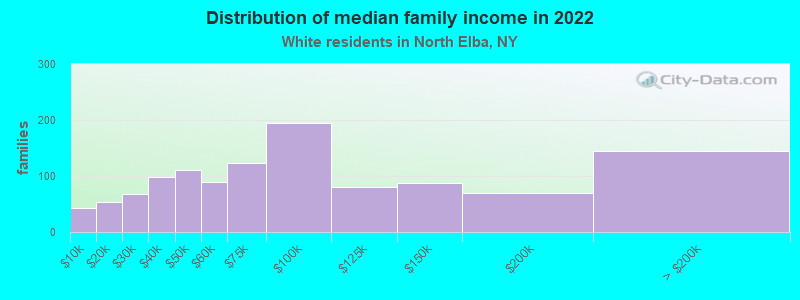
Median family income in North Elba in 2022:| North Elba: | $87,883 |
| State: | $115,170 |
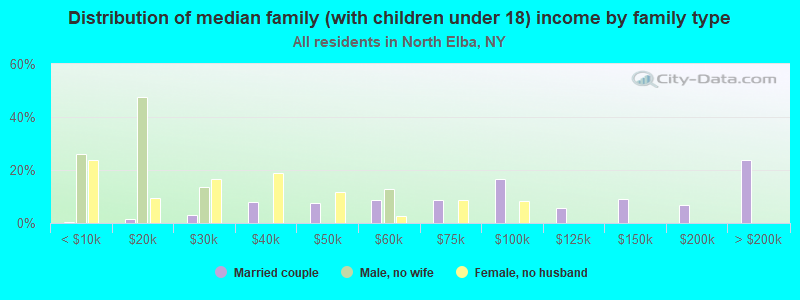
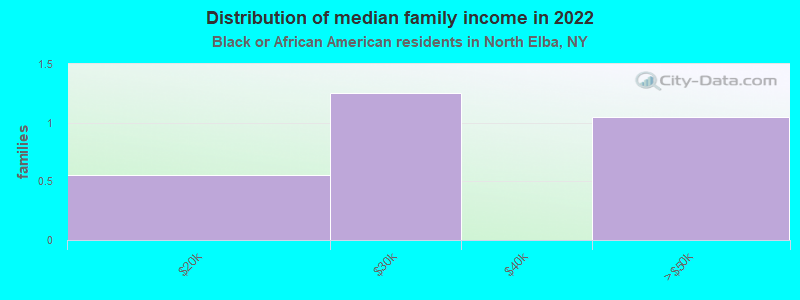
Number of families with income < $10k:| North Elba: | 3.7% (43) |
| New York: | 2.5% (68,851) |
Number of families with income $10k - 20k:| North Elba: | 4.6% (54) |
| State: | 3.0% (83,127) |
Number of families with income $20k - 30k:| North Elba: | 5.8% (67) |
| State: | 3.5% (97,578) |
Number of families with income $30k - 40k:| North Elba: | 8.5% (99) |
| New York: | 4.1% (114,108) |
Number of families with income $40k - 50k:| North Elba: | 9.4% (110) |
| State: | 4.7% (130,902) |
Number of families with income $50k - 60k:| North Elba: | 7.6% (89) |
| State: | 4.9% (135,118) |
Number of families with income $60k - 75k:| North Elba: | 10.7% (124) |
| State: | 7.8% (216,254) |
Number of families with income $75k - 100k:| North Elba: | 16.7% (195) |
| State: | 12.4% (342,382) |
Number of families with income $100k - 125k:| North Elba: | 7.0% (81) |
| State: | 11.4% (314,917) |
Number of families with income $125k - 150k:| North Elba: | 7.5% (88) |
| State: | 9.4% (260,489) |
Number of families with income $150k - 200k:| North Elba: | 6.0% (70) |
| New York: | 13.2% (365,586) |
Number of families with income > $200k:| North Elba: | 12.4% (144) |
| State: | 23.2% (642,319) |
Median non-family income in North Elba in 2022:| North Elba: | $40,181 |
| New York: | $54,783 |
Change in median non-family income between 2000 and 2022:| North Elba, New York: | +83.9% |
| State: | +87.9% |
Median per capita income in North Elba in 2022:| North Elba: | $41,717 |
| State: | $57,640 |
Change in median per capita income between 2000 and 2022:| North Elba, New York: | +111.0% |
| State: | +111.6% |
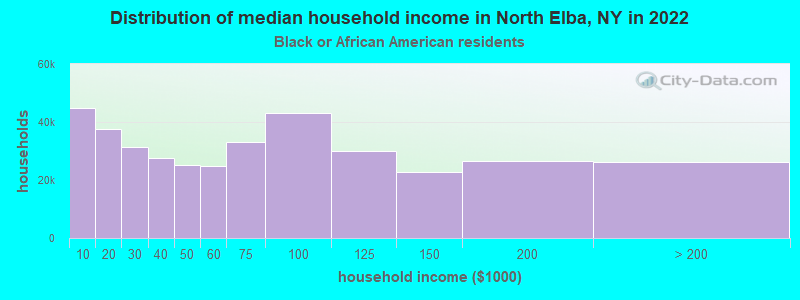
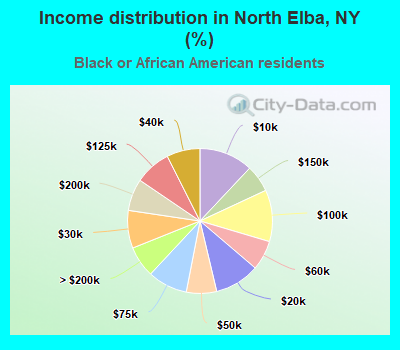
Income statistics for Black or African American residents
Median household income in North Elba, NY in 2022:| North Elba: | $43,791 |
| State: | $57,898 |
Change in median household income between 2000 and 2022:| North Elba, New York: | +100.2% |
| New York: | +84.6% |
Number of households with income < $10k:| North Elba: | 12.0% (44,847) |
| State: | 12.0% (128,500) |
Number of households with income $10k - 20k:| North Elba: | 10.0% (37,494) |
| New York: | 10.0% (107,541) |
Number of households with income $20k - 30k:| North Elba: | 8.4% (31,468) |
| State: | 8.4% (90,192) |
Number of households with income $30k - 40k:| North Elba: | 7.4% (27,734) |
| State: | 7.4% (79,579) |
Number of households with income $40k - 50k:| North Elba: | 6.8% (25,289) |
| State: | 6.8% (72,491) |
Number of households with income $50k - 60k:| North Elba: | 6.6% (24,802) |
| State: | 6.7% (71,309) |
Number of households with income $60k - 75k:| North Elba: | 8.9% (33,158) |
| State: | 8.9% (95,050) |
Number of households with income $75k - 100k:| North Elba: | 11.5% (43,022) |
| State: | 11.5% (123,569) |
Number of households with income $100k - 125k:| North Elba: | 8.1% (30,118) |
| State: | 8.1% (86,632) |
Number of households with income $125k - 150k:| North Elba: | 6.1% (22,596) |
| New York: | 6.0% (64,788) |
Number of households with income $150k - 200k:| North Elba: | 7.1% (26,663) |
| New York: | 7.2% (76,644) |
Number of households with income > $200k:| North Elba: | 7.0% (26,038) |
| New York: | 7.0% (75,062) |
Aggregate household income in North Elba in 2022: $8,912,537
Median family income in North Elba in 2022:| North Elba: | $47,061 |
| State: | $72,528 |
Median non-family income in North Elba in 2022:| North Elba: | $29,416 |
| State: | $37,265 |
Change in median non-family income between 2000 and 2022:| North Elba, New York: | +104.6% |
| New York: | +81.7% |
Median per capita income in North Elba in 2022:| North Elba: | $34,400 |
| State: | $31,947 |
Change in median per capita income between 2000 and 2022:| North Elba, New York: | +99.4% |
| State: | +106.1% |
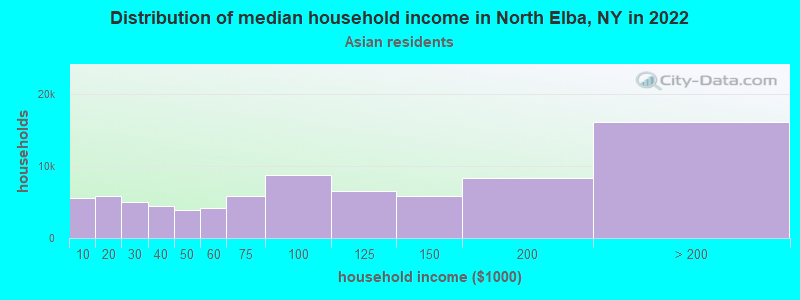
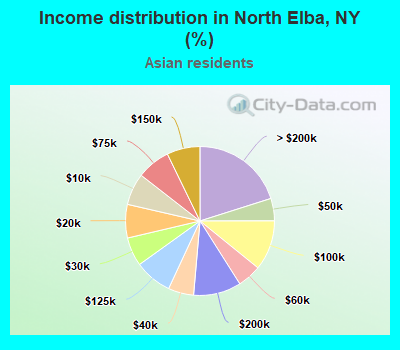
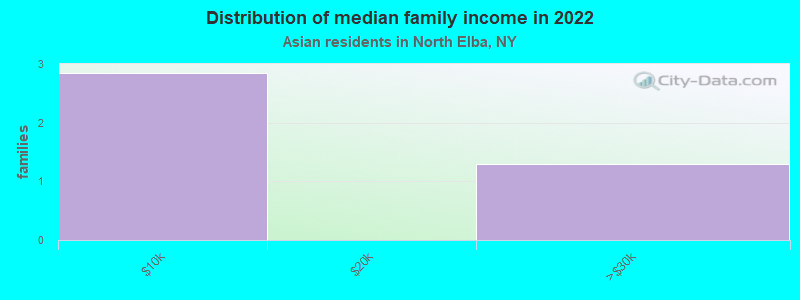
Income statistics for Asian residents
Median household income in North Elba, NY in 2022:| North Elba: | $21,052 |
| New York: | $89,947 |
Change in median household income between 2000 and 2022:| North Elba, New York: | +77.3% |
| New York: | +98.1% |
Number of households with income < $10k:| North Elba: | 6.9% (5,562) |
| New York: | 6.9% (42,537) |
Number of households with income $10k - 20k:| North Elba: | 7.3% (5,852) |
| State: | 7.3% (44,745) |
Number of households with income $20k - 30k:| North Elba: | 6.2% (5,011) |
| New York: | 6.2% (38,249) |
Number of households with income $30k - 40k:| North Elba: | 5.5% (4,445) |
| State: | 5.5% (33,993) |
Number of households with income $40k - 50k:| North Elba: | 4.9% (3,901) |
| State: | 4.8% (29,795) |
Number of households with income $50k - 60k:| North Elba: | 5.2% (4,173) |
| State: | 5.2% (32,100) |
Number of households with income $60k - 75k:| North Elba: | 7.3% (5,831) |
| New York: | 7.3% (44,615) |
Number of households with income $75k - 100k:| North Elba: | 10.9% (8,719) |
| New York: | 10.8% (66,687) |
Number of households with income $100k - 125k:| North Elba: | 8.2% (6,551) |
| State: | 8.2% (50,233) |
Number of households with income $125k - 150k:| North Elba: | 7.2% (5,788) |
| State: | 7.2% (44,299) |
Number of households with income $150k - 200k:| North Elba: | 10.4% (8,328) |
| New York: | 10.4% (63,837) |
Number of households with income > $200k:| North Elba: | 20.1% (16,161) |
| State: | 20.1% (123,891) |
Aggregate household income in North Elba in 2022: $4,098,171
Median family income in North Elba in 2022:| North Elba: | $7,588 |
| State: | $98,136 |
Median non-family income in North Elba in 2022:| North Elba: | $57,033 |
| State: | $63,573 |
Change in median non-family income between 2000 and 2022:| North Elba, New York: | +104.3% |
| State: | +101.1% |
Median per capita income in North Elba in 2022:| North Elba: | $44,462 |
| State: | $46,726 |
Change in median per capita income between 2000 and 2022:| North Elba, New York: | +126.5% |
| New York: | +126.6% |
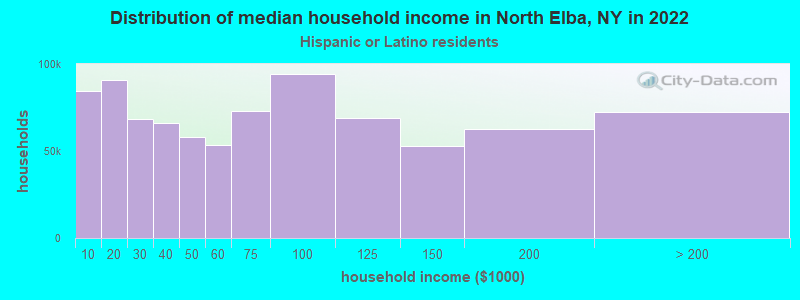
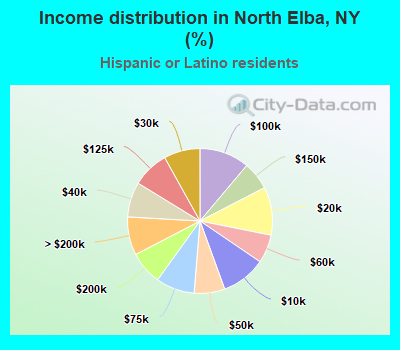
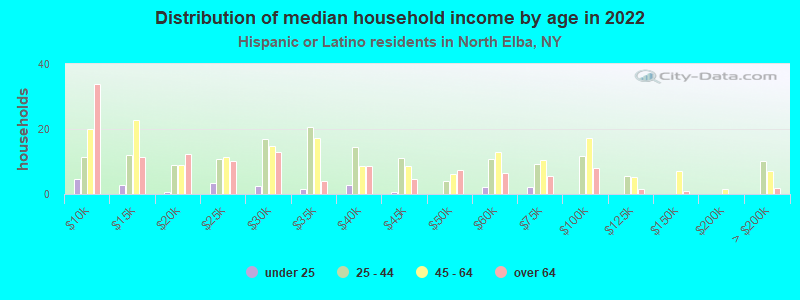
Income statistics for Hispanic or Latino residents
Median household income in North Elba, NY in 2022:| North Elba: | $79,442 |
| State: | $60,468 |
Change in median household income between 2000 and 2022:| North Elba, New York: | +96.6% |
| State: | +98.3% |
Number of households with income < $10k:| North Elba: | 10.0% (84,217) |
| State: | 9.9% (127,185) |
Number of households with income $10k - 20k:| North Elba: | 10.7% (90,657) |
| State: | 10.7% (136,699) |
Number of households with income $20k - 30k:| North Elba: | 8.1% (68,264) |
| State: | 8.1% (102,991) |
Number of households with income $30k - 40k:| North Elba: | 7.8% (66,122) |
| State: | 7.8% (100,149) |
Number of households with income $40k - 50k:| North Elba: | 6.8% (57,852) |
| New York: | 6.9% (87,760) |
Number of households with income $50k - 60k:| North Elba: | 6.3% (53,572) |
| State: | 6.3% (80,968) |
Number of households with income $60k - 75k:| North Elba: | 8.6% (73,019) |
| State: | 8.7% (110,631) |
Number of households with income $75k - 100k:| North Elba: | 11.2% (94,252) |
| State: | 11.2% (142,787) |
Number of households with income $100k - 125k:| North Elba: | 8.2% (69,066) |
| New York: | 8.2% (104,850) |
Number of households with income $125k - 150k:| North Elba: | 6.3% (52,992) |
| State: | 6.3% (80,274) |
Number of households with income $150k - 200k:| North Elba: | 7.4% (62,645) |
| New York: | 7.4% (95,117) |
Number of households with income > $200k:| North Elba: | 8.6% (72,247) |
| State: | 8.6% (109,514) |
Aggregate household income in North Elba in 2022: $17,979,254
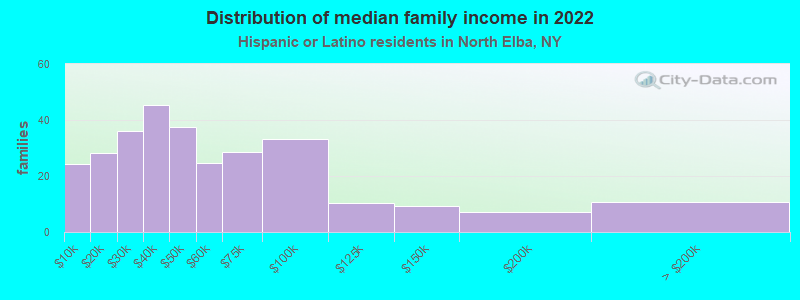
Median family income in North Elba in 2022:| North Elba: | $41,087 |
| New York: | $68,770 |
Number of families with income < $10k:| North Elba: | 8.2% (24) |
| State: | 6.9% (58,565) |
Number of families with income $10k - 20k:| North Elba: | 9.6% (28) |
| State: | 7.0% (59,058) |
Number of families with income $20k - 30k:| North Elba: | 12.2% (36) |
| New York: | 8.0% (68,048) |
Number of families with income $30k - 40k:| North Elba: | 15.4% (46) |
| State: | 8.4% (70,668) |
Number of families with income $40k - 50k:| North Elba: | 12.8% (38) |
| State: | 7.4% (62,941) |
Number of families with income $50k - 60k:| North Elba: | 8.3% (25) |
| New York: | 6.6% (55,592) |
Number of families with income $60k - 75k:| North Elba: | 9.6% (28) |
| State: | 9.3% (78,564) |
Number of families with income $75k - 100k:| North Elba: | 11.2% (33) |
| New York: | 12.6% (106,685) |
Number of families with income $100k - 125k:| North Elba: | 3.5% (10) |
| State: | 9.4% (79,139) |
Number of families with income $125k - 150k:| North Elba: | 3.1% (9) |
| State: | 6.9% (58,255) |
Number of families with income $150k - 200k:| North Elba: | 2.4% (7) |
| State: | 8.3% (69,877) |
Number of families with income > $200k:| North Elba: | 3.6% (11) |
| New York: | 9.3% (78,555) |
Median non-family income in North Elba in 2022:| North Elba: | $70,848 |
| State: | $34,000 |
Change in median non-family income between 2000 and 2022:| North Elba, New York: | +74.7% |
| State: | +93.9% |
Median per capita income in North Elba in 2022:| North Elba: | $41,727 |
| State: | $29,761 |
Change in median per capita income between 2000 and 2022:| North Elba, New York: | +127.3% |
| New York: | +132.7% |
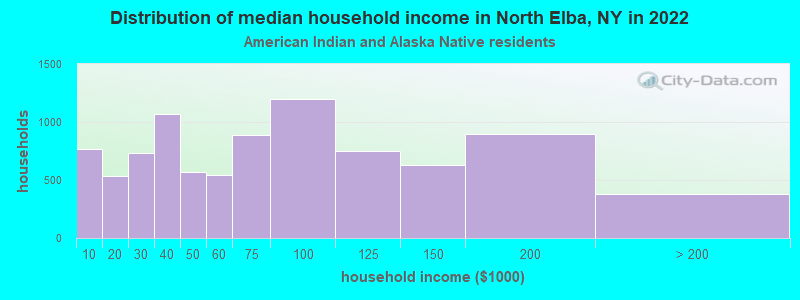
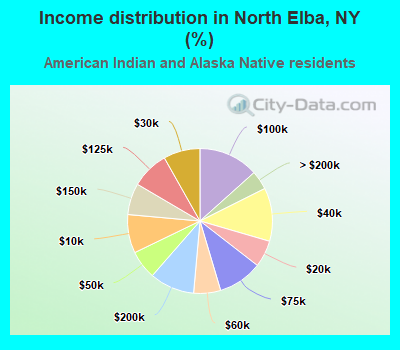
Income statistics for American Indian and Alaska Native residents
Median household income in North Elba, NY in 2022:| North Elba: | $24,604 |
| State: | $63,208 |
Change in median household income between 2000 and 2022:| North Elba, New York: | +90.5% |
| State: | +110.1% |
Number of households with income < $10k:| North Elba: | 8.6% (771) |
| New York: | 8.6% (3,559) |
Number of households with income $10k - 20k:| North Elba: | 6.0% (535) |
| State: | 5.9% (2,455) |
Number of households with income $20k - 30k:| North Elba: | 8.2% (732) |
| New York: | 8.2% (3,393) |
Number of households with income $30k - 40k:| North Elba: | 11.9% (1,066) |
| State: | 11.9% (4,918) |
Number of households with income $40k - 50k:| North Elba: | 6.4% (572) |
| State: | 6.5% (2,682) |
Number of households with income $50k - 60k:| North Elba: | 6.0% (539) |
| State: | 6.1% (2,516) |
Number of households with income $60k - 75k:| North Elba: | 9.9% (886) |
| State: | 10.0% (4,125) |
Number of households with income $75k - 100k:| North Elba: | 13.4% (1,198) |
| State: | 13.3% (5,517) |
Number of households with income $100k - 125k:| North Elba: | 8.4% (748) |
| New York: | 8.4% (3,463) |
Number of households with income $125k - 150k:| North Elba: | 7.0% (629) |
| State: | 7.0% (2,887) |
Number of households with income $150k - 200k:| North Elba: | 10.0% (896) |
| New York: | 9.9% (4,106) |
Number of households with income > $200k:| North Elba: | 4.2% (379) |
| New York: | 4.2% (1,744) |
Aggregate household income in North Elba in 2022: $172,339
Median non-family income in North Elba in 2022:| North Elba: | $23,660 |
| New York: | $33,910 |
Change in median non-family income between 2000 and 2022:| North Elba, New York: | +83.2% |
| New York: | +89.9% |
Median per capita income in North Elba in 2022:| North Elba: | $7,868 |
| State: | $25,837 |
Change in median per capita income between 2000 and 2022:| North Elba, New York: | +75.0% |
| New York: | +99.6% |
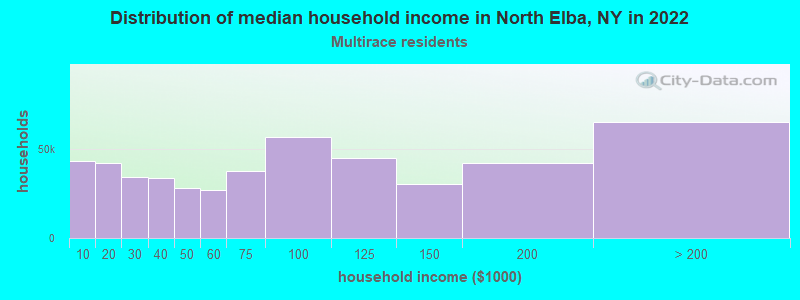
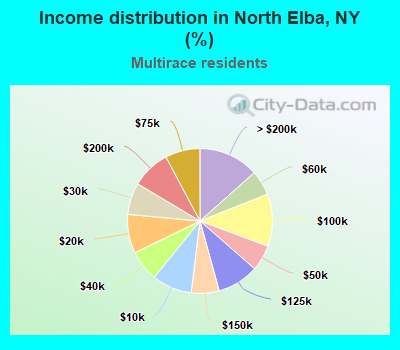
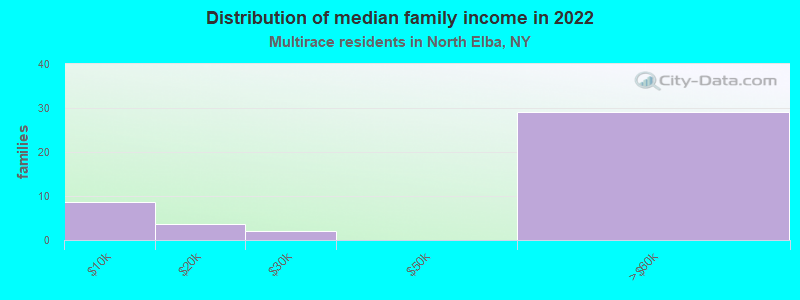
Income statistics for Multirace residents
Median household income in North Elba, NY in 2022:| North Elba: | $105,566 |
| State: | $73,557 |
Change in median household income between 2000 and 2022:| North Elba, New York: | +116.5% |
| State: | +123.9% |
Number of households with income < $10k:| North Elba: | 8.9% (43,031) |
| New York: | 8.9% (57,924) |
Number of households with income $10k - 20k:| North Elba: | 8.7% (41,966) |
| State: | 8.7% (56,590) |
Number of households with income $20k - 30k:| North Elba: | 7.1% (34,303) |
| New York: | 7.1% (46,287) |
Number of households with income $30k - 40k:| North Elba: | 6.9% (33,413) |
| New York: | 6.9% (45,132) |
Number of households with income $40k - 50k:| North Elba: | 5.8% (28,039) |
| State: | 5.8% (37,946) |
Number of households with income $50k - 60k:| North Elba: | 5.6% (26,939) |
| State: | 5.6% (36,410) |
Number of households with income $60k - 75k:| North Elba: | 7.8% (37,578) |
| State: | 7.8% (50,819) |
Number of households with income $75k - 100k:| North Elba: | 11.7% (56,310) |
| State: | 11.7% (76,024) |
Number of households with income $100k - 125k:| North Elba: | 9.3% (44,809) |
| State: | 9.3% (60,635) |
Number of households with income $125k - 150k:| North Elba: | 6.2% (30,025) |
| State: | 6.2% (40,533) |
Number of households with income $150k - 200k:| North Elba: | 8.6% (41,766) |
| New York: | 8.6% (56,409) |
Number of households with income > $200k:| North Elba: | 13.4% (64,841) |
| New York: | 13.4% (87,442) |
Aggregate household income in North Elba in 2022: $27,068,071
Median family income in North Elba in 2022:| North Elba: | $117,624 |
| New York: | $85,788 |
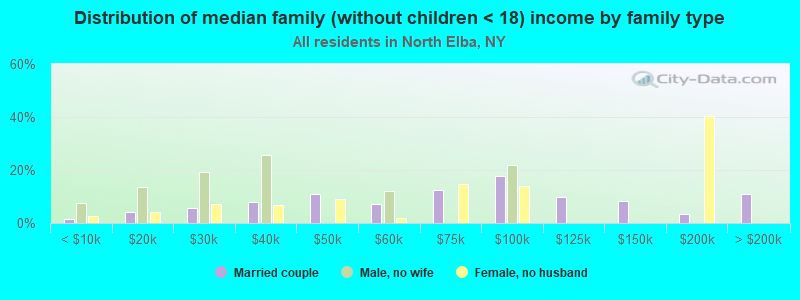
Number of families with income < $10k:| North Elba: | 20.0% (9) |
| State: | 6.2% (24,976) |
Number of families with income $10k - 20k:| North Elba: | 8.4% (4) |
| State: | 5.6% (22,512) |
Number of families with income $20k - 30k:| North Elba: | 4.5% (2) |
| State: | 6.6% (26,534) |
Number of families with income $50k - 60k:| North Elba: | 67.2% (29) |
| New York: | 5.5% (22,002) |
Median non-family income in North Elba in 2022:| North Elba: | $103,827 |
| State: | $46,403 |
Change in median non-family income between 2000 and 2022:| North Elba, New York: | +114.5% |
| State: | +113.6% |
Median per capita income in North Elba in 2022:| North Elba: | $24,373 |
| New York: | $36,931 |
Income statistics for other residents
Number of households with income < $10k:| North Elba: | 10.8% (8) |
| State: | 10.3% (69,252) |
Number of households with income $10k - 20k:| North Elba: | 10.8% (8) |
| New York: | 11.0% (73,890) |
Number of households with income $20k - 30k:| North Elba: | 8.1% (6) |
| State: | 8.8% (59,096) |
Number of households with income $30k - 40k:| North Elba: | 6.8% (5) |
| State: | 8.1% (54,418) |
Number of households with income $40k - 50k:| North Elba: | 6.8% (5) |
| State: | 7.3% (49,042) |
Number of households with income $50k - 60k:| North Elba: | 5.4% (4) |
| State: | 6.5% (43,945) |
Number of households with income $60k - 75k:| North Elba: | 9.5% (7) |
| State: | 9.5% (64,087) |
Number of households with income $75k - 100k:| North Elba: | 10.8% (8) |
| New York: | 10.9% (73,094) |
Number of households with income $100k - 125k:| North Elba: | 9.5% (7) |
| State: | 7.9% (53,055) |
Number of households with income $125k - 150k:| North Elba: | 5.4% (4) |
| State: | 5.9% (39,446) |
Number of households with income $150k - 200k:| North Elba: | 9.5% (7) |
| State: | 7.2% (48,653) |
Number of households with income > $200k:| North Elba: | 6.8% (5) |
| State: | 6.6% (44,703) |
Aggregate household income in North Elba in 2022: $6,266,825
Median non-family income in North Elba in 2022:| North Elba: | $73,129 |
| State: | $26,983 |
Change in median non-family income between 2000 and 2022:| North Elba, New York: | +77.3% |
| State: | +66.4% |
Median per capita income in North Elba in 2022:| North Elba: | $42,441 |
| State: | $26,975 |
Change in median per capita income between 2000 and 2022:| North Elba, New York: | +132.7% |
| State: | +144.6% |