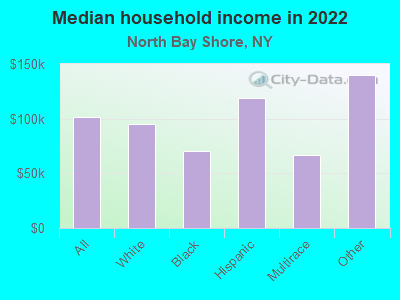
The median household income in North Bay Shore, NY in 2022 was $101,745, which was 21.8% greater than the median annual income of $79,557 across the entire state of New York. Compared to the median income of $55,779 in 2000 this represents an increase of 45.2%. The per capita income in 2022 was $29,478, which means an increase of 42.2% compared to 2000 when it was $17,024.
Whole page based on the data from 2000 / 2022 when the population of North Bay Shore, New York was 14,992 / 18,404
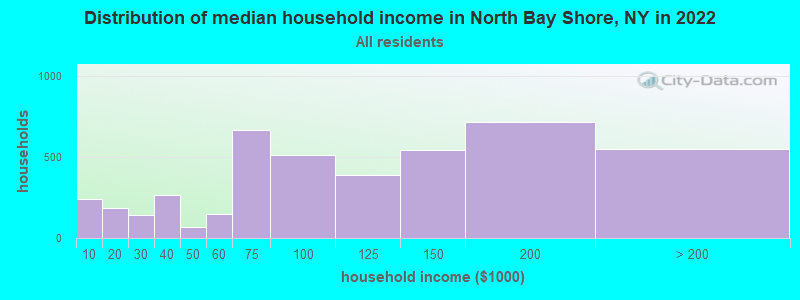
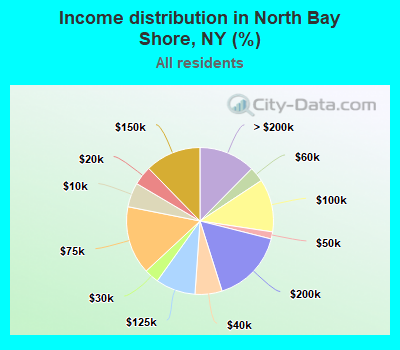
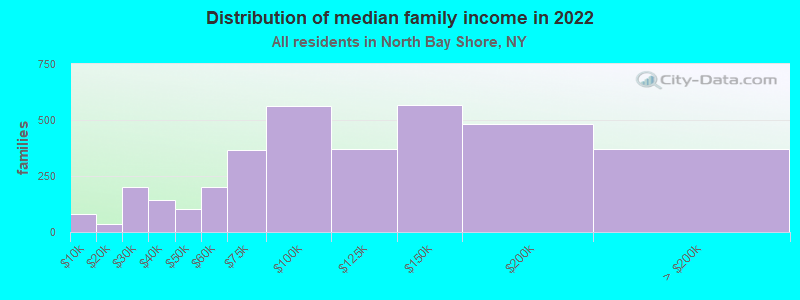
Income statistics for all residents
Median household income in North Bay Shore, NY in 2022:
North Bay Shore:
$101,746
New York:
$79,557
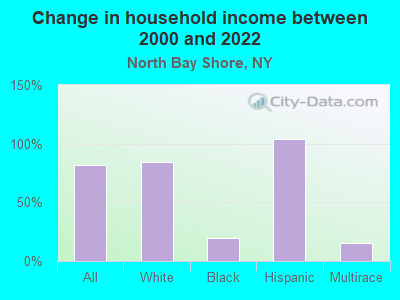
Change in median household income between 2000 and 2022:
North Bay Shore, New York:
+82.4%
State:
+83.3%
Number of households with income < $10k:
North Bay Shore:
5.4% (238)
New York:
6.8% (527,598)
Number of households with income $10k - 20k:
North Bay Shore:
4.2% (186)
State:
7.4% (574,940)
Number of households with income $20k - 30k:
North Bay Shore:
3.2% (142)
State:
6.7% (517,718)
Number of households with income $30k - 40k:
North Bay Shore:
6.0% (264)
New York:
6.5% (506,674)
Number of households with income $40k - 50k:
North Bay Shore:
1.6% (69)
State:
6.1% (470,439)
Number of households with income $50k - 60k:
North Bay Shore:
3.3% (146)
New York:
5.8% (454,042)
Number of households with income $60k - 75k:
North Bay Shore:
15.0% (666)
State:
8.5% (657,508)
Number of households with income $75k - 100k:
North Bay Shore:
11.7% (516)
State:
11.6% (899,824)
Number of households with income $100k - 125k:
North Bay Shore:
8.8% (388)
State:
9.3% (723,825)
Number of households with income $125k - 150k:
North Bay Shore:
12.3% (544)
State:
7.1% (552,420)
Number of households with income $150k - 200k:
North Bay Shore:
16.2% (717)
State:
9.4% (727,051)
Number of households with income > $200k:
North Bay Shore:
12.4% (550)
State:
15.0% (1,162,269)
Aggregate household income in North Bay Shore in 2022: $520,648,584
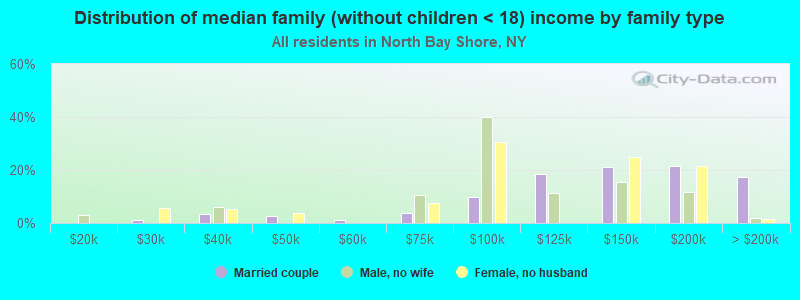
Median family income in North Bay Shore in 2022:
North Bay Shore:
$102,213
New York:
$99,066
Number of families with income < $10k:
North Bay Shore:
2.3% (80)
New York:
4.2% (197,409)
Number of families with income $10k - 20k:
North Bay Shore:
1.0% (35)
State:
4.3% (205,373)
Number of families with income $20k - 30k:
North Bay Shore:
5.8% (203)
State:
5.1% (241,229)
Number of families with income $30k - 40k:
North Bay Shore:
4.2% (145)
New York:
5.5% (259,233)
Number of families with income $40k - 50k:
North Bay Shore:
2.9% (101)
New York:
5.5% (259,113)
Number of families with income $50k - 60k:
North Bay Shore:
5.8% (201)
New York:
5.4% (255,320)
Number of families with income $60k - 75k:
North Bay Shore:
10.5% (367)
State:
8.2% (388,624)
Number of families with income $75k - 100k:
North Bay Shore:
16.1% (562)
New York:
12.3% (583,110)
Number of families with income $100k - 125k:
North Bay Shore:
10.7% (372)
New York:
10.6% (500,579)
Number of families with income $125k - 150k:
North Bay Shore:
16.2% (566)
State:
8.5% (400,594)
Number of families with income $150k - 200k:
North Bay Shore:
13.8% (483)
State:
11.6% (551,650)
Number of families with income > $200k:
North Bay Shore:
10.7% (371)
State:
18.9% (895,998)
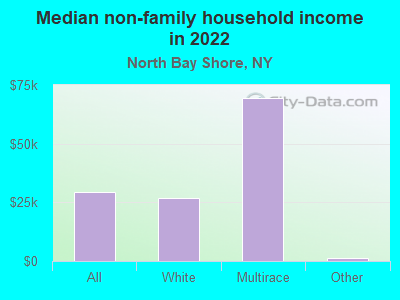
Median non-family income in North Bay Shore in 2022:
North Bay Shore:
$29,346
New York:
$50,181
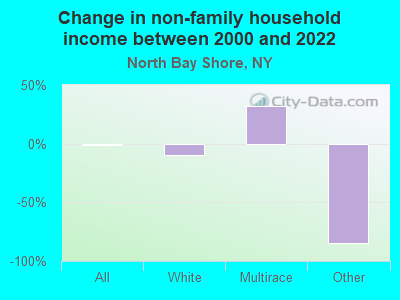
Change in median non-family income between 2000 and 2022:: -1.5%
North Bay Shore, New York:
-1.5%
New York:
+85.4%
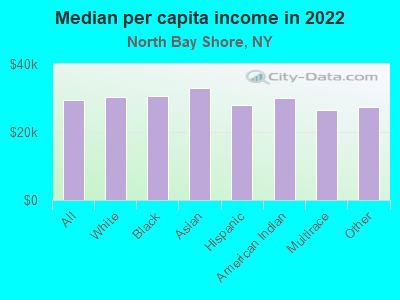
Median per capita income in North Bay Shore in 2022:
North Bay Shore:
$29,478
New York:
$47,421
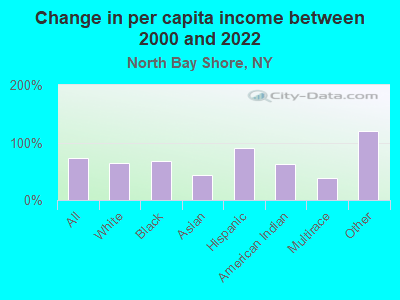
Change in median per capita income between 2000 and 2022:
North Bay Shore, New York:
+73.2%
State:
+102.7%
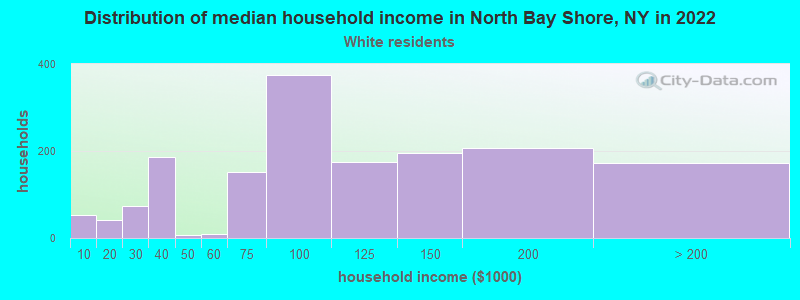
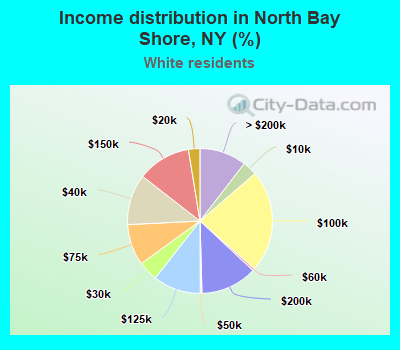
Income statistics for White residents
Median household income in North Bay Shore, NY in 2022:
North Bay Shore:
$94,667
State:
$89,408
Change in median household income between 2000 and 2022:
North Bay Shore, New York:
+83.9%
State:
+85.5%
Number of households with income < $10k:
North Bay Shore:
3.2% (53)
State:
4.8% (225,550)
Number of households with income $10k - 20k:
North Bay Shore:
2.6% (42)
New York:
6.1% (289,425)
Number of households with income $20k - 30k:
North Bay Shore:
4.4% (73)
State:
5.9% (280,254)
Number of households with income $30k - 40k:
North Bay Shore:
11.3% (186)
New York:
6.1% (288,263)
Number of households with income $40k - 50k:
North Bay Shore:
0.4% (6)
New York:
5.9% (278,079)
Number of households with income $50k - 60k:
North Bay Shore:
0.5% (9)
State:
5.7% (267,554)
Number of households with income $60k - 75k:
North Bay Shore:
9.2% (151)
New York:
8.4% (398,344)
Number of households with income $75k - 100k:
North Bay Shore:
22.7% (374)
State:
11.8% (554,841)
Number of households with income $100k - 125k:
North Bay Shore:
10.6% (175)
State:
10.0% (469,794)
Number of households with income $125k - 150k:
North Bay Shore:
11.9% (196)
New York:
7.6% (360,467)
Number of households with income $150k - 200k:
North Bay Shore:
12.6% (207)
State:
10.1% (477,078)
Number of households with income > $200k:
North Bay Shore:
10.5% (172)
State:
17.6% (829,233)
Aggregate household income in North Bay Shore in 2022: $190,648,824
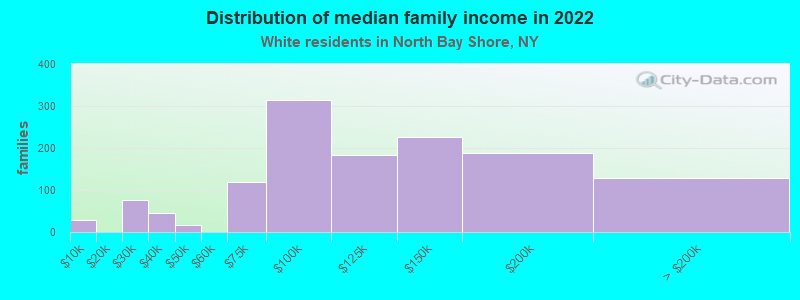
Median family income in North Bay Shore in 2022:
North Bay Shore:
$107,859
New York:
$115,170
Number of families with income < $10k:
North Bay Shore:
2.1% (28)
State:
2.5% (68,851)
Number of families with income $20k - 30k:
North Bay Shore:
5.7% (76)
New York:
3.5% (97,578)
Number of families with income $30k - 40k:
North Bay Shore:
3.5% (46)
State:
4.1% (114,108)
Number of families with income $40k - 50k:
North Bay Shore:
1.3% (17)
State:
4.7% (130,902)
Number of families with income $60k - 75k:
North Bay Shore:
9.0% (120)
State:
7.8% (216,254)
Number of families with income $75k - 100k:
North Bay Shore:
23.7% (314)
State:
12.4% (342,382)
Number of families with income $100k - 125k:
North Bay Shore:
13.8% (183)
State:
11.4% (314,917)
Number of families with income $125k - 150k:
North Bay Shore:
17.1% (227)
State:
9.4% (260,489)
Number of families with income $150k - 200k:
North Bay Shore:
14.1% (187)
State:
13.2% (365,586)
Number of families with income > $200k:
North Bay Shore:
9.7% (129)
New York:
23.2% (642,319)
Median non-family income in North Bay Shore in 2022:
North Bay Shore:
$26,749
New York:
$54,783
Change in median non-family income between 2000 and 2022:: -9.4%
North Bay Shore, New York:
-9.4%
New York:
+87.9%
Median per capita income in North Bay Shore in 2022:
North Bay Shore:
$30,350
New York:
$57,640
Change in median per capita income between 2000 and 2022:
North Bay Shore, New York:
+64.9%
New York:
+111.6%
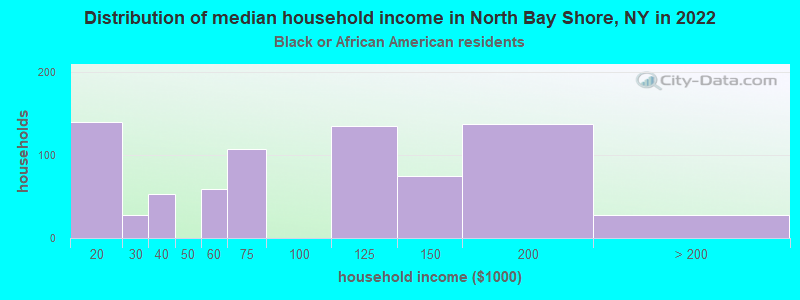
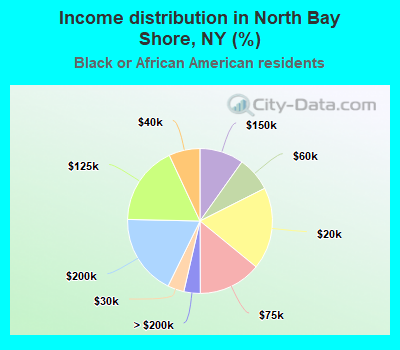
Income statistics for Black or African American residents
Median household income in North Bay Shore, NY in 2022:
North Bay Shore:
$70,495
State:
$57,898
Change in median household income between 2000 and 2022:
North Bay Shore, New York:
+19.8%
New York:
+84.6%
Number of households with income < $10k:
North Bay Shore:
0.0% (0)
New York:
12.0% (128,500)
Number of households with income $10k - 20k:
North Bay Shore:
18.3% (140)
State:
10.0% (107,541)
Number of households with income $20k - 30k:
North Bay Shore:
3.7% (28)
New York:
8.4% (90,192)
Number of households with income $30k - 40k:
North Bay Shore:
6.9% (53)
State:
7.4% (79,579)
Number of households with income $40k - 50k:
North Bay Shore:
0.0% (0)
State:
6.8% (72,491)
Number of households with income $50k - 60k:
North Bay Shore:
7.7% (59)
State:
6.7% (71,309)
Number of households with income $60k - 75k:
North Bay Shore:
14.0% (107)
State:
8.9% (95,050)
Number of households with income $75k - 100k:
North Bay Shore:
0.0% (0)
State:
11.5% (123,569)
Number of households with income $100k - 125k:
North Bay Shore:
17.7% (135)
New York:
8.1% (86,632)
Number of households with income $125k - 150k:
North Bay Shore:
9.8% (75)
New York:
6.0% (64,788)
Number of households with income $150k - 200k:
North Bay Shore:
18.1% (138)
New York:
7.2% (76,644)
Number of households with income > $200k:
North Bay Shore:
3.7% (28)
New York:
7.0% (75,062)
Aggregate household income in North Bay Shore in 2022: $68,405,219
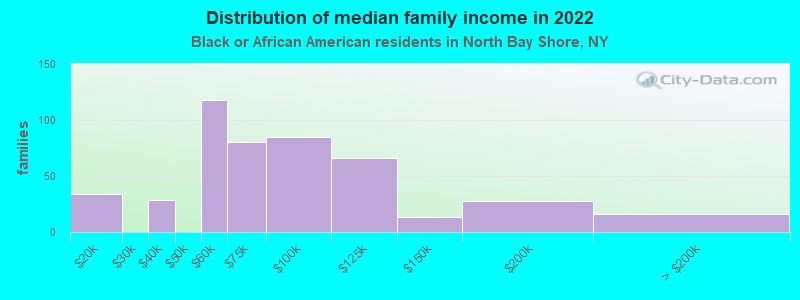
Median family income in North Bay Shore in 2022:
North Bay Shore:
$64,490
State:
$72,528
Number of families with income $10k - 20k:
North Bay Shore:
7.3% (34)
New York:
6.6% (41,506)
Number of families with income $30k - 40k:
North Bay Shore:
6.1% (29)
State:
6.9% (43,353)
Number of families with income $50k - 60k:
North Bay Shore:
25.2% (118)
State:
6.3% (39,748)
Number of families with income $60k - 75k:
North Bay Shore:
17.1% (80)
State:
9.2% (57,626)
Number of families with income $75k - 100k:
North Bay Shore:
18.1% (85)
State:
12.6% (78,986)
Number of families with income $100k - 125k:
North Bay Shore:
14.0% (66)
State:
9.8% (61,670)
Number of families with income $125k - 150k:
North Bay Shore:
2.8% (13)
State:
7.5% (47,050)
Number of families with income $150k - 200k:
North Bay Shore:
6.0% (28)
State:
9.4% (59,260)
Number of families with income > $200k:
North Bay Shore:
3.4% (16)
New York:
9.3% (58,575)
Median per capita income in North Bay Shore in 2022:
North Bay Shore:
$30,665
State:
$31,947
Change in median per capita income between 2000 and 2022:
North Bay Shore, New York:
+68.4%
New York:
+106.1%
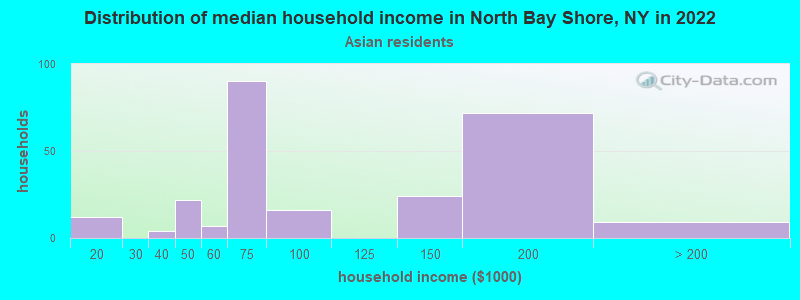
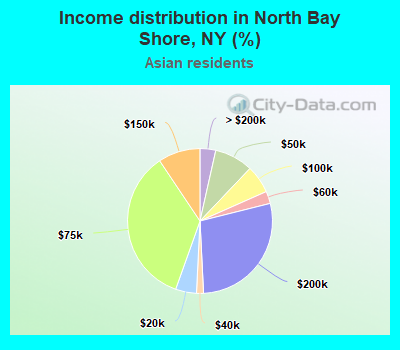
Income statistics for Asian residents
Number of households with income < $10k:
North Bay Shore:
0.0% (0)
State:
6.9% (42,537)
Number of households with income $10k - 20k:
North Bay Shore:
4.7% (12)
New York:
7.3% (44,745)
Number of households with income $20k - 30k:
North Bay Shore:
0.0% (0)
State:
6.2% (38,249)
Number of households with income $30k - 40k:
North Bay Shore:
1.6% (4)
State:
5.5% (33,993)
Number of households with income $40k - 50k:
North Bay Shore:
8.6% (22)
New York:
4.8% (29,795)
Number of households with income $50k - 60k:
North Bay Shore:
2.7% (7)
New York:
5.2% (32,100)
Number of households with income $60k - 75k:
North Bay Shore:
35.2% (90)
State:
7.3% (44,615)
Number of households with income $75k - 100k:
North Bay Shore:
6.2% (16)
State:
10.8% (66,687)
Number of households with income $100k - 125k:
North Bay Shore:
0.0% (0)
New York:
8.2% (50,233)
Number of households with income $125k - 150k:
North Bay Shore:
9.4% (24)
State:
7.2% (44,299)
Number of households with income $150k - 200k:
North Bay Shore:
28.1% (72)
State:
10.4% (63,837)
Number of households with income > $200k:
North Bay Shore:
3.5% (9)
State:
20.1% (123,891)
Aggregate household income in North Bay Shore in 2022: $25,182,902
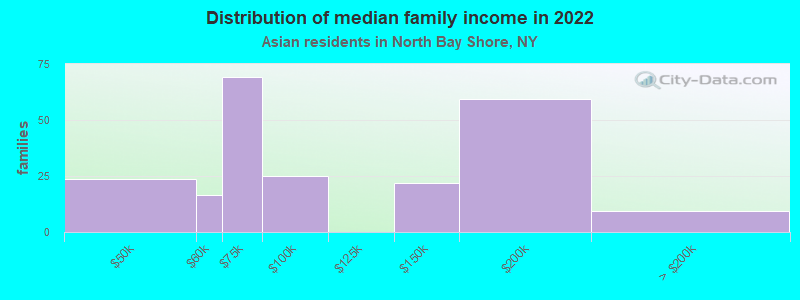
Median family income in North Bay Shore in 2022:
North Bay Shore:
$76,531
New York:
$98,136
Number of families with income $40k - 50k:
North Bay Shore:
10.5% (24)
State:
5.2% (22,750)
Number of families with income $50k - 60k:
North Bay Shore:
7.3% (16)
New York:
5.5% (24,015)
Number of families with income $60k - 75k:
North Bay Shore:
30.7% (69)
State:
7.6% (33,120)
Number of families with income $75k - 100k:
North Bay Shore:
11.1% (25)
State:
10.7% (46,726)
Number of families with income $125k - 150k:
North Bay Shore:
9.8% (22)
State:
7.3% (31,893)
Number of families with income $150k - 200k:
North Bay Shore:
26.5% (60)
New York:
11.0% (48,177)
Number of families with income > $200k:
North Bay Shore:
4.2% (9)
State:
22.2% (97,322)
Median per capita income in North Bay Shore in 2022:
North Bay Shore:
$32,923
State:
$46,726
Change in median per capita income between 2000 and 2022:
North Bay Shore, New York:
+43.7%
New York:
+126.6%
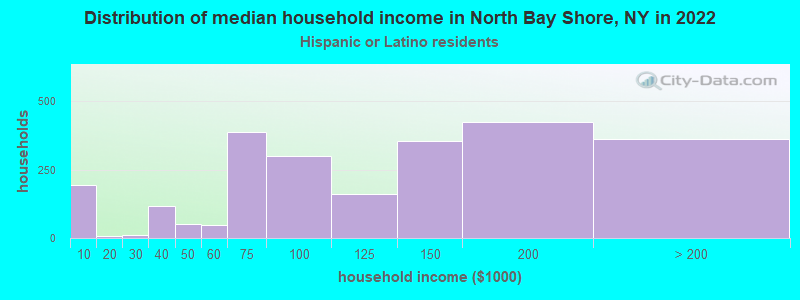
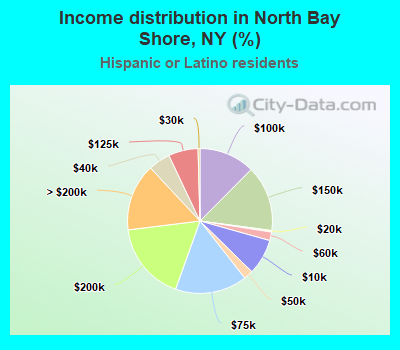
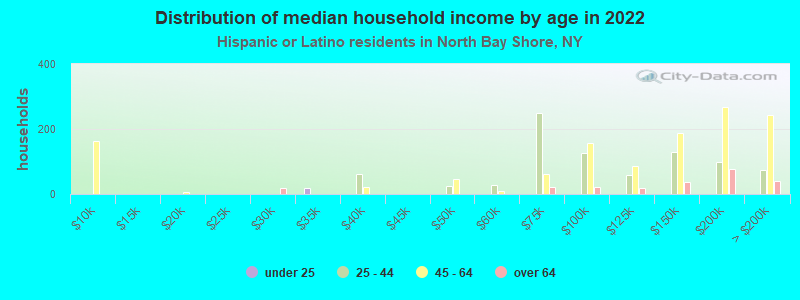
Income statistics for Hispanic or Latino residents
Median household income in North Bay Shore, NY in 2022:
North Bay Shore:
$118,527
New York:
$60,468
Change in median household income between 2000 and 2022:
North Bay Shore, New York:
+103.7%
State:
+98.3%
Number of households with income < $10k:
North Bay Shore:
8.0% (192)
State:
9.9% (127,185)
Number of households with income $10k - 20k:
North Bay Shore:
0.3% (8)
State:
10.7% (136,699)
Number of households with income $20k - 30k:
North Bay Shore:
0.4% (10)
State:
8.1% (102,991)
Number of households with income $30k - 40k:
North Bay Shore:
4.9% (118)
New York:
7.8% (100,149)
Number of households with income $40k - 50k:
North Bay Shore:
2.1% (51)
New York:
6.9% (87,760)
Number of households with income $50k - 60k:
North Bay Shore:
1.9% (46)
State:
6.3% (80,968)
Number of households with income $60k - 75k:
North Bay Shore:
16.0% (387)
New York:
8.7% (110,631)
Number of households with income $75k - 100k:
North Bay Shore:
12.5% (301)
State:
11.2% (142,787)
Number of households with income $100k - 125k:
North Bay Shore:
6.6% (160)
State:
8.2% (104,850)
Number of households with income $125k - 150k:
North Bay Shore:
14.6% (353)
New York:
6.3% (80,274)
Number of households with income $150k - 200k:
North Bay Shore:
17.6% (424)
State:
7.4% (95,117)
Number of households with income > $200k:
North Bay Shore:
15.0% (362)
State:
8.6% (109,514)
Aggregate household income in North Bay Shore in 2022: $309,126,114
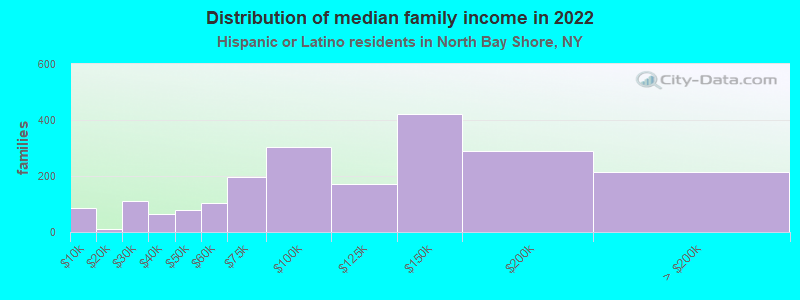
Median family income in North Bay Shore in 2022:
North Bay Shore:
$109,572
State:
$68,770
Number of families with income < $10k:
North Bay Shore:
4.1% (84)
State:
6.9% (58,565)
Number of families with income $10k - 20k:
North Bay Shore:
0.5% (10)
State:
7.0% (59,058)
Number of families with income $20k - 30k:
North Bay Shore:
5.4% (111)
State:
8.0% (68,048)
Number of families with income $30k - 40k:
North Bay Shore:
3.2% (66)
State:
8.4% (70,668)
Number of families with income $40k - 50k:
North Bay Shore:
3.9% (80)
State:
7.4% (62,941)
Number of families with income $50k - 60k:
North Bay Shore:
5.1% (104)
State:
6.6% (55,592)
Number of families with income $60k - 75k:
North Bay Shore:
9.5% (195)
State:
9.3% (78,564)
Number of families with income $75k - 100k:
North Bay Shore:
14.8% (305)
State:
12.6% (106,685)
Number of families with income $100k - 125k:
North Bay Shore:
8.4% (173)
New York:
9.4% (79,139)
Number of families with income $125k - 150k:
North Bay Shore:
20.5% (421)
State:
6.9% (58,255)
Number of families with income $150k - 200k:
North Bay Shore:
14.2% (291)
New York:
8.3% (69,877)
Number of families with income > $200k:
North Bay Shore:
10.5% (216)
State:
9.3% (78,555)
Median per capita income in North Bay Shore in 2022:
North Bay Shore:
$27,980
New York:
$29,761
Change in median per capita income between 2000 and 2022:
North Bay Shore, New York:
+91.4%
State:
+132.7%
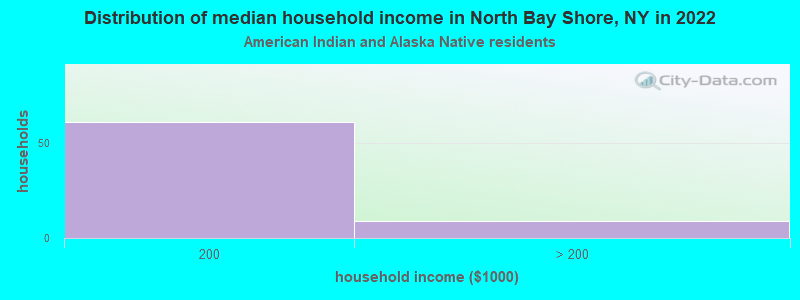
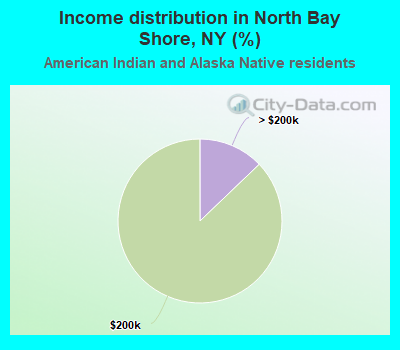
Income statistics for American Indian and Alaska Native residents
Number of households with income < $10k:
North Bay Shore:
0.0% (0)
State:
8.6% (3,559)
Number of households with income $10k - 20k:
North Bay Shore:
0.0% (0)
State:
5.9% (2,455)
Number of households with income $20k - 30k:
North Bay Shore:
0.0% (0)
State:
8.2% (3,393)
Number of households with income $30k - 40k:
North Bay Shore:
0.0% (0)
State:
11.9% (4,918)
Number of households with income $40k - 50k:
North Bay Shore:
0.0% (0)
State:
6.5% (2,682)
Number of households with income $50k - 60k:
North Bay Shore:
0.0% (0)
New York:
6.1% (2,516)
Number of households with income $60k - 75k:
North Bay Shore:
0.0% (0)
State:
10.0% (4,125)
Number of households with income $75k - 100k:
North Bay Shore:
0.0% (0)
State:
13.3% (5,517)
Number of households with income $100k - 125k:
North Bay Shore:
0.0% (0)
State:
8.4% (3,463)
Number of households with income $125k - 150k:
North Bay Shore:
0.0% (0)
State:
7.0% (2,887)
Number of households with income $150k - 200k:
North Bay Shore:
87.1% (61)
State:
9.9% (4,106)
Number of households with income > $200k:
North Bay Shore:
12.9% (9)
State:
4.2% (1,744)
Aggregate household income in North Bay Shore in 2022: $8,670,500
Median per capita income in North Bay Shore in 2022:
North Bay Shore:
$30,126
New York:
$25,837
Change in median per capita income between 2000 and 2022:
North Bay Shore, New York:
+62.7%
State:
+99.6%
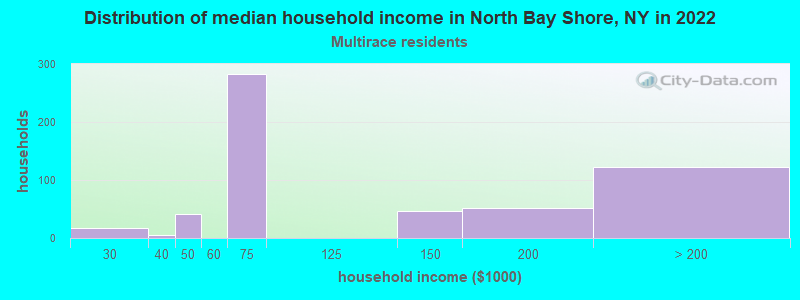
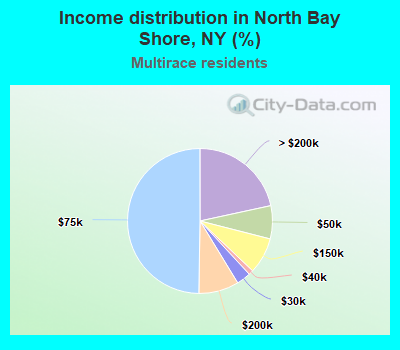
Income statistics for Multirace residents
Median household income in North Bay Shore, NY in 2022:
North Bay Shore:
$66,332
State:
$73,557
Change in median household income between 2000 and 2022:
North Bay Shore, New York:
+14.6%
State:
+123.9%
Number of households with income < $10k:
North Bay Shore:
0.0% (0)
State:
8.9% (57,924)
Number of households with income $10k - 20k:
North Bay Shore:
0.0% (0)
State:
8.7% (56,590)
Number of households with income $20k - 30k:
North Bay Shore:
3.2% (18)
New York:
7.1% (46,287)
Number of households with income $30k - 40k:
North Bay Shore:
1.1% (6)
State:
6.9% (45,132)
Number of households with income $40k - 50k:
North Bay Shore:
7.4% (42)
State:
5.8% (37,946)
Number of households with income $50k - 60k:
North Bay Shore:
0.0% (0)
State:
5.6% (36,410)
Number of households with income $60k - 75k:
North Bay Shore:
49.7% (283)
State:
7.8% (50,819)
Number of households with income $75k - 100k:
North Bay Shore:
0.0% (0)
State:
11.7% (76,024)
Number of households with income $100k - 125k:
North Bay Shore:
0.0% (0)
New York:
9.3% (60,635)
Number of households with income $125k - 150k:
North Bay Shore:
8.1% (46)
New York:
6.2% (40,533)
Number of households with income $150k - 200k:
North Bay Shore:
9.0% (51)
State:
8.6% (56,409)
Number of households with income > $200k:
North Bay Shore:
21.6% (123)
New York:
13.4% (87,442)
Aggregate household income in North Bay Shore in 2022: $88,654,700
Median non-family income in North Bay Shore in 2022:
North Bay Shore:
$69,320
State:
$46,403
Change in median non-family income between 2000 and 2022:
North Bay Shore, New York:
+32.0%
New York:
+113.6%
Median per capita income in North Bay Shore in 2022:
North Bay Shore:
$26,440
State:
$36,931
Change in median per capita income between 2000 and 2022:
North Bay Shore, New York:
+39.0%
State:
+158.8%
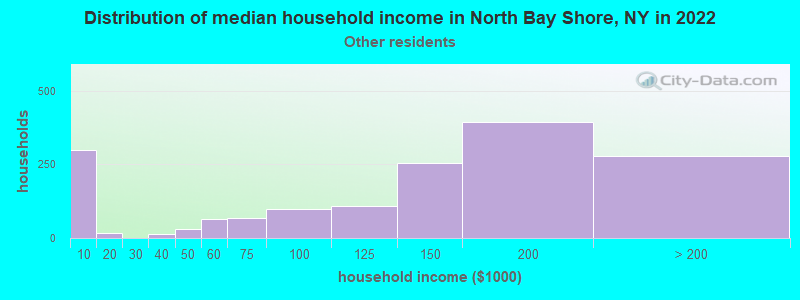
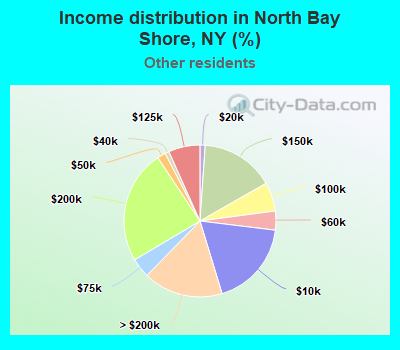
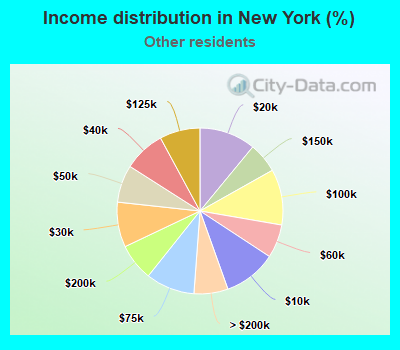
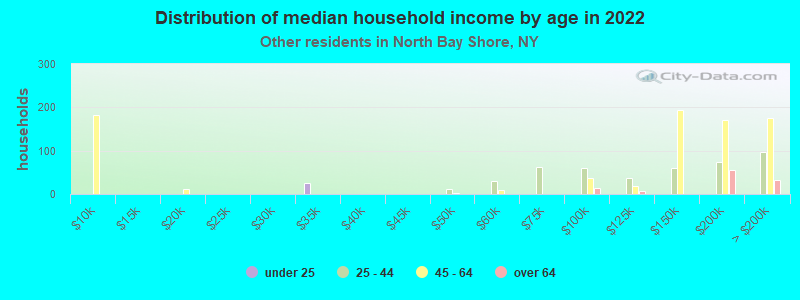
Income statistics for other residents
Median household income in North Bay Shore, NY in 2022:
North Bay Shore:
$139,768
State:
$56,210
Number of households with income < $10k:
North Bay Shore:
18.4% (299)
New York:
10.3% (69,252)
Number of households with income $10k - 20k:
North Bay Shore:
1.1% (18)
State:
11.0% (73,890)
Number of households with income $20k - 30k:
North Bay Shore:
0.0% (0)
State:
8.8% (59,096)
Number of households with income $30k - 40k:
North Bay Shore:
0.9% (14)
New York:
8.1% (54,418)
Number of households with income $40k - 50k:
North Bay Shore:
1.8% (29)
State:
7.3% (49,042)
Number of households with income $50k - 60k:
North Bay Shore:
4.1% (66)
State:
6.5% (43,945)
Number of households with income $60k - 75k:
North Bay Shore:
4.2% (68)
State:
9.5% (64,087)
Number of households with income $75k - 100k:
North Bay Shore:
6.1% (100)
State:
10.9% (73,094)
Number of households with income $100k - 125k:
North Bay Shore:
6.7% (109)
State:
7.9% (53,055)
Number of households with income $125k - 150k:
North Bay Shore:
15.7% (255)
State:
5.9% (39,446)
Number of households with income $150k - 200k:
North Bay Shore:
24.2% (394)
State:
7.2% (48,653)
Number of households with income > $200k:
North Bay Shore:
17.0% (277)
State:
6.6% (44,703)
Aggregate household income in North Bay Shore in 2022: $208,824,686
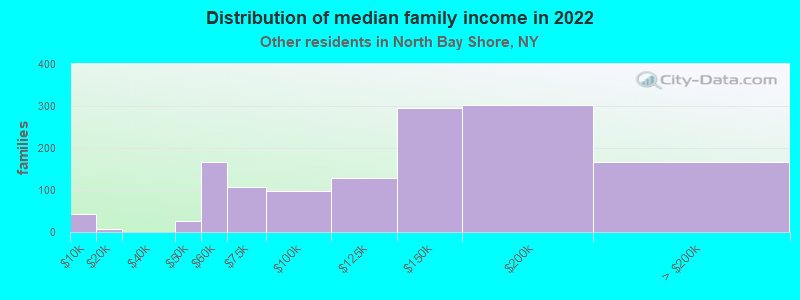
Median family income in North Bay Shore in 2022:
North Bay Shore:
$138,606
State:
$63,465
Number of families with income < $10k:
North Bay Shore:
3.3% (44)
New York:
6.2% (29,008)
Number of families with income $10k - 20k:
North Bay Shore:
0.5% (7)
State:
7.4% (34,598)
Number of families with income $40k - 50k:
North Bay Shore:
2.0% (27)
State:
7.8% (36,771)
Number of families with income $50k - 60k:
North Bay Shore:
12.5% (167)
State:
7.1% (33,324)
Number of families with income $60k - 75k:
North Bay Shore:
7.9% (107)
State:
10.1% (47,546)
Number of families with income $75k - 100k:
North Bay Shore:
7.3% (98)
New York:
12.5% (58,659)
Number of families with income $100k - 125k:
North Bay Shore:
9.6% (129)
State:
8.6% (40,211)
Number of families with income $125k - 150k:
North Bay Shore:
21.9% (295)
State:
6.5% (30,363)
Number of families with income $150k - 200k:
North Bay Shore:
22.6% (303)
New York:
7.9% (37,167)
Number of families with income > $200k:
North Bay Shore:
12.4% (166)
State:
7.2% (33,950)
Median non-family income in North Bay Shore in 2022:
North Bay Shore:
$1,490
State:
$26,983
Change in median non-family income between 2000 and 2022:: -84.8%
North Bay Shore, New York:
-84.8%
New York:
+66.4%
Median per capita income in North Bay Shore in 2022:
North Bay Shore:
$27,377
New York:
$26,975
Change in median per capita income between 2000 and 2022:
North Bay Shore, New York:
+120.5%
State:
+144.6%
Discuss North Bay Shore, New York (NY) on our hugely popular New York forum.