Medway, Massachusetts (MA) income map, earnings map, and wages data
The median household income in Medway, MA in 2022 was $137,364, which was 31.2% greater than the median annual income of $94,488 across the entire state of Massachusetts. Compared to the median income of $75,135 in 2000 this represents an increase of 45.3%. The per capita income in 2022 was $56,173, which means an increase of 50.9% compared to 2000 when it was $27,578.
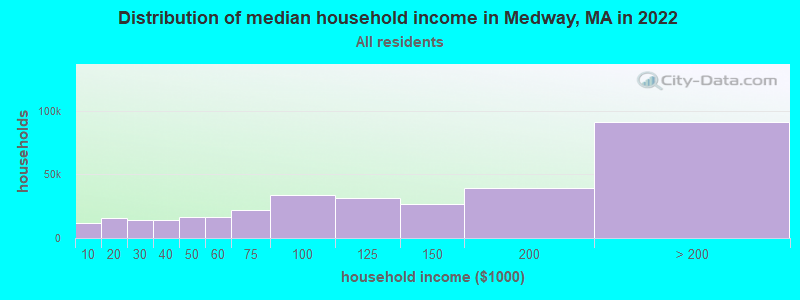
Income statistics for all residents
Median household income in Medway, MA in 2022:| Medway: | $137,365 |
| Massachusetts: | $94,488 |
Change in median household income between 2000 and 2022:| Medway, Massachusetts: | +82.8% |
| Massachusetts: | +87.1% |
Number of households with income < $10k:| Medway: | 3.6% (11,872) |
| State: | 5.2% (146,170) |
Number of households with income $10k - 20k:| Medway: | 4.8% (15,949) |
| Massachusetts: | 6.4% (180,001) |
Number of households with income $20k - 30k:| Medway: | 4.3% (14,386) |
| State: | 5.6% (156,667) |
Number of households with income $30k - 40k:| Medway: | 4.2% (14,084) |
| Massachusetts: | 5.6% (157,168) |
Number of households with income $40k - 50k:| Medway: | 5.0% (16,741) |
| Massachusetts: | 5.4% (151,455) |
Number of households with income $50k - 60k:| Medway: | 5.0% (16,622) |
| State: | 5.1% (142,726) |
Number of households with income $60k - 75k:| Medway: | 6.6% (21,944) |
| Massachusetts: | 7.6% (212,203) |
Number of households with income $75k - 100k:| Medway: | 10.1% (33,711) |
| Massachusetts: | 11.3% (317,064) |
Number of households with income $100k - 125k:| Medway: | 9.5% (31,769) |
| Massachusetts: | 9.7% (270,603) |
Number of households with income $125k - 150k:| Medway: | 7.9% (26,423) |
| Massachusetts: | 8.0% (223,140) |
Number of households with income $150k - 200k:| Medway: | 11.7% (39,158) |
| Massachusetts: | 11.0% (308,695) |
Number of households with income > $200k:| Medway: | 27.3% (91,177) |
| Massachusetts: | 19.0% (531,884) |
Aggregate household income in Medway in 2022: $7,560,935,158
Median family income in Medway in 2022:| Medway: | $169,290 |
| State: | $120,263 |
Median non-family income in Medway in 2022:| Medway: | $53,566 |
| State: | $55,979 |
Change in median non-family income between 2000 and 2022:| Medway, Massachusetts: | +73.0% |
| State: | +88.0% |
Median per capita income in Medway in 2022:| Medway: | $56,173 |
| State: | $54,025 |
Change in median per capita income between 2000 and 2022:| Medway, Massachusetts: | +103.7% |
| State: | +108.2% |
Income statistics for White residents
Median household income in Medway, MA in 2022:| Medway: | $139,530 |
| State: | $101,391 |
Change in median household income between 2000 and 2022:| Medway, Massachusetts: | +85.3% |
| State: | +93.3% |
Number of households with income < $10k:| Medway: | 3.3% (8,070) |
| Massachusetts: | 4.4% (91,120) |
Number of households with income $10k - 20k:| Medway: | 4.7% (11,506) |
| State: | 5.9% (122,055) |
Number of households with income $20k - 30k:| Medway: | 4.3% (10,637) |
| State: | 5.1% (105,311) |
Number of households with income $30k - 40k:| Medway: | 4.2% (10,414) |
| State: | 5.3% (110,239) |
Number of households with income $40k - 50k:| Medway: | 5.3% (13,027) |
| State: | 5.0% (104,636) |
Number of households with income $50k - 60k:| Medway: | 4.5% (11,071) |
| State: | 4.8% (99,486) |
Number of households with income $60k - 75k:| Medway: | 6.2% (15,328) |
| State: | 7.5% (155,124) |
Number of households with income $75k - 100k:| Medway: | 10.2% (25,076) |
| State: | 11.4% (236,252) |
Number of households with income $100k - 125k:| Medway: | 9.2% (22,645) |
| State: | 9.9% (204,731) |
Number of households with income $125k - 150k:| Medway: | 8.2% (20,216) |
| Massachusetts: | 8.5% (175,324) |
Number of households with income $150k - 200k:| Medway: | 11.7% (28,880) |
| State: | 11.7% (242,980) |
Number of households with income > $200k:| Medway: | 28.4% (70,014) |
| State: | 20.5% (425,966) |
Aggregate household income in Medway in 2022: $5,708,312,830
Median family income in Medway in 2022:| Medway: | $175,631 |
| Massachusetts: | $133,153 |
Number of families with income < $10k:| Medway: | 0.9% (22) |
| State: | 2.0% (25,038) |
Number of families with income $10k - 20k:| Medway: | 1.1% (25) |
| Massachusetts: | 2.1% (26,403) |
Number of families with income $20k - 30k:| Medway: | 1.1% (26) |
| State: | 2.6% (32,525) |
Number of families with income $30k - 40k:| Medway: | 2.7% (64) |
| Massachusetts: | 3.9% (48,079) |
Number of families with income $40k - 50k:| Medway: | 2.4% (58) |
| State: | 3.8% (46,908) |
Number of families with income $50k - 60k:| Medway: | 5.0% (121) |
| State: | 3.8% (46,476) |
Number of families with income $60k - 75k:| Medway: | 4.2% (102) |
| State: | 6.4% (79,040) |
Number of families with income $75k - 100k:| Medway: | 13.8% (333) |
| Massachusetts: | 11.1% (137,395) |
Number of families with income $100k - 125k:| Medway: | 15.5% (375) |
| State: | 11.1% (136,771) |
Number of families with income $125k - 150k:| Medway: | 13.4% (325) |
| State: | 10.0% (123,709) |
Number of families with income $150k - 200k:| Medway: | 15.7% (381) |
| State: | 14.7% (181,602) |
Number of families with income > $200k:| Medway: | 24.2% (586) |
| Massachusetts: | 28.5% (351,887) |
Median non-family income in Medway in 2022:| Medway: | $53,929 |
| State: | $59,323 |
Change in median non-family income between 2000 and 2022:| Medway, Massachusetts: | +73.0% |
| State: | +94.3% |
Median per capita income in Medway in 2022:| Medway: | $59,074 |
| State: | $60,804 |
Change in median per capita income between 2000 and 2022:| Medway, Massachusetts: | +114.1% |
| Massachusetts: | +118.7% |
Income statistics for Black or African American residents
Median household income in Medway, MA in 2022:| Medway: | $57,472 |
| State: | $63,189 |
Change in median household income between 2000 and 2022:| Medway, Massachusetts: | +58.5% |
| State: | +87.4% |
Number of households with income < $10k:| Medway: | 5.5% (574) |
| State: | 9.1% (15,797) |
Number of households with income $10k - 20k:| Medway: | 7.2% (757) |
| Massachusetts: | 9.4% (16,267) |
Number of households with income $20k - 30k:| Medway: | 4.9% (515) |
| State: | 7.8% (13,520) |
Number of households with income $30k - 40k:| Medway: | 6.6% (688) |
| State: | 8.3% (14,412) |
Number of households with income $40k - 50k:| Medway: | 6.1% (642) |
| State: | 7.9% (13,790) |
Number of households with income $50k - 60k:| Medway: | 5.7% (598) |
| State: | 5.8% (10,041) |
Number of households with income $60k - 75k:| Medway: | 8.6% (902) |
| Massachusetts: | 8.5% (14,822) |
Number of households with income $75k - 100k:| Medway: | 8.7% (909) |
| Massachusetts: | 11.0% (19,122) |
Number of households with income $100k - 125k:| Medway: | 14.7% (1,539) |
| Massachusetts: | 8.4% (14,575) |
Number of households with income $125k - 150k:| Medway: | 11.1% (1,165) |
| State: | 6.0% (10,429) |
Number of households with income $150k - 200k:| Medway: | 7.6% (800) |
| Massachusetts: | 7.2% (12,539) |
Number of households with income > $200k:| Medway: | 13.4% (1,406) |
| State: | 10.5% (18,185) |
Aggregate household income in Medway in 2022: $1,136,306
Median family income in Medway in 2022:| Medway: | $55,464 |
| Massachusetts: | $79,815 |
Number of families with income $30k - 40k:| Medway: | 100.0% (17) |
| Massachusetts: | 6.4% (7,002) |
Median per capita income in Medway in 2022:| Medway: | $33,776 |
| Massachusetts: | $33,524 |
Change in median per capita income between 2000 and 2022:| Medway, Massachusetts: | +73.4% |
| State: | +109.4% |
Income statistics for Asian residents
Median household income in Medway, MA in 2022:| Medway: | $369,588 |
| Massachusetts: | $117,855 |
Change in median household income between 2000 and 2022:| Medway, Massachusetts: | +110.7% |
| State: | +129.9% |
Number of households with income < $10k:| Medway: | 3.4% (3,008) |
| Massachusetts: | 6.8% (11,982) |
Number of households with income $10k - 20k:| Medway: | 4.3% (3,842) |
| State: | 4.8% (8,376) |
Number of households with income $20k - 30k:| Medway: | 3.1% (2,769) |
| Massachusetts: | 3.7% (6,558) |
Number of households with income $30k - 40k:| Medway: | 4.0% (3,551) |
| Massachusetts: | 3.3% (5,748) |
Number of households with income $40k - 50k:| Medway: | 4.4% (3,924) |
| State: | 4.1% (7,192) |
Number of households with income $50k - 60k:| Medway: | 6.7% (5,913) |
| Massachusetts: | 5.0% (8,734) |
Number of households with income $60k - 75k:| Medway: | 8.2% (7,266) |
| State: | 5.8% (10,203) |
Number of households with income $75k - 100k:| Medway: | 7.5% (6,674) |
| State: | 8.6% (15,154) |
Number of households with income $100k - 125k:| Medway: | 7.0% (6,217) |
| Massachusetts: | 10.8% (18,942) |
Number of households with income $125k - 150k:| Medway: | 7.6% (6,749) |
| State: | 8.0% (14,037) |
Number of households with income $150k - 200k:| Medway: | 14.8% (13,184) |
| State: | 12.5% (21,856) |
Number of households with income > $200k:| Medway: | 29.0% (25,751) |
| State: | 26.6% (46,694) |
Aggregate household income in Medway in 2022: $10,691,197
Median family income in Medway in 2022:| Medway: | $393,077 |
| Massachusetts: | $140,113 |
Number of families with income $20k - 30k:| Medway: | 9.0% (7) |
| State: | 2.3% (2,708) |
Number of families with income $150k - 200k:| Medway: | 91.0% (70) |
| Massachusetts: | 13.2% (15,478) |
Median per capita income in Medway in 2022:| Medway: | $119,377 |
| State: | $58,900 |
Change in median per capita income between 2000 and 2022:| Medway, Massachusetts: | +141.2% |
| State: | +174.6% |
Income statistics for Hispanic or Latino residents
Median household income in Medway, MA in 2022:| Medway: | $83,149 |
| Massachusetts: | $61,523 |
Change in median household income between 2000 and 2022:| Medway, Massachusetts: | +79.8% |
| State: | +125.4% |
Number of households with income < $10k:| Medway: | 4.4% (461) |
| State: | 8.8% (25,307) |
Number of households with income $10k - 20k:| Medway: | 4.5% (471) |
| Massachusetts: | 10.0% (28,653) |
Number of households with income $20k - 30k:| Medway: | 4.8% (499) |
| State: | 8.8% (25,189) |
Number of households with income $30k - 40k:| Medway: | 3.9% (403) |
| Massachusetts: | 7.2% (20,822) |
Number of households with income $40k - 50k:| Medway: | 3.2% (335) |
| State: | 7.2% (20,817) |
Number of households with income $50k - 60k:| Medway: | 5.7% (601) |
| State: | 6.5% (18,748) |
Number of households with income $60k - 75k:| Medway: | 11.5% (1,200) |
| Massachusetts: | 8.8% (25,390) |
Number of households with income $75k - 100k:| Medway: | 12.4% (1,299) |
| Massachusetts: | 12.0% (34,488) |
Number of households with income $100k - 125k:| Medway: | 11.8% (1,234) |
| State: | 8.6% (24,599) |
Number of households with income $125k - 150k:| Medway: | 4.2% (438) |
| Massachusetts: | 6.2% (17,743) |
Number of households with income $150k - 200k:| Medway: | 13.9% (1,457) |
| State: | 7.3% (21,017) |
Number of households with income > $200k:| Medway: | 19.7% (2,058) |
| State: | 8.6% (24,606) |
Aggregate household income in Medway in 2022: $3,489,284
Median non-family income in Medway in 2022:| Medway: | $61,427 |
| State: | $37,563 |
Change in median non-family income between 2000 and 2022:| Medway, Massachusetts: | +32.8% |
| Massachusetts: | +115.0% |
Median per capita income in Medway in 2022:| Medway: | $42,644 |
| State: | $28,993 |
Change in median per capita income between 2000 and 2022:| Medway, Massachusetts: | +100.6% |
| State: | +142.4% |
Income statistics for American Indian and Alaska Native residents
Median household income in Medway, MA in 2022:| Medway: | $298,710 |
| State: | $87,730 |
Change in median household income between 2000 and 2022:| Medway, Massachusetts: | +134.6% |
| Massachusetts: | +138.3% |
Number of households with income < $10k:| Medway: | 6.6% (1,560) |
| State: | 6.6% (451) |
Number of households with income $10k - 20k:| Medway: | 7.0% (1,646) |
| State: | 7.0% (476) |
Number of households with income $20k - 30k:| Medway: | 2.8% (664) |
| Massachusetts: | 2.8% (192) |
Number of households with income $30k - 40k:| Medway: | 3.2% (754) |
| State: | 3.2% (218) |
Number of households with income $40k - 50k:| Medway: | 2.9% (688) |
| State: | 2.9% (199) |
Number of households with income $50k - 60k:| Medway: | 9.9% (2,341) |
| State: | 9.9% (677) |
Number of households with income $60k - 75k:| Medway: | 11.5% (2,701) |
| State: | 11.5% (781) |
Number of households with income $75k - 100k:| Medway: | 9.2% (2,175) |
| State: | 9.2% (629) |
Number of households with income $100k - 125k:| Medway: | 6.0% (1,404) |
| State: | 6.0% (406) |
Number of households with income $125k - 150k:| Medway: | 13.5% (3,185) |
| State: | 13.5% (921) |
Number of households with income $150k - 200k:| Medway: | 12.6% (2,971) |
| State: | 12.6% (859) |
Number of households with income > $200k:| Medway: | 14.7% (3,469) |
| Massachusetts: | 14.7% (1,003) |
Aggregate household income in Medway in 2022: $3,085,880
Median per capita income in Medway in 2022:| Medway: | $138,405 |
| State: | $39,434 |
Change in median per capita income between 2000 and 2022:| Medway, Massachusetts: | +140.2% |
| State: | +148.2% |
Income statistics for Multirace residents
Median household income in Medway, MA in 2022:| Medway: | $229,009 |
| Massachusetts: | $71,552 |
Number of households with income < $10k:| Medway: | 5.3% (1,512) |
| State: | 6.6% (15,127) |
Number of households with income $10k - 20k:| Medway: | 3.4% (955) |
| State: | 9.2% (21,158) |
Number of households with income $20k - 30k:| Medway: | 5.8% (1,646) |
| State: | 7.8% (18,016) |
Number of households with income $30k - 40k:| Medway: | 3.1% (875) |
| State: | 7.9% (18,260) |
Number of households with income $40k - 50k:| Medway: | 1.6% (465) |
| State: | 5.6% (13,027) |
Number of households with income $50k - 60k:| Medway: | 5.6% (1,590) |
| State: | 5.6% (12,909) |
Number of households with income $60k - 75k:| Medway: | 5.0% (1,421) |
| Massachusetts: | 9.0% (20,800) |
Number of households with income $75k - 100k:| Medway: | 12.7% (3,622) |
| Massachusetts: | 12.1% (27,875) |
Number of households with income $100k - 125k:| Medway: | 12.8% (3,655) |
| State: | 8.1% (18,754) |
Number of households with income $125k - 150k:| Medway: | 5.0% (1,411) |
| State: | 6.8% (15,621) |
Number of households with income $150k - 200k:| Medway: | 9.9% (2,817) |
| Massachusetts: | 9.4% (21,618) |
Number of households with income > $200k:| Medway: | 29.9% (8,509) |
| Massachusetts: | 12.0% (27,592) |
Aggregate household income in Medway in 2022: $44,405,188
Median family income in Medway in 2022:| Medway: | $245,940 |
| State: | $78,380 |
Number of families with income $20k - 30k:| Medway: | 18.5% (29) |
| State: | 8.5% (13,245) |
Number of families with income $30k - 40k:| Medway: | 13.6% (21) |
| State: | 8.2% (12,705) |
Number of families with income $75k - 100k:| Medway: | 67.9% (107) |
| State: | 12.1% (18,758) |
Median per capita income in Medway in 2022:| Medway: | $43,554 |
| State: | $34,029 |
Income statistics for other residents
Number of households with income < $10k:| Medway: | 8.7% (2) |
| State: | 8.4% (11,559) |
Number of households with income $10k - 20k:| Medway: | 8.7% (2) |
| State: | 8.4% (11,499) |
Number of households with income $20k - 30k:| Medway: | 8.7% (2) |
| State: | 9.5% (13,070) |
Number of households with income $30k - 40k:| Medway: | 8.7% (2) |
| Massachusetts: | 6.0% (8,291) |
Number of households with income $40k - 50k:| Medway: | 8.7% (2) |
| State: | 9.2% (12,611) |
Number of households with income $50k - 60k:| Medway: | 8.7% (2) |
| State: | 7.9% (10,879) |
Number of households with income $60k - 75k:| Medway: | 8.7% (2) |
| State: | 7.5% (10,239) |
Number of households with income $75k - 100k:| Medway: | 13.0% (3) |
| Massachusetts: | 13.1% (18,032) |
Number of households with income $100k - 125k:| Medway: | 8.7% (2) |
| State: | 9.6% (13,141) |
Number of households with income $125k - 150k:| Medway: | 4.3% (1) |
| State: | 5.0% (6,808) |
Number of households with income $150k - 200k:| Medway: | 4.3% (1) |
| Massachusetts: | 6.4% (8,843) |
Number of households with income > $200k:| Medway: | 8.7% (2) |
| Massachusetts: | 9.0% (12,396) |
Aggregate household income in Medway in 2022: $4,339,005
Median non-family income in Medway in 2022:| Medway: | $41,572 |
| State: | $36,127 |
Change in median non-family income between 2000 and 2022:| Medway, Massachusetts: | +33.0% |
| Massachusetts: | +123.4% |
Median per capita income in Medway in 2022:| Medway: | $102,266 |
| State: | $30,797 |