Mayland-Pleasant Hill, Tennessee (TN) income map, earnings map, and wages data
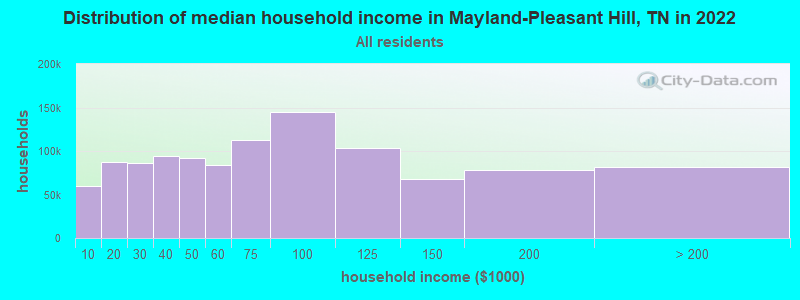
The median household income in Mayland-Pleasant Hill, TN in 2022 was $50,028, which was 30.4% less than the median annual income of $65,254 across the entire state of Tennessee. Compared to the median income of $27,929 in 2000 this represents an increase of 44.2%. The per capita income in 2022 was $25,243, which means an increase of 47.0% compared to 2000 when it was $13,384.
Income statistics for all residents
Median household income in Mayland-Pleasant Hill, TN in 2022:| Mayland-Pleasant Hill: | $50,029 |
| State: | $65,254 |
Change in median household income between 2000 and 2022:| Mayland-Pleasant Hill, Tennessee: | +79.1% |
| Tennessee: | +79.5% |
Number of households with income < $10k:| Mayland-Pleasant Hill: | 5.4% (59,366) |
| State: | 5.4% (154,793) |
Number of households with income $10k - 20k:| Mayland-Pleasant Hill: | 8.0% (87,799) |
| Tennessee: | 8.0% (228,599) |
Number of households with income $20k - 30k:| Mayland-Pleasant Hill: | 7.9% (86,344) |
| State: | 7.9% (224,908) |
Number of households with income $30k - 40k:| Mayland-Pleasant Hill: | 8.6% (93,723) |
| Tennessee: | 8.6% (244,297) |
Number of households with income $40k - 50k:| Mayland-Pleasant Hill: | 8.4% (91,660) |
| Tennessee: | 8.4% (238,949) |
Number of households with income $50k - 60k:| Mayland-Pleasant Hill: | 7.7% (83,803) |
| Tennessee: | 7.7% (218,438) |
Number of households with income $60k - 75k:| Mayland-Pleasant Hill: | 10.3% (112,873) |
| State: | 10.3% (294,172) |
Number of households with income $75k - 100k:| Mayland-Pleasant Hill: | 13.3% (144,763) |
| State: | 13.3% (377,310) |
Number of households with income $100k - 125k:| Mayland-Pleasant Hill: | 9.5% (103,311) |
| State: | 9.5% (269,124) |
Number of households with income $125k - 150k:| Mayland-Pleasant Hill: | 6.3% (68,376) |
| State: | 6.3% (178,328) |
Number of households with income $150k - 200k:| Mayland-Pleasant Hill: | 7.2% (78,197) |
| State: | 7.2% (204,030) |
Number of households with income > $200k:| Mayland-Pleasant Hill: | 7.5% (81,758) |
| State: | 7.5% (213,736) |
Aggregate household income in Mayland-Pleasant Hill in 2022: $5,170,479,108
Median family income in Mayland-Pleasant Hill in 2022:| Mayland-Pleasant Hill: | $55,983 |
| State: | $80,910 |
Median non-family income in Mayland-Pleasant Hill in 2022:| Mayland-Pleasant Hill: | $29,664 |
| State: | $40,285 |
Change in median non-family income between 2000 and 2022:| Mayland-Pleasant Hill, Tennessee: | +91.6% |
| State: | +91.5% |
Median per capita income in Mayland-Pleasant Hill in 2022:| Mayland-Pleasant Hill: | $25,244 |
| Tennessee: | $36,704 |
Change in median per capita income between 2000 and 2022:| Mayland-Pleasant Hill, Tennessee: | +88.6% |
| Tennessee: | +89.3% |
Income statistics for White residents
Median household income in Mayland-Pleasant Hill, TN in 2022:| Mayland-Pleasant Hill: | $51,008 |
| State: | $69,826 |
Change in median household income between 2000 and 2022:| Mayland-Pleasant Hill, Tennessee: | +80.8% |
| Tennessee: | +82.9% |
Number of households with income < $10k:| Mayland-Pleasant Hill: | 4.7% (37,108) |
| State: | 4.6% (100,279) |
Number of households with income $10k - 20k:| Mayland-Pleasant Hill: | 7.7% (61,168) |
| Tennessee: | 7.6% (165,031) |
Number of households with income $20k - 30k:| Mayland-Pleasant Hill: | 7.5% (59,367) |
| Tennessee: | 7.4% (160,229) |
Number of households with income $30k - 40k:| Mayland-Pleasant Hill: | 8.1% (64,414) |
| State: | 8.1% (174,784) |
Number of households with income $40k - 50k:| Mayland-Pleasant Hill: | 7.9% (62,593) |
| State: | 7.8% (169,622) |
Number of households with income $50k - 60k:| Mayland-Pleasant Hill: | 7.7% (60,927) |
| State: | 7.6% (165,508) |
Number of households with income $60k - 75k:| Mayland-Pleasant Hill: | 10.4% (82,549) |
| Tennessee: | 10.3% (223,937) |
Number of households with income $75k - 100k:| Mayland-Pleasant Hill: | 13.5% (107,634) |
| Tennessee: | 13.5% (292,688) |
Number of households with income $100k - 125k:| Mayland-Pleasant Hill: | 10.1% (80,627) |
| State: | 10.1% (219,251) |
Number of households with income $125k - 150k:| Mayland-Pleasant Hill: | 6.6% (52,245) |
| State: | 6.6% (142,574) |
Number of households with income $150k - 200k:| Mayland-Pleasant Hill: | 7.6% (60,702) |
| Tennessee: | 7.7% (166,039) |
Number of households with income > $200k:| Mayland-Pleasant Hill: | 8.4% (66,893) |
| State: | 8.5% (184,546) |
Aggregate household income in Mayland-Pleasant Hill in 2022: $4,089,009,071
Median family income in Mayland-Pleasant Hill in 2022:| Mayland-Pleasant Hill: | $56,437 |
| Tennessee: | $86,015 |
Number of families with income < $10k:| Mayland-Pleasant Hill: | 6.8% (88) |
| Tennessee: | 3.1% (43,751) |
Number of families with income $10k - 20k:| Mayland-Pleasant Hill: | 10.0% (131) |
| State: | 3.5% (49,925) |
Number of families with income $20k - 30k:| Mayland-Pleasant Hill: | 14.5% (189) |
| State: | 5.0% (70,431) |
Number of families with income $30k - 40k:| Mayland-Pleasant Hill: | 11.4% (148) |
| State: | 6.6% (93,498) |
Number of families with income $40k - 50k:| Mayland-Pleasant Hill: | 12.0% (156) |
| State: | 6.8% (96,726) |
Number of families with income $50k - 60k:| Mayland-Pleasant Hill: | 10.2% (132) |
| State: | 7.2% (101,879) |
Number of families with income $60k - 75k:| Mayland-Pleasant Hill: | 5.9% (77) |
| State: | 10.7% (151,997) |
Number of families with income $75k - 100k:| Mayland-Pleasant Hill: | 13.4% (175) |
| State: | 15.4% (218,373) |
Number of families with income $100k - 125k:| Mayland-Pleasant Hill: | 4.6% (60) |
| State: | 12.6% (178,761) |
Number of families with income $125k - 150k:| Mayland-Pleasant Hill: | 3.4% (44) |
| State: | 8.2% (116,575) |
Number of families with income $150k - 200k:| Mayland-Pleasant Hill: | 3.8% (49) |
| Tennessee: | 9.9% (141,123) |
Number of families with income > $200k:| Mayland-Pleasant Hill: | 4.1% (54) |
| Tennessee: | 11.2% (159,431) |
Median non-family income in Mayland-Pleasant Hill in 2022:| Mayland-Pleasant Hill: | $29,591 |
| State: | $41,178 |
Change in median non-family income between 2000 and 2022:| Mayland-Pleasant Hill, Tennessee: | +91.1% |
| State: | +91.1% |
Median per capita income in Mayland-Pleasant Hill in 2022:| Mayland-Pleasant Hill: | $25,516 |
| State: | $40,126 |
Change in median per capita income between 2000 and 2022:| Mayland-Pleasant Hill, Tennessee: | +91.8% |
| Tennessee: | +92.6% |
Income statistics for Black or African American residents
Median household income in Mayland-Pleasant Hill, TN in 2022:| Mayland-Pleasant Hill: | $12,421 |
| State: | $49,531 |
Change in median household income between 2000 and 2022:| Mayland-Pleasant Hill, Tennessee: | +98.7% |
| State: | +82.3% |
Number of households with income < $10k:| Mayland-Pleasant Hill: | 9.1% (4,606) |
| State: | 9.1% (39,909) |
Number of households with income $10k - 20k:| Mayland-Pleasant Hill: | 10.5% (5,328) |
| State: | 10.5% (46,276) |
Number of households with income $20k - 30k:| Mayland-Pleasant Hill: | 10.2% (5,197) |
| State: | 10.2% (45,072) |
Number of households with income $30k - 40k:| Mayland-Pleasant Hill: | 10.0% (5,053) |
| State: | 10.0% (43,885) |
Number of households with income $40k - 50k:| Mayland-Pleasant Hill: | 10.7% (5,452) |
| State: | 10.7% (47,267) |
Number of households with income $50k - 60k:| Mayland-Pleasant Hill: | 7.7% (3,902) |
| State: | 7.7% (33,868) |
Number of households with income $60k - 75k:| Mayland-Pleasant Hill: | 10.5% (5,329) |
| State: | 10.5% (46,247) |
Number of households with income $75k - 100k:| Mayland-Pleasant Hill: | 12.6% (6,386) |
| State: | 12.6% (55,465) |
Number of households with income $100k - 125k:| Mayland-Pleasant Hill: | 6.7% (3,393) |
| State: | 6.7% (29,515) |
Number of households with income $125k - 150k:| Mayland-Pleasant Hill: | 4.8% (2,452) |
| Tennessee: | 4.8% (21,306) |
Number of households with income $150k - 200k:| Mayland-Pleasant Hill: | 4.6% (2,343) |
| State: | 4.6% (20,425) |
Number of households with income > $200k:| Mayland-Pleasant Hill: | 2.5% (1,283) |
| State: | 2.5% (11,183) |
Aggregate household income in Mayland-Pleasant Hill in 2022: $88,739
Median non-family income in Mayland-Pleasant Hill in 2022:| Mayland-Pleasant Hill: | $13,859 |
| State: | $35,793 |
Change in median non-family income between 2000 and 2022:| Mayland-Pleasant Hill, Tennessee: | +121.7% |
| State: | +104.3% |
Median per capita income in Mayland-Pleasant Hill in 2022:| Mayland-Pleasant Hill: | $13,749 |
| Tennessee: | $27,306 |
Change in median per capita income between 2000 and 2022:| Mayland-Pleasant Hill, Tennessee: | +112.3% |
| State: | +105.3% |
Income statistics for Asian residents
Number of households with income < $10k:| Mayland-Pleasant Hill: | 2.8% (1,496) |
| State: | 2.8% (1,217) |
Number of households with income $10k - 20k:| Mayland-Pleasant Hill: | 2.5% (1,344) |
| State: | 2.5% (1,093) |
Number of households with income $20k - 30k:| Mayland-Pleasant Hill: | 4.1% (2,209) |
| State: | 4.1% (1,796) |
Number of households with income $30k - 40k:| Mayland-Pleasant Hill: | 9.6% (5,174) |
| Tennessee: | 9.6% (4,208) |
Number of households with income $40k - 50k:| Mayland-Pleasant Hill: | 5.5% (2,980) |
| State: | 5.5% (2,423) |
Number of households with income $50k - 60k:| Mayland-Pleasant Hill: | 7.5% (4,030) |
| State: | 7.5% (3,277) |
Number of households with income $60k - 75k:| Mayland-Pleasant Hill: | 10.3% (5,558) |
| State: | 10.3% (4,520) |
Number of households with income $75k - 100k:| Mayland-Pleasant Hill: | 9.0% (4,828) |
| State: | 9.0% (3,926) |
Number of households with income $100k - 125k:| Mayland-Pleasant Hill: | 8.4% (4,548) |
| Tennessee: | 8.4% (3,699) |
Number of households with income $125k - 150k:| Mayland-Pleasant Hill: | 8.0% (4,289) |
| Tennessee: | 8.0% (3,488) |
Number of households with income $150k - 200k:| Mayland-Pleasant Hill: | 12.0% (6,470) |
| State: | 12.0% (5,262) |
Number of households with income > $200k:| Mayland-Pleasant Hill: | 20.3% (10,948) |
| Tennessee: | 20.3% (8,903) |
Median per capita income in Mayland-Pleasant Hill in 2022:| Mayland-Pleasant Hill: | $46,100 |
| Tennessee: | $46,931 |
Change in median per capita income between 2000 and 2022:| Mayland-Pleasant Hill, Tennessee: | +84.4% |
| State: | +130.8% |
Income statistics for Hispanic or Latino residents
Median household income in Mayland-Pleasant Hill, TN in 2022:| Mayland-Pleasant Hill: | $54,571 |
| Tennessee: | $58,385 |
Change in median household income between 2000 and 2022:| Mayland-Pleasant Hill, Tennessee: | +107.1% |
| Tennessee: | +82.3% |
Number of households with income < $10k:| Mayland-Pleasant Hill: | 7.2% (3,532) |
| State: | 7.2% (8,567) |
Number of households with income $10k - 20k:| Mayland-Pleasant Hill: | 6.4% (3,151) |
| State: | 6.4% (7,670) |
Number of households with income $20k - 30k:| Mayland-Pleasant Hill: | 9.4% (4,611) |
| State: | 9.4% (11,247) |
Number of households with income $30k - 40k:| Mayland-Pleasant Hill: | 10.1% (4,955) |
| Tennessee: | 10.1% (12,072) |
Number of households with income $40k - 50k:| Mayland-Pleasant Hill: | 10.0% (4,911) |
| Tennessee: | 10.0% (11,947) |
Number of households with income $50k - 60k:| Mayland-Pleasant Hill: | 8.0% (3,932) |
| State: | 8.0% (9,569) |
Number of households with income $60k - 75k:| Mayland-Pleasant Hill: | 10.3% (5,055) |
| State: | 10.3% (12,315) |
Number of households with income $75k - 100k:| Mayland-Pleasant Hill: | 15.3% (7,534) |
| State: | 15.3% (18,285) |
Number of households with income $100k - 125k:| Mayland-Pleasant Hill: | 8.3% (4,085) |
| Tennessee: | 8.3% (9,886) |
Number of households with income $125k - 150k:| Mayland-Pleasant Hill: | 5.9% (2,912) |
| State: | 5.9% (7,066) |
Number of households with income $150k - 200k:| Mayland-Pleasant Hill: | 4.9% (2,394) |
| Tennessee: | 4.9% (5,822) |
Number of households with income > $200k:| Mayland-Pleasant Hill: | 4.5% (2,195) |
| State: | 4.5% (5,337) |
Aggregate household income in Mayland-Pleasant Hill in 2022: $5,168,059
Median family income in Mayland-Pleasant Hill in 2022:| Mayland-Pleasant Hill: | $58,839 |
| State: | $64,014 |
Number of families with income < $10k:| Mayland-Pleasant Hill: | 11.4% (12) |
| State: | 6.5% (5,773) |
Number of families with income $10k - 20k:| Mayland-Pleasant Hill: | 12.8% (13) |
| State: | 5.4% (4,773) |
Number of families with income $20k - 30k:| Mayland-Pleasant Hill: | 21.0% (22) |
| State: | 9.2% (8,233) |
Number of families with income $30k - 40k:| Mayland-Pleasant Hill: | 12.9% (14) |
| Tennessee: | 9.6% (8,514) |
Number of families with income $40k - 50k:| Mayland-Pleasant Hill: | 12.6% (13) |
| State: | 8.8% (7,850) |
Number of families with income $50k - 60k:| Mayland-Pleasant Hill: | 8.4% (9) |
| State: | 7.9% (7,017) |
Number of families with income $60k - 75k:| Mayland-Pleasant Hill: | 4.1% (4) |
| State: | 10.8% (9,605) |
Number of families with income $75k - 100k:| Mayland-Pleasant Hill: | 10.1% (11) |
| Tennessee: | 16.6% (14,820) |
Number of families with income $100k - 125k:| Mayland-Pleasant Hill: | 2.3% (2) |
| Tennessee: | 8.4% (7,480) |
Number of families with income $125k - 150k:| Mayland-Pleasant Hill: | 1.8% (2) |
| Tennessee: | 6.3% (5,594) |
Number of families with income $150k - 200k:| Mayland-Pleasant Hill: | 1.3% (1) |
| State: | 5.4% (4,817) |
Number of families with income > $200k:| Mayland-Pleasant Hill: | 1.3% (1) |
| Tennessee: | 5.1% (4,577) |
Median per capita income in Mayland-Pleasant Hill in 2022:| Mayland-Pleasant Hill: | $5,526 |
| State: | $21,276 |
Change in median per capita income between 2000 and 2022:| Mayland-Pleasant Hill, Tennessee: | +84.4% |
| State: | +76.0% |
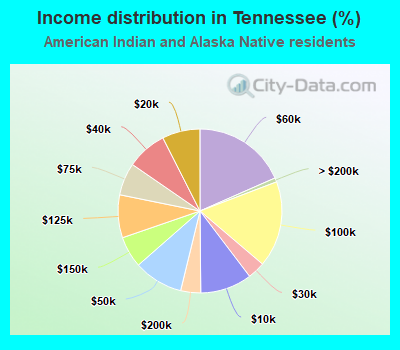
Income statistics for American Indian and Alaska Native residents
Median household income in Mayland-Pleasant Hill, TN in 2022:| Mayland-Pleasant Hill: | $26,154 |
| State: | $55,846 |
Change in median household income between 2000 and 2022:| Mayland-Pleasant Hill, Tennessee: | +69.1% |
| State: | +65.4% |
Number of households with income < $10k:| Mayland-Pleasant Hill: | 10.2% (245) |
| Tennessee: | 10.2% (535) |
Number of households with income $10k - 20k:| Mayland-Pleasant Hill: | 7.4% (179) |
| Tennessee: | 7.5% (392) |
Number of households with income $20k - 30k:| Mayland-Pleasant Hill: | 3.5% (83) |
| State: | 3.4% (181) |
Number of households with income $30k - 40k:| Mayland-Pleasant Hill: | 7.9% (190) |
| State: | 7.9% (416) |
Number of households with income $40k - 50k:| Mayland-Pleasant Hill: | 9.7% (234) |
| State: | 9.7% (511) |
Number of households with income $50k - 60k:| Mayland-Pleasant Hill: | 18.4% (443) |
| Tennessee: | 18.4% (966) |
Number of households with income $60k - 75k:| Mayland-Pleasant Hill: | 6.4% (154) |
| State: | 6.4% (337) |
Number of households with income $75k - 100k:| Mayland-Pleasant Hill: | 17.0% (409) |
| State: | 17.0% (892) |
Number of households with income $100k - 125k:| Mayland-Pleasant Hill: | 8.4% (203) |
| State: | 8.5% (444) |
Number of households with income $125k - 150k:| Mayland-Pleasant Hill: | 6.2% (148) |
| Tennessee: | 6.2% (324) |
Number of households with income $150k - 200k:| Mayland-Pleasant Hill: | 4.0% (95) |
| Tennessee: | 3.9% (207) |
Number of households with income > $200k:| Mayland-Pleasant Hill: | 0.8% (20) |
| State: | 0.8% (43) |
Aggregate household income in Mayland-Pleasant Hill in 2022: $291,647
Median non-family income in Mayland-Pleasant Hill in 2022:| Mayland-Pleasant Hill: | $36,846 |
| State: | $50,580 |
Change in median non-family income between 2000 and 2022:| Mayland-Pleasant Hill, Tennessee: | +138.2% |
| State: | +129.6% |
Median per capita income in Mayland-Pleasant Hill in 2022:| Mayland-Pleasant Hill: | $17,279 |
| State: | $25,981 |
Change in median per capita income between 2000 and 2022:| Mayland-Pleasant Hill, Tennessee: | +41.0% |
| Tennessee: | +40.2% |
Income statistics for Multirace residents
Median household income in Mayland-Pleasant Hill, TN in 2022:| Mayland-Pleasant Hill: | $34,991 |
| Tennessee: | $57,741 |
Change in median household income between 2000 and 2022:| Mayland-Pleasant Hill, Tennessee: | +86.6% |
| State: | +87.1% |
Number of households with income < $10k:| Mayland-Pleasant Hill: | 6.7% (2,999) |
| Tennessee: | 6.7% (9,867) |
Number of households with income $10k - 20k:| Mayland-Pleasant Hill: | 8.6% (3,833) |
| State: | 8.6% (12,639) |
Number of households with income $20k - 30k:| Mayland-Pleasant Hill: | 9.2% (4,102) |
| Tennessee: | 9.2% (13,555) |
Number of households with income $30k - 40k:| Mayland-Pleasant Hill: | 10.3% (4,597) |
| State: | 10.3% (15,117) |
Number of households with income $40k - 50k:| Mayland-Pleasant Hill: | 9.4% (4,195) |
| Tennessee: | 9.4% (13,829) |
Number of households with income $50k - 60k:| Mayland-Pleasant Hill: | 7.5% (3,329) |
| Tennessee: | 7.5% (10,969) |
Number of households with income $60k - 75k:| Mayland-Pleasant Hill: | 9.2% (4,103) |
| Tennessee: | 9.2% (13,568) |
Number of households with income $75k - 100k:| Mayland-Pleasant Hill: | 12.6% (5,630) |
| State: | 12.6% (18,516) |
Number of households with income $100k - 125k:| Mayland-Pleasant Hill: | 8.6% (3,850) |
| State: | 8.6% (12,656) |
Number of households with income $125k - 150k:| Mayland-Pleasant Hill: | 5.9% (2,633) |
| State: | 5.9% (8,674) |
Number of households with income $150k - 200k:| Mayland-Pleasant Hill: | 7.2% (3,204) |
| Tennessee: | 7.2% (10,611) |
Number of households with income > $200k:| Mayland-Pleasant Hill: | 4.7% (2,107) |
| State: | 4.8% (6,986) |
Aggregate household income in Mayland-Pleasant Hill in 2022: $12,937,992
Median family income in Mayland-Pleasant Hill in 2022:| Mayland-Pleasant Hill: | $36,119 |
| State: | $70,058 |
Median non-family income in Mayland-Pleasant Hill in 2022:| Mayland-Pleasant Hill: | $39,699 |
| Tennessee: | $39,395 |
Change in median non-family income between 2000 and 2022:| Mayland-Pleasant Hill, Tennessee: | +111.7% |
| Tennessee: | +99.1% |
Median per capita income in Mayland-Pleasant Hill in 2022:| Mayland-Pleasant Hill: | $66,526 |
| State: | $24,436 |
Change in median per capita income between 2000 and 2022:| Mayland-Pleasant Hill, Tennessee: | +82.5% |
| Tennessee: | +84.3% |
Income statistics for other residents
Number of households with income < $10k:| Mayland-Pleasant Hill: | 6.2% (1) |
| State: | 6.8% (2,986) |
Number of households with income $10k - 20k:| Mayland-Pleasant Hill: | 0.0% (0) |
| State: | 6.3% (2,777) |
Number of households with income $20k - 30k:| Mayland-Pleasant Hill: | 12.5% (2) |
| Tennessee: | 9.2% (4,034) |
Number of households with income $30k - 40k:| Mayland-Pleasant Hill: | 12.5% (2) |
| State: | 13.2% (5,819) |
Number of households with income $40k - 50k:| Mayland-Pleasant Hill: | 12.5% (2) |
| State: | 11.9% (5,244) |
Number of households with income $50k - 60k:| Mayland-Pleasant Hill: | 6.2% (1) |
| State: | 7.3% (3,232) |
Number of households with income $60k - 75k:| Mayland-Pleasant Hill: | 6.2% (1) |
| Tennessee: | 12.2% (5,384) |
Number of households with income $75k - 100k:| Mayland-Pleasant Hill: | 12.5% (2) |
| Tennessee: | 13.1% (5,771) |
Number of households with income $100k - 125k:| Mayland-Pleasant Hill: | 12.5% (2) |
| Tennessee: | 7.8% (3,429) |
Number of households with income $125k - 150k:| Mayland-Pleasant Hill: | 6.2% (1) |
| Tennessee: | 4.3% (1,881) |
Number of households with income $150k - 200k:| Mayland-Pleasant Hill: | 6.2% (1) |
| State: | 3.4% (1,486) |
Number of households with income > $200k:| Mayland-Pleasant Hill: | 6.2% (1) |
| State: | 4.6% (2,040) |
Aggregate household income in Mayland-Pleasant Hill in 2022: $1,138,048
Median family income in Mayland-Pleasant Hill in 2022:| Mayland-Pleasant Hill: | $59,628 |
| Tennessee: | $60,601 |
Median per capita income in Mayland-Pleasant Hill in 2022:| Mayland-Pleasant Hill: | $16,036 |
| Tennessee: | $21,430 |
Change in median per capita income between 2000 and 2022:| Mayland-Pleasant Hill, Tennessee: | +109.7% |
| State: | +105.6% |