Littleton, Massachusetts (MA) income map, earnings map, and wages data
The median household income in Littleton, MA in 2022 was $139,432, which was 32.2% greater than the median annual income of $94,488 across the entire state of Massachusetts. Compared to the median income of $71,384 in 2000 this represents an increase of 48.8%. The per capita income in 2022 was $64,507, which means an increase of 51.8% compared to 2000 when it was $31,070.
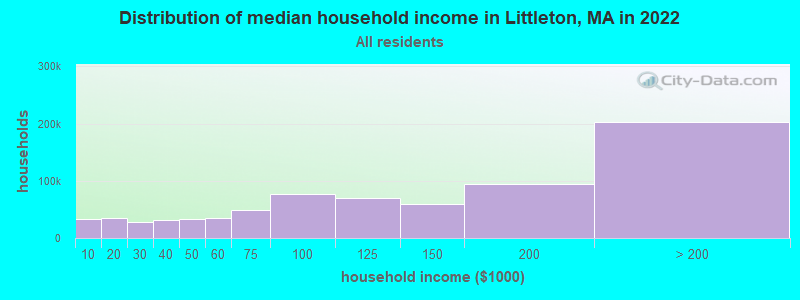
Income statistics for all residents
Median household income in Littleton, MA in 2022:| Littleton: | $139,432 |
| Massachusetts: | $94,488 |
Change in median household income between 2000 and 2022:| Littleton, Massachusetts: | +95.3% |
| State: | +87.1% |
Number of households with income < $10k:| Littleton: | 4.5% (33,510) |
| Massachusetts: | 5.2% (146,170) |
Number of households with income $10k - 20k:| Littleton: | 4.7% (35,446) |
| State: | 6.4% (180,001) |
Number of households with income $20k - 30k:| Littleton: | 3.8% (28,376) |
| State: | 5.6% (156,667) |
Number of households with income $30k - 40k:| Littleton: | 4.2% (31,456) |
| State: | 5.6% (157,168) |
Number of households with income $40k - 50k:| Littleton: | 4.5% (33,512) |
| State: | 5.4% (151,455) |
Number of households with income $50k - 60k:| Littleton: | 4.6% (34,809) |
| State: | 5.1% (142,726) |
Number of households with income $60k - 75k:| Littleton: | 6.5% (48,705) |
| State: | 7.6% (212,203) |
Number of households with income $75k - 100k:| Littleton: | 10.2% (76,241) |
| Massachusetts: | 11.3% (317,064) |
Number of households with income $100k - 125k:| Littleton: | 9.4% (70,722) |
| State: | 9.7% (270,603) |
Number of households with income $125k - 150k:| Littleton: | 7.9% (58,908) |
| State: | 8.0% (223,140) |
Number of households with income $150k - 200k:| Littleton: | 12.6% (94,627) |
| State: | 11.0% (308,695) |
Number of households with income > $200k:| Littleton: | 27.1% (202,747) |
| State: | 19.0% (531,884) |
Aggregate household income in Littleton in 2022: $12,380,861,484
Median family income in Littleton in 2022:| Littleton: | $169,590 |
| Massachusetts: | $120,263 |
Median non-family income in Littleton in 2022:| Littleton: | $61,720 |
| State: | $55,979 |
Change in median non-family income between 2000 and 2022:| Littleton, Massachusetts: | +94.2% |
| State: | +88.0% |
Median per capita income in Littleton in 2022:| Littleton: | $64,507 |
| Massachusetts: | $54,025 |
Change in median per capita income between 2000 and 2022:| Littleton, Massachusetts: | +107.6% |
| State: | +108.2% |
Income statistics for White residents
Median household income in Littleton, MA in 2022:| Littleton: | $140,569 |
| State: | $101,391 |
Change in median household income between 2000 and 2022:| Littleton, Massachusetts: | +98.2% |
| Massachusetts: | +93.3% |
Number of households with income < $10k:| Littleton: | 3.9% (20,521) |
| State: | 4.4% (91,120) |
Number of households with income $10k - 20k:| Littleton: | 4.7% (25,016) |
| Massachusetts: | 5.9% (122,055) |
Number of households with income $20k - 30k:| Littleton: | 3.8% (20,188) |
| State: | 5.1% (105,311) |
Number of households with income $30k - 40k:| Littleton: | 4.2% (22,507) |
| Massachusetts: | 5.3% (110,239) |
Number of households with income $40k - 50k:| Littleton: | 4.0% (21,376) |
| State: | 5.0% (104,636) |
Number of households with income $50k - 60k:| Littleton: | 4.3% (22,966) |
| Massachusetts: | 4.8% (99,486) |
Number of households with income $60k - 75k:| Littleton: | 6.6% (34,999) |
| State: | 7.5% (155,124) |
Number of households with income $75k - 100k:| Littleton: | 10.1% (53,868) |
| State: | 11.4% (236,252) |
Number of households with income $100k - 125k:| Littleton: | 8.8% (46,774) |
| Massachusetts: | 9.9% (204,731) |
Number of households with income $125k - 150k:| Littleton: | 8.1% (43,201) |
| State: | 8.5% (175,324) |
Number of households with income $150k - 200k:| Littleton: | 13.2% (70,424) |
| State: | 11.7% (242,980) |
Number of households with income > $200k:| Littleton: | 28.2% (149,828) |
| Massachusetts: | 20.5% (425,966) |
Aggregate household income in Littleton in 2022: $9,046,455,806
Median family income in Littleton in 2022:| Littleton: | $175,790 |
| Massachusetts: | $133,153 |
Number of families with income < $10k:| Littleton: | 1.5% (28) |
| State: | 2.0% (25,038) |
Number of families with income $10k - 20k:| Littleton: | 1.0% (18) |
| State: | 2.1% (26,403) |
Number of families with income $20k - 30k:| Littleton: | 1.2% (22) |
| Massachusetts: | 2.6% (32,525) |
Number of families with income $30k - 40k:| Littleton: | 2.7% (50) |
| Massachusetts: | 3.9% (48,079) |
Number of families with income $40k - 50k:| Littleton: | 2.7% (51) |
| State: | 3.8% (46,908) |
Number of families with income $50k - 60k:| Littleton: | 2.3% (43) |
| State: | 3.8% (46,476) |
Number of families with income $60k - 75k:| Littleton: | 5.4% (101) |
| State: | 6.4% (79,040) |
Number of families with income $75k - 100k:| Littleton: | 10.3% (192) |
| Massachusetts: | 11.1% (137,395) |
Number of families with income $100k - 125k:| Littleton: | 10.9% (203) |
| State: | 11.1% (136,771) |
Number of families with income $125k - 150k:| Littleton: | 11.3% (211) |
| State: | 10.0% (123,709) |
Number of families with income $150k - 200k:| Littleton: | 17.1% (318) |
| Massachusetts: | 14.7% (181,602) |
Number of families with income > $200k:| Littleton: | 33.6% (625) |
| State: | 28.5% (351,887) |
Median non-family income in Littleton in 2022:| Littleton: | $61,441 |
| State: | $59,323 |
Change in median non-family income between 2000 and 2022:| Littleton, Massachusetts: | +90.7% |
| State: | +94.3% |
Median per capita income in Littleton in 2022:| Littleton: | $68,355 |
| State: | $60,804 |
Change in median per capita income between 2000 and 2022:| Littleton, Massachusetts: | +117.3% |
| Massachusetts: | +118.7% |
Income statistics for Black or African American residents
Median household income in Littleton, MA in 2022:| Littleton: | $192,393 |
| Massachusetts: | $63,189 |
Change in median household income between 2000 and 2022:| Littleton, Massachusetts: | +92.0% |
| State: | +87.4% |
Number of households with income < $10k:| Littleton: | 5.7% (3,636) |
| State: | 9.1% (15,797) |
Number of households with income $10k - 20k:| Littleton: | 7.1% (4,562) |
| State: | 9.4% (16,267) |
Number of households with income $20k - 30k:| Littleton: | 4.3% (2,772) |
| State: | 7.8% (13,520) |
Number of households with income $30k - 40k:| Littleton: | 6.4% (4,130) |
| Massachusetts: | 8.3% (14,412) |
Number of households with income $40k - 50k:| Littleton: | 9.6% (6,140) |
| Massachusetts: | 7.9% (13,790) |
Number of households with income $50k - 60k:| Littleton: | 5.7% (3,650) |
| State: | 5.8% (10,041) |
Number of households with income $60k - 75k:| Littleton: | 8.9% (5,721) |
| Massachusetts: | 8.5% (14,822) |
Number of households with income $75k - 100k:| Littleton: | 13.0% (8,330) |
| State: | 11.0% (19,122) |
Number of households with income $100k - 125k:| Littleton: | 8.1% (5,200) |
| Massachusetts: | 8.4% (14,575) |
Number of households with income $125k - 150k:| Littleton: | 6.7% (4,308) |
| Massachusetts: | 6.0% (10,429) |
Number of households with income $150k - 200k:| Littleton: | 11.2% (7,169) |
| State: | 7.2% (12,539) |
Number of households with income > $200k:| Littleton: | 13.3% (8,501) |
| Massachusetts: | 10.5% (18,185) |
Aggregate household income in Littleton in 2022: $4,094,584
Median family income in Littleton in 2022:| Littleton: | $231,883 |
| Massachusetts: | $79,815 |
Number of families with income $30k - 40k:| Littleton: | 17.2% (5) |
| Massachusetts: | 6.4% (7,002) |
Number of families with income $100k - 125k:| Littleton: | 82.8% (25) |
| Massachusetts: | 10.4% (11,452) |
Median per capita income in Littleton in 2022:| Littleton: | $86,776 |
| Massachusetts: | $33,524 |
Change in median per capita income between 2000 and 2022:| Littleton, Massachusetts: | +98.1% |
| Massachusetts: | +109.4% |
Income statistics for Asian residents
Median household income in Littleton, MA in 2022:| Littleton: | $255,673 |
| State: | $117,855 |
Change in median household income between 2000 and 2022:| Littleton, Massachusetts: | +108.1% |
| State: | +129.9% |
Number of households with income < $10k:| Littleton: | 6.0% (9,076) |
| State: | 6.8% (11,982) |
Number of households with income $10k - 20k:| Littleton: | 3.1% (4,685) |
| State: | 4.8% (8,376) |
Number of households with income $20k - 30k:| Littleton: | 1.9% (2,938) |
| State: | 3.7% (6,558) |
Number of households with income $30k - 40k:| Littleton: | 2.4% (3,613) |
| State: | 3.3% (5,748) |
Number of households with income $40k - 50k:| Littleton: | 4.4% (6,599) |
| State: | 4.1% (7,192) |
Number of households with income $50k - 60k:| Littleton: | 4.3% (6,514) |
| Massachusetts: | 5.0% (8,734) |
Number of households with income $60k - 75k:| Littleton: | 4.5% (6,781) |
| State: | 5.8% (10,203) |
Number of households with income $75k - 100k:| Littleton: | 7.9% (11,982) |
| State: | 8.6% (15,154) |
Number of households with income $100k - 125k:| Littleton: | 13.0% (19,647) |
| State: | 10.8% (18,942) |
Number of households with income $125k - 150k:| Littleton: | 8.3% (12,539) |
| State: | 8.0% (14,037) |
Number of households with income $150k - 200k:| Littleton: | 11.1% (16,779) |
| State: | 12.5% (21,856) |
Number of households with income > $200k:| Littleton: | 32.9% (49,671) |
| State: | 26.6% (46,694) |
Aggregate household income in Littleton in 2022: $29,375,038
Median family income in Littleton in 2022:| Littleton: | $272,484 |
| State: | $140,113 |
Number of families with income $40k - 50k:| Littleton: | 4.1% (13) |
| State: | 3.9% (4,621) |
Number of families with income $100k - 125k:| Littleton: | 7.6% (24) |
| Massachusetts: | 10.0% (11,697) |
Number of families with income > $200k:| Littleton: | 88.4% (283) |
| State: | 34.0% (39,856) |
Median per capita income in Littleton in 2022:| Littleton: | $76,432 |
| State: | $58,900 |
Income statistics for Hispanic or Latino residents
Median household income in Littleton, MA in 2022:| Littleton: | $476,178 |
| Massachusetts: | $61,523 |
Change in median household income between 2000 and 2022:| Littleton, Massachusetts: | +138.1% |
| State: | +125.4% |
Number of households with income < $10k:| Littleton: | 6.6% (14,324) |
| Massachusetts: | 8.8% (25,307) |
Number of households with income $10k - 20k:| Littleton: | 7.1% (15,313) |
| State: | 10.0% (28,653) |
Number of households with income $20k - 30k:| Littleton: | 6.0% (13,101) |
| Massachusetts: | 8.8% (25,189) |
Number of households with income $30k - 40k:| Littleton: | 3.4% (7,346) |
| State: | 7.2% (20,822) |
Number of households with income $40k - 50k:| Littleton: | 6.4% (13,852) |
| State: | 7.2% (20,817) |
Number of households with income $50k - 60k:| Littleton: | 6.1% (13,329) |
| State: | 6.5% (18,748) |
Number of households with income $60k - 75k:| Littleton: | 6.3% (13,676) |
| Massachusetts: | 8.8% (25,390) |
Number of households with income $75k - 100k:| Littleton: | 11.4% (24,803) |
| State: | 12.0% (34,488) |
Number of households with income $100k - 125k:| Littleton: | 10.6% (22,975) |
| State: | 8.6% (24,599) |
Number of households with income $125k - 150k:| Littleton: | 7.5% (16,266) |
| State: | 6.2% (17,743) |
Number of households with income $150k - 200k:| Littleton: | 11.4% (24,731) |
| Massachusetts: | 7.3% (21,017) |
Number of households with income > $200k:| Littleton: | 17.2% (37,309) |
| State: | 8.6% (24,606) |
Aggregate household income in Littleton in 2022: $23,225,148
Median family income in Littleton in 2022:| Littleton: | $462,965 |
| State: | $66,072 |
Number of families with income < $10k:| Littleton: | 3.2% (6) |
| State: | 6.2% (12,456) |
Number of families with income $10k - 20k:| Littleton: | 3.1% (6) |
| Massachusetts: | 6.0% (12,071) |
Number of families with income $20k - 30k:| Littleton: | 3.4% (6) |
| State: | 10.1% (20,376) |
Number of families with income $30k - 40k:| Littleton: | 4.0% (8) |
| State: | 8.2% (16,470) |
Number of families with income $40k - 50k:| Littleton: | 5.3% (10) |
| State: | 7.4% (14,829) |
Number of families with income $50k - 60k:| Littleton: | 6.1% (12) |
| Massachusetts: | 7.3% (14,643) |
Number of families with income $60k - 75k:| Littleton: | 10.6% (20) |
| State: | 10.6% (21,252) |
Number of families with income $75k - 100k:| Littleton: | 15.3% (29) |
| State: | 12.0% (24,088) |
Number of families with income $100k - 125k:| Littleton: | 13.0% (25) |
| State: | 8.9% (17,954) |
Number of families with income $125k - 150k:| Littleton: | 9.4% (18) |
| State: | 6.9% (13,837) |
Number of families with income $150k - 200k:| Littleton: | 11.4% (22) |
| Massachusetts: | 7.3% (14,683) |
Number of families with income > $200k:| Littleton: | 15.2% (29) |
| Massachusetts: | 9.3% (18,741) |
Median per capita income in Littleton in 2022:| Littleton: | $120,193 |
| Massachusetts: | $28,993 |
Change in median per capita income between 2000 and 2022:| Littleton, Massachusetts: | +142.9% |
| State: | +142.4% |
Income statistics for Multirace residents
Median household income in Littleton, MA in 2022:| Littleton: | $286,250 |
| Massachusetts: | $71,552 |
Change in median household income between 2000 and 2022:| Littleton, Massachusetts: | +146.3% |
| State: | +109.0% |
Number of households with income < $10k:| Littleton: | 5.4% (6,804) |
| Massachusetts: | 6.6% (15,127) |
Number of households with income $10k - 20k:| Littleton: | 6.0% (7,601) |
| Massachusetts: | 9.2% (21,158) |
Number of households with income $20k - 30k:| Littleton: | 2.8% (3,583) |
| Massachusetts: | 7.8% (18,016) |
Number of households with income $30k - 40k:| Littleton: | 6.0% (7,638) |
| State: | 7.9% (18,260) |
Number of households with income $40k - 50k:| Littleton: | 4.1% (5,208) |
| Massachusetts: | 5.6% (13,027) |
Number of households with income $50k - 60k:| Littleton: | 5.9% (7,453) |
| State: | 5.6% (12,909) |
Number of households with income $60k - 75k:| Littleton: | 6.7% (8,400) |
| Massachusetts: | 9.0% (20,800) |
Number of households with income $75k - 100k:| Littleton: | 12.9% (16,341) |
| State: | 12.1% (27,875) |
Number of households with income $100k - 125k:| Littleton: | 10.8% (13,576) |
| Massachusetts: | 8.1% (18,754) |
Number of households with income $125k - 150k:| Littleton: | 6.4% (8,039) |
| Massachusetts: | 6.8% (15,621) |
Number of households with income $150k - 200k:| Littleton: | 12.8% (16,198) |
| State: | 9.4% (21,618) |
Number of households with income > $200k:| Littleton: | 20.1% (25,442) |
| Massachusetts: | 12.0% (27,592) |
Aggregate household income in Littleton in 2022: $20,289,968
Median family income in Littleton in 2022:| Littleton: | $263,933 |
| State: | $78,380 |
Number of families with income $100k - 125k:| Littleton: | 27.1% (57) |
| State: | 7.9% (12,321) |
Number of families with income > $200k:| Littleton: | 72.9% (154) |
| Massachusetts: | 14.0% (21,838) |
Median per capita income in Littleton in 2022:| Littleton: | $19,965 |
| State: | $34,029 |
Change in median per capita income between 2000 and 2022:| Littleton, Massachusetts: | +116.4% |
| State: | +132.1% |