Enfield, Connecticut (CT) income map, earnings map, and wages data
The median household income in Enfield, CT in 2022 was $89,361, which was about the same as the median annual income of $88,429 across the entire state of Connecticut. Compared to the median income of $52,810 in 2000 this represents an increase of 40.9%. The per capita income in 2022 was $40,184, which means an increase of 45.3% compared to 2000 when it was $21,967.
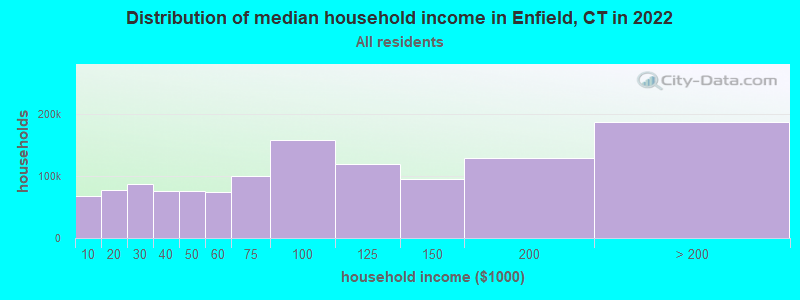
Income statistics for all residents
Median household income in Enfield, CT in 2022:| Enfield: | $89,362 |
| Connecticut: | $88,429 |
Change in median household income between 2000 and 2022:| Enfield, Connecticut: | +69.2% |
| State: | +64.0% |
Number of households with income < $10k:| Enfield: | 5.2% (36,399) |
| State: | 5.1% (72,746) |
Number of households with income $10k - 20k:| Enfield: | 5.8% (41,045) |
| Connecticut: | 5.7% (81,643) |
Number of households with income $20k - 30k:| Enfield: | 6.6% (46,459) |
| Connecticut: | 6.5% (92,844) |
Number of households with income $30k - 40k:| Enfield: | 5.9% (41,694) |
| Connecticut: | 5.9% (83,934) |
Number of households with income $40k - 50k:| Enfield: | 5.9% (41,427) |
| Connecticut: | 5.8% (83,025) |
Number of households with income $50k - 60k:| Enfield: | 5.8% (40,621) |
| State: | 5.7% (81,788) |
Number of households with income $60k - 75k:| Enfield: | 8.1% (56,916) |
| State: | 8.1% (115,651) |
Number of households with income $75k - 100k:| Enfield: | 12.6% (88,889) |
| State: | 12.6% (180,173) |
Number of households with income $100k - 125k:| Enfield: | 9.8% (69,200) |
| State: | 9.9% (141,231) |
Number of households with income $125k - 150k:| Enfield: | 7.8% (55,262) |
| State: | 7.9% (112,826) |
Number of households with income $150k - 200k:| Enfield: | 10.7% (75,595) |
| State: | 10.8% (154,641) |
Number of households with income > $200k:| Enfield: | 16.0% (112,934) |
| State: | 16.3% (233,133) |
Aggregate household income in Enfield in 2022: $41,046,558,747
Median family income in Enfield in 2022:| Enfield: | $108,103 |
| Connecticut: | $115,183 |
Median non-family income in Enfield in 2022:| Enfield: | $58,950 |
| Connecticut: | $50,964 |
Change in median non-family income between 2000 and 2022:| Enfield, Connecticut: | +71.5% |
| State: | +65.1% |
Median per capita income in Enfield in 2022:| Enfield: | $40,184 |
| State: | $51,581 |
Change in median per capita income between 2000 and 2022:| Enfield, Connecticut: | +82.9% |
| State: | +79.3% |
Income statistics for White residents
Median household income in Enfield, CT in 2022:| Enfield: | $89,716 |
| Connecticut: | $96,890 |
Change in median household income between 2000 and 2022:| Enfield, Connecticut: | +69.4% |
| State: | +68.5% |
Number of households with income < $10k:| Enfield: | 4.2% (19,623) |
| State: | 4.2% (42,265) |
Number of households with income $10k - 20k:| Enfield: | 4.9% (22,560) |
| State: | 4.8% (48,323) |
Number of households with income $20k - 30k:| Enfield: | 5.8% (26,830) |
| Connecticut: | 5.7% (57,716) |
Number of households with income $30k - 40k:| Enfield: | 5.4% (24,835) |
| State: | 5.3% (53,827) |
Number of households with income $40k - 50k:| Enfield: | 5.3% (24,732) |
| Connecticut: | 5.3% (53,301) |
Number of households with income $50k - 60k:| Enfield: | 5.6% (25,739) |
| State: | 5.5% (55,690) |
Number of households with income $60k - 75k:| Enfield: | 7.9% (36,783) |
| State: | 8.0% (80,329) |
Number of households with income $75k - 100k:| Enfield: | 12.7% (58,940) |
| State: | 12.7% (128,070) |
Number of households with income $100k - 125k:| Enfield: | 10.0% (46,282) |
| State: | 10.0% (101,210) |
Number of households with income $125k - 150k:| Enfield: | 8.0% (37,156) |
| State: | 8.0% (81,250) |
Number of households with income $150k - 200k:| Enfield: | 11.8% (54,635) |
| State: | 11.8% (119,527) |
Number of households with income > $200k:| Enfield: | 18.4% (85,528) |
| State: | 18.6% (187,875) |
Aggregate household income in Enfield in 2022: $30,213,406,714
Median family income in Enfield in 2022:| Enfield: | $111,350 |
| Connecticut: | $128,955 |
Number of families with income < $10k:| Enfield: | 4.0% (273) |
| State: | 1.9% (11,537) |
Number of families with income $10k - 20k:| Enfield: | 2.7% (182) |
| Connecticut: | 1.8% (11,289) |
Number of families with income $20k - 30k:| Enfield: | 4.6% (317) |
| State: | 3.0% (18,506) |
Number of families with income $30k - 40k:| Enfield: | 5.7% (394) |
| Connecticut: | 2.9% (18,160) |
Number of families with income $40k - 50k:| Enfield: | 7.8% (536) |
| State: | 3.9% (24,550) |
Number of families with income $50k - 60k:| Enfield: | 7.0% (478) |
| State: | 4.3% (26,723) |
Number of families with income $60k - 75k:| Enfield: | 13.9% (950) |
| State: | 7.1% (44,075) |
Number of families with income $75k - 100k:| Enfield: | 18.9% (1,295) |
| State: | 12.5% (77,679) |
Number of families with income $100k - 125k:| Enfield: | 12.1% (828) |
| State: | 11.1% (69,086) |
Number of families with income $125k - 150k:| Enfield: | 6.0% (414) |
| State: | 9.6% (59,616) |
Number of families with income $150k - 200k:| Enfield: | 11.9% (819) |
| Connecticut: | 15.7% (97,890) |
Number of families with income > $200k:| Enfield: | 5.4% (372) |
| State: | 26.3% (163,417) |
Median non-family income in Enfield in 2022:| Enfield: | $58,678 |
| State: | $54,067 |
Change in median non-family income between 2000 and 2022:| Enfield, Connecticut: | +73.7% |
| State: | +68.7% |
Median per capita income in Enfield in 2022:| Enfield: | $44,691 |
| Connecticut: | $59,916 |
Change in median per capita income between 2000 and 2022:| Enfield, Connecticut: | +92.1% |
| State: | +90.2% |
Income statistics for Black or African American residents
Median household income in Enfield, CT in 2022:| Enfield: | $68,077 |
| State: | $61,803 |
Change in median household income between 2000 and 2022:| Enfield, Connecticut: | +60.9% |
| State: | +76.1% |
Number of households with income < $10k:| Enfield: | 6.8% (11,442) |
| State: | 6.8% (9,494) |
Number of households with income $10k - 20k:| Enfield: | 7.9% (13,261) |
| State: | 7.9% (11,003) |
Number of households with income $20k - 30k:| Enfield: | 10.8% (18,132) |
| State: | 10.8% (15,045) |
Number of households with income $30k - 40k:| Enfield: | 8.2% (13,861) |
| Connecticut: | 8.2% (11,501) |
Number of households with income $40k - 50k:| Enfield: | 7.4% (12,554) |
| Connecticut: | 7.4% (10,416) |
Number of households with income $50k - 60k:| Enfield: | 7.5% (12,696) |
| State: | 7.5% (10,534) |
Number of households with income $60k - 75k:| Enfield: | 8.0% (13,551) |
| State: | 8.0% (11,244) |
Number of households with income $75k - 100k:| Enfield: | 9.6% (16,114) |
| State: | 9.6% (13,370) |
Number of households with income $100k - 125k:| Enfield: | 10.2% (17,167) |
| State: | 10.2% (14,244) |
Number of households with income $125k - 150k:| Enfield: | 8.0% (13,554) |
| State: | 8.0% (11,246) |
Number of households with income $150k - 200k:| Enfield: | 7.7% (12,928) |
| State: | 7.7% (10,727) |
Number of households with income > $200k:| Enfield: | 7.9% (13,361) |
| State: | 7.9% (11,086) |
Aggregate household income in Enfield in 2022: $66,039,025
Median family income in Enfield in 2022:| Enfield: | $88,532 |
| Connecticut: | $87,228 |
Number of families with income < $10k:| Enfield: | 1.8% (2) |
| State: | 3.8% (3,184) |
Number of families with income $10k - 20k:| Enfield: | 17.6% (23) |
| Connecticut: | 4.8% (4,026) |
Number of families with income $20k - 30k:| Enfield: | 1.8% (2) |
| State: | 6.0% (5,015) |
Number of families with income $30k - 40k:| Enfield: | 17.9% (24) |
| State: | 7.7% (6,445) |
Number of families with income $40k - 50k:| Enfield: | 11.5% (15) |
| State: | 6.6% (5,531) |
Number of families with income $50k - 60k:| Enfield: | 4.0% (5) |
| State: | 5.4% (4,480) |
Number of families with income $60k - 75k:| Enfield: | 17.9% (23) |
| Connecticut: | 8.2% (6,861) |
Number of families with income $75k - 100k:| Enfield: | 19.4% (26) |
| State: | 12.7% (10,598) |
Number of families with income $100k - 125k:| Enfield: | 8.2% (11) |
| State: | 11.4% (9,482) |
Median non-family income in Enfield in 2022:| Enfield: | $73,280 |
| Connecticut: | $38,608 |
Change in median non-family income between 2000 and 2022:| Enfield, Connecticut: | +77.0% |
| State: | +77.0% |
Median per capita income in Enfield in 2022:| Enfield: | $20,906 |
| State: | $36,289 |
Change in median per capita income between 2000 and 2022:| Enfield, Connecticut: | +115.2% |
| State: | +117.5% |
Income statistics for Asian residents
Median household income in Enfield, CT in 2022:| Enfield: | $109,474 |
| Connecticut: | $110,568 |
Change in median household income between 2000 and 2022:| Enfield, Connecticut: | +110.1% |
| State: | +79.5% |
Number of households with income < $10k:| Enfield: | 7.1% (3,592) |
| State: | 7.1% (4,245) |
Number of households with income $10k - 20k:| Enfield: | 3.5% (1,765) |
| State: | 3.5% (2,087) |
Number of households with income $20k - 30k:| Enfield: | 4.1% (2,085) |
| Connecticut: | 4.1% (2,464) |
Number of households with income $30k - 40k:| Enfield: | 4.1% (2,096) |
| State: | 4.1% (2,478) |
Number of households with income $40k - 50k:| Enfield: | 3.3% (1,677) |
| State: | 3.3% (1,983) |
Number of households with income $50k - 60k:| Enfield: | 3.9% (1,970) |
| State: | 3.9% (2,328) |
Number of households with income $60k - 75k:| Enfield: | 7.0% (3,577) |
| State: | 7.0% (4,228) |
Number of households with income $75k - 100k:| Enfield: | 11.5% (5,847) |
| State: | 11.5% (6,911) |
Number of households with income $100k - 125k:| Enfield: | 10.2% (5,184) |
| Connecticut: | 10.2% (6,127) |
Number of households with income $125k - 150k:| Enfield: | 8.5% (4,297) |
| Connecticut: | 8.5% (5,079) |
Number of households with income $150k - 200k:| Enfield: | 12.4% (6,290) |
| Connecticut: | 12.4% (7,434) |
Number of households with income > $200k:| Enfield: | 24.4% (12,405) |
| State: | 24.4% (14,661) |
Aggregate household income in Enfield in 2022: $46,170,104
Median family income in Enfield in 2022:| Enfield: | $128,583 |
| Connecticut: | $134,548 |
Number of families with income $20k - 30k:| Enfield: | 2.6% (4) |
| State: | 3.8% (1,682) |
Number of families with income $30k - 40k:| Enfield: | 11.4% (18) |
| State: | 3.8% (1,652) |
Number of families with income $40k - 50k:| Enfield: | 2.9% (5) |
| Connecticut: | 2.0% (863) |
Number of families with income $50k - 60k:| Enfield: | 15.1% (24) |
| State: | 3.7% (1,635) |
Number of families with income $60k - 75k:| Enfield: | 16.8% (26) |
| Connecticut: | 6.0% (2,651) |
Number of families with income $75k - 100k:| Enfield: | 9.8% (15) |
| State: | 11.0% (4,844) |
Number of families with income $100k - 125k:| Enfield: | 29.3% (46) |
| State: | 10.5% (4,621) |
Number of families with income $150k - 200k:| Enfield: | 12.2% (19) |
| State: | 14.2% (6,237) |
Median non-family income in Enfield in 2022:| Enfield: | $80,346 |
| State: | $63,785 |
Change in median non-family income between 2000 and 2022:| Enfield, Connecticut: | +148.6% |
| State: | +77.9% |
Median per capita income in Enfield in 2022:| Enfield: | $40,885 |
| State: | $55,295 |
Change in median per capita income between 2000 and 2022:| Enfield, Connecticut: | +103.6% |
| Connecticut: | +97.8% |
Income statistics for Hispanic or Latino residents
Median household income in Enfield, CT in 2022:| Enfield: | $95,014 |
| State: | $60,275 |
Change in median household income between 2000 and 2022:| Enfield, Connecticut: | +67.8% |
| State: | +87.9% |
Number of households with income < $10k:| Enfield: | 8.7% (32,808) |
| State: | 8.7% (18,584) |
Number of households with income $10k - 20k:| Enfield: | 9.1% (33,958) |
| State: | 9.1% (19,235) |
Number of households with income $20k - 30k:| Enfield: | 8.9% (33,523) |
| State: | 8.9% (18,989) |
Number of households with income $30k - 40k:| Enfield: | 7.5% (28,188) |
| State: | 7.5% (15,967) |
Number of households with income $40k - 50k:| Enfield: | 8.7% (32,599) |
| Connecticut: | 8.7% (18,466) |
Number of households with income $50k - 60k:| Enfield: | 6.9% (25,962) |
| Connecticut: | 6.9% (14,706) |
Number of households with income $60k - 75k:| Enfield: | 8.9% (33,345) |
| State: | 8.9% (18,888) |
Number of households with income $75k - 100k:| Enfield: | 13.5% (50,612) |
| Connecticut: | 13.5% (28,669) |
Number of households with income $100k - 125k:| Enfield: | 8.2% (30,778) |
| State: | 8.2% (17,434) |
Number of households with income $125k - 150k:| Enfield: | 6.5% (24,278) |
| State: | 6.5% (13,752) |
Number of households with income $150k - 200k:| Enfield: | 6.6% (24,917) |
| State: | 6.6% (14,114) |
Number of households with income > $200k:| Enfield: | 6.4% (24,062) |
| State: | 6.4% (13,630) |
Aggregate household income in Enfield in 2022: $98,354,645
Median family income in Enfield in 2022:| Enfield: | $94,522 |
| State: | $68,336 |
Number of families with income < $10k:| Enfield: | 6.3% (135) |
| Connecticut: | 5.2% (7,456) |
Number of families with income $10k - 20k:| Enfield: | 6.5% (139) |
| State: | 6.0% (8,616) |
Number of families with income $20k - 30k:| Enfield: | 11.3% (242) |
| State: | 8.9% (12,680) |
Number of families with income $30k - 40k:| Enfield: | 10.7% (228) |
| State: | 8.5% (12,090) |
Number of families with income $40k - 50k:| Enfield: | 12.8% (275) |
| State: | 8.8% (12,624) |
Number of families with income $50k - 60k:| Enfield: | 10.4% (223) |
| State: | 8.4% (11,924) |
Number of families with income $60k - 75k:| Enfield: | 11.8% (252) |
| State: | 8.9% (12,677) |
Number of families with income $75k - 100k:| Enfield: | 15.9% (341) |
| State: | 14.3% (20,457) |
Number of families with income $100k - 125k:| Enfield: | 6.2% (132) |
| Connecticut: | 8.2% (11,720) |
Number of families with income $125k - 150k:| Enfield: | 3.6% (77) |
| State: | 8.2% (11,729) |
Number of families with income $150k - 200k:| Enfield: | 3.6% (77) |
| State: | 7.1% (10,096) |
Number of families with income > $200k:| Enfield: | 0.9% (19) |
| State: | 7.4% (10,622) |
Median non-family income in Enfield in 2022:| Enfield: | $100,345 |
| State: | $36,714 |
Change in median non-family income between 2000 and 2022:| Enfield, Connecticut: | +73.9% |
| State: | +90.0% |
Median per capita income in Enfield in 2022:| Enfield: | $19,937 |
| State: | $28,507 |
Change in median per capita income between 2000 and 2022:| Enfield, Connecticut: | +80.3% |
| Connecticut: | +117.2% |
Income statistics for American Indian and Alaska Native residents
Number of households with income < $10k:| Enfield: | 8.4% (111,278) |
| State: | 10.2% (340) |
Number of households with income $10k - 20k:| Enfield: | 9.4% (124,183) |
| State: | 8.5% (283) |
Number of households with income $20k - 30k:| Enfield: | 8.5% (112,325) |
| State: | 9.4% (314) |
Number of households with income $30k - 40k:| Enfield: | 9.1% (120,343) |
| State: | 10.1% (337) |
Number of households with income $40k - 50k:| Enfield: | 8.3% (110,387) |
| State: | 13.4% (447) |
Number of households with income $50k - 60k:| Enfield: | 7.8% (104,085) |
| Connecticut: | 3.1% (104) |
Number of households with income $60k - 75k:| Enfield: | 9.8% (129,738) |
| State: | 5.6% (188) |
Number of households with income $75k - 100k:| Enfield: | 12.6% (167,471) |
| Connecticut: | 13.4% (447) |
Number of households with income $100k - 125k:| Enfield: | 9.4% (125,235) |
| Connecticut: | 9.5% (317) |
Number of households with income $125k - 150k:| Enfield: | 5.6% (74,977) |
| State: | 3.9% (131) |
Number of households with income $150k - 200k:| Enfield: | 6.0% (79,041) |
| Connecticut: | 6.3% (212) |
Number of households with income > $200k:| Enfield: | 5.2% (68,414) |
| State: | 6.8% (228) |
Median per capita income in Enfield in 2022:| Enfield: | $24,053 |
| State: | $25,355 |
Change in median per capita income between 2000 and 2022:| Enfield, Connecticut: | +45.9% |
| State: | +39.4% |
Income statistics for Multirace residents
Median household income in Enfield, CT in 2022:| Enfield: | $132,489 |
| State: | $77,277 |
Change in median household income between 2000 and 2022:| Enfield, Connecticut: | +119.4% |
| State: | +113.6% |
Number of households with income < $10k:| Enfield: | 6.0% (12,442) |
| State: | 6.0% (7,457) |
Number of households with income $10k - 20k:| Enfield: | 8.1% (16,917) |
| State: | 8.1% (10,139) |
Number of households with income $20k - 30k:| Enfield: | 7.0% (14,519) |
| State: | 7.0% (8,702) |
Number of households with income $30k - 40k:| Enfield: | 6.9% (14,258) |
| State: | 6.9% (8,546) |
Number of households with income $40k - 50k:| Enfield: | 7.0% (14,536) |
| Connecticut: | 7.0% (8,712) |
Number of households with income $50k - 60k:| Enfield: | 5.9% (12,232) |
| State: | 5.9% (7,331) |
Number of households with income $60k - 75k:| Enfield: | 8.5% (17,742) |
| State: | 8.5% (10,634) |
Number of households with income $75k - 100k:| Enfield: | 14.1% (29,365) |
| State: | 14.1% (17,600) |
Number of households with income $100k - 125k:| Enfield: | 9.9% (20,661) |
| State: | 9.9% (12,383) |
Number of households with income $125k - 150k:| Enfield: | 7.2% (14,884) |
| State: | 7.2% (8,921) |
Number of households with income $150k - 200k:| Enfield: | 8.8% (18,223) |
| State: | 8.8% (10,922) |
Number of households with income > $200k:| Enfield: | 10.6% (22,102) |
| State: | 10.6% (13,247) |
Aggregate household income in Enfield in 2022: $130,004,078
Median family income in Enfield in 2022:| Enfield: | $129,649 |
| State: | $84,255 |
Number of families with income $10k - 20k:| Enfield: | 6.7% (36) |
| State: | 4.8% (4,079) |
Number of families with income $20k - 30k:| Enfield: | 5.1% (28) |
| State: | 6.9% (5,812) |
Number of families with income $40k - 50k:| Enfield: | 10.2% (55) |
| State: | 6.9% (5,792) |
Number of families with income $50k - 60k:| Enfield: | 12.8% (69) |
| State: | 7.6% (6,420) |
Number of families with income $60k - 75k:| Enfield: | 27.8% (149) |
| State: | 7.8% (6,550) |
Number of families with income $75k - 100k:| Enfield: | 21.3% (114) |
| State: | 14.5% (12,236) |
Number of families with income $125k - 150k:| Enfield: | 16.2% (86) |
| Connecticut: | 8.9% (7,503) |
Median non-family income in Enfield in 2022:| Enfield: | $75,577 |
| State: | $44,462 |
Change in median non-family income between 2000 and 2022:| Enfield, Connecticut: | +81.0% |
| State: | +97.6% |
Median per capita income in Enfield in 2022:| Enfield: | $19,227 |
| State: | $32,794 |
Change in median per capita income between 2000 and 2022:| Enfield, Connecticut: | +95.5% |
| State: | +117.2% |
Income statistics for other residents
Number of households with income < $10k:| Enfield: | 9.1% (5) |
| State: | 9.0% (8,596) |
Number of households with income $10k - 20k:| Enfield: | 10.9% (6) |
| State: | 10.2% (9,773) |
Number of households with income $20k - 30k:| Enfield: | 9.1% (5) |
| State: | 9.1% (8,691) |
Number of households with income $30k - 40k:| Enfield: | 7.3% (4) |
| State: | 7.8% (7,447) |
Number of households with income $40k - 50k:| Enfield: | 9.1% (5) |
| State: | 8.2% (7,860) |
Number of households with income $50k - 60k:| Enfield: | 5.5% (3) |
| Connecticut: | 6.0% (5,757) |
Number of households with income $60k - 75k:| Enfield: | 9.1% (5) |
| State: | 9.3% (8,942) |
Number of households with income $75k - 100k:| Enfield: | 14.5% (8) |
| State: | 14.3% (13,700) |
Number of households with income $100k - 125k:| Enfield: | 7.3% (4) |
| State: | 7.2% (6,906) |
Number of households with income $125k - 150k:| Enfield: | 7.3% (4) |
| Connecticut: | 6.5% (6,215) |
Number of households with income $150k - 200k:| Enfield: | 5.5% (3) |
| State: | 6.1% (5,865) |
Number of households with income > $200k:| Enfield: | 5.5% (3) |
| State: | 6.3% (6,065) |
Aggregate household income in Enfield in 2022: $7,651,743
Median family income in Enfield in 2022:| Enfield: | $34,514 |
| State: | $67,610 |
Number of families with income < $10k:| Enfield: | 12.5% (3) |
| Connecticut: | 5.0% (3,311) |
Number of families with income $10k - 20k:| Enfield: | 26.4% (7) |
| State: | 7.5% (4,961) |
Number of families with income $20k - 30k:| Enfield: | 15.2% (4) |
| Connecticut: | 8.7% (5,752) |
Number of families with income $50k - 60k:| Enfield: | 45.9% (13) |
| State: | 5.9% (3,868) |
Median non-family income in Enfield in 2022:| Enfield: | $138,622 |
| State: | $34,285 |
Change in median non-family income between 2000 and 2022:| Enfield, Connecticut: | +83.6% |
| State: | +83.6% |
Median per capita income in Enfield in 2022:| Enfield: | $17,550 |
| State: | $29,353 |