East Lyme, Connecticut (CT) income map, earnings map, and wages data
The median household income in East Lyme, CT in 2022 was $112,593, which was 21.5% greater than the median annual income of $88,429 across the entire state of Connecticut. Compared to the median income of $66,539 in 2000 this represents an increase of 40.9%. The per capita income in 2022 was $52,619, which means an increase of 45.3% compared to 2000 when it was $28,765.
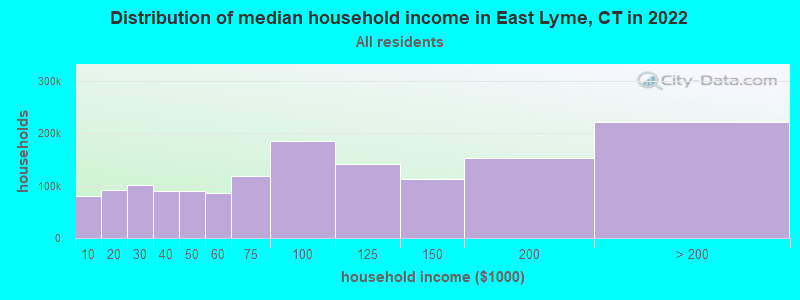
Income statistics for all residents
Median household income in East Lyme, CT in 2022:| East Lyme: | $112,593 |
| State: | $88,429 |
Change in median household income between 2000 and 2022:| East Lyme, Connecticut: | +69.2% |
| State: | +64.0% |
Number of households with income < $10k:| East Lyme: | 5.2% (45,861) |
| Connecticut: | 5.1% (72,746) |
Number of households with income $10k - 20k:| East Lyme: | 5.8% (51,715) |
| State: | 5.7% (81,643) |
Number of households with income $20k - 30k:| East Lyme: | 6.6% (58,537) |
| State: | 6.5% (92,844) |
Number of households with income $30k - 40k:| East Lyme: | 5.9% (52,533) |
| State: | 5.9% (83,934) |
Number of households with income $40k - 50k:| East Lyme: | 5.9% (52,196) |
| Connecticut: | 5.8% (83,025) |
Number of households with income $50k - 60k:| East Lyme: | 5.8% (51,182) |
| State: | 5.7% (81,788) |
Number of households with income $60k - 75k:| East Lyme: | 8.1% (71,712) |
| Connecticut: | 8.1% (115,651) |
Number of households with income $75k - 100k:| East Lyme: | 12.6% (111,998) |
| Connecticut: | 12.6% (180,173) |
Number of households with income $100k - 125k:| East Lyme: | 9.8% (87,189) |
| State: | 9.9% (141,231) |
Number of households with income $125k - 150k:| East Lyme: | 7.8% (69,629) |
| Connecticut: | 7.9% (112,826) |
Number of households with income $150k - 200k:| East Lyme: | 10.7% (95,247) |
| State: | 10.8% (154,641) |
Number of households with income > $200k:| East Lyme: | 16.0% (142,293) |
| State: | 16.3% (233,133) |
Aggregate household income in East Lyme in 2022: $21,366,903,754
Median family income in East Lyme in 2022:| East Lyme: | $132,931 |
| State: | $115,183 |
Median non-family income in East Lyme in 2022:| East Lyme: | $59,586 |
| Connecticut: | $50,964 |
Change in median non-family income between 2000 and 2022:| East Lyme, Connecticut: | +71.5% |
| Connecticut: | +65.1% |
Median per capita income in East Lyme in 2022:| East Lyme: | $52,620 |
| Connecticut: | $51,581 |
Change in median per capita income between 2000 and 2022:| East Lyme, Connecticut: | +82.9% |
| Connecticut: | +79.3% |
Income statistics for White residents
Median household income in East Lyme, CT in 2022:| East Lyme: | $112,635 |
| State: | $96,890 |
Change in median household income between 2000 and 2022:| East Lyme, Connecticut: | +69.4% |
| State: | +68.5% |
Number of households with income < $10k:| East Lyme: | 4.2% (24,636) |
| State: | 4.2% (42,265) |
Number of households with income $10k - 20k:| East Lyme: | 4.9% (28,323) |
| State: | 4.8% (48,323) |
Number of households with income $20k - 30k:| East Lyme: | 5.8% (33,684) |
| State: | 5.7% (57,716) |
Number of households with income $30k - 40k:| East Lyme: | 5.4% (31,180) |
| State: | 5.3% (53,827) |
Number of households with income $40k - 50k:| East Lyme: | 5.3% (31,051) |
| State: | 5.3% (53,301) |
Number of households with income $50k - 60k:| East Lyme: | 5.6% (32,314) |
| Connecticut: | 5.5% (55,690) |
Number of households with income $60k - 75k:| East Lyme: | 7.9% (46,179) |
| Connecticut: | 8.0% (80,329) |
Number of households with income $75k - 100k:| East Lyme: | 12.7% (73,996) |
| State: | 12.7% (128,070) |
Number of households with income $100k - 125k:| East Lyme: | 10.0% (58,105) |
| State: | 10.0% (101,210) |
Number of households with income $125k - 150k:| East Lyme: | 8.0% (46,648) |
| State: | 8.0% (81,250) |
Number of households with income $150k - 200k:| East Lyme: | 11.8% (68,591) |
| State: | 11.8% (119,527) |
Number of households with income > $200k:| East Lyme: | 18.4% (107,377) |
| State: | 18.6% (187,875) |
Aggregate household income in East Lyme in 2022: $15,300,167,529
Median family income in East Lyme in 2022:| East Lyme: | $136,085 |
| State: | $128,955 |
Number of families with income < $10k:| East Lyme: | 1.4% (51) |
| State: | 1.9% (11,537) |
Number of families with income $10k - 20k:| East Lyme: | 1.8% (65) |
| State: | 1.8% (11,289) |
Number of families with income $20k - 30k:| East Lyme: | 2.3% (84) |
| Connecticut: | 3.0% (18,506) |
Number of families with income $30k - 40k:| East Lyme: | 2.4% (88) |
| State: | 2.9% (18,160) |
Number of families with income $40k - 50k:| East Lyme: | 2.8% (103) |
| State: | 3.9% (24,550) |
Number of families with income $50k - 60k:| East Lyme: | 4.5% (166) |
| Connecticut: | 4.3% (26,723) |
Number of families with income $60k - 75k:| East Lyme: | 9.9% (367) |
| State: | 7.1% (44,075) |
Number of families with income $75k - 100k:| East Lyme: | 15.2% (562) |
| Connecticut: | 12.5% (77,679) |
Number of families with income $100k - 125k:| East Lyme: | 14.7% (543) |
| State: | 11.1% (69,086) |
Number of families with income $125k - 150k:| East Lyme: | 8.5% (316) |
| Connecticut: | 9.6% (59,616) |
Number of families with income $150k - 200k:| East Lyme: | 15.1% (560) |
| Connecticut: | 15.7% (97,890) |
Number of families with income > $200k:| East Lyme: | 21.6% (799) |
| State: | 26.3% (163,417) |
Median non-family income in East Lyme in 2022:| East Lyme: | $60,673 |
| State: | $54,067 |
Change in median non-family income between 2000 and 2022:| East Lyme, Connecticut: | +73.7% |
| State: | +68.7% |
Median per capita income in East Lyme in 2022:| East Lyme: | $58,141 |
| State: | $59,916 |
Change in median per capita income between 2000 and 2022:| East Lyme, Connecticut: | +92.1% |
| State: | +90.2% |
Income statistics for Black or African American residents
Median household income in East Lyme, CT in 2022:| East Lyme: | $110,122 |
| State: | $61,803 |
Change in median household income between 2000 and 2022:| East Lyme, Connecticut: | +60.9% |
| Connecticut: | +76.1% |
Number of households with income < $10k:| East Lyme: | 6.8% (18,509) |
| Connecticut: | 6.8% (9,494) |
Number of households with income $10k - 20k:| East Lyme: | 7.9% (21,451) |
| Connecticut: | 7.9% (11,003) |
Number of households with income $20k - 30k:| East Lyme: | 10.8% (29,331) |
| State: | 10.8% (15,045) |
Number of households with income $30k - 40k:| East Lyme: | 8.2% (22,423) |
| Connecticut: | 8.2% (11,501) |
Number of households with income $40k - 50k:| East Lyme: | 7.4% (20,307) |
| State: | 7.4% (10,416) |
Number of households with income $50k - 60k:| East Lyme: | 7.5% (20,537) |
| Connecticut: | 7.5% (10,534) |
Number of households with income $60k - 75k:| East Lyme: | 8.0% (21,921) |
| State: | 8.0% (11,244) |
Number of households with income $75k - 100k:| East Lyme: | 9.6% (26,066) |
| State: | 9.6% (13,370) |
Number of households with income $100k - 125k:| East Lyme: | 10.2% (27,770) |
| State: | 10.2% (14,244) |
Number of households with income $125k - 150k:| East Lyme: | 8.0% (21,925) |
| Connecticut: | 8.0% (11,246) |
Number of households with income $150k - 200k:| East Lyme: | 7.7% (20,913) |
| State: | 7.7% (10,727) |
Number of households with income > $200k:| East Lyme: | 7.9% (21,613) |
| State: | 7.9% (11,086) |
Aggregate household income in East Lyme in 2022: $43,682,766
Median family income in East Lyme in 2022:| East Lyme: | $150,679 |
| State: | $87,228 |
Number of families with income $10k - 20k:| East Lyme: | 3.5% (5) |
| State: | 4.8% (4,026) |
Number of families with income $20k - 30k:| East Lyme: | 3.7% (6) |
| State: | 6.0% (5,015) |
Number of families with income $40k - 50k:| East Lyme: | 5.4% (8) |
| State: | 6.6% (5,531) |
Number of families with income $60k - 75k:| East Lyme: | 4.6% (7) |
| Connecticut: | 8.2% (6,861) |
Number of families with income $75k - 100k:| East Lyme: | 6.5% (10) |
| State: | 12.7% (10,598) |
Number of families with income $100k - 125k:| East Lyme: | 5.3% (8) |
| State: | 11.4% (9,482) |
Number of families with income > $200k:| East Lyme: | 70.8% (108) |
| Connecticut: | 10.8% (9,057) |
Median non-family income in East Lyme in 2022:| East Lyme: | $129,416 |
| Connecticut: | $38,608 |
Change in median non-family income between 2000 and 2022:| East Lyme, Connecticut: | +77.0% |
| Connecticut: | +77.0% |
Median per capita income in East Lyme in 2022:| East Lyme: | $36,008 |
| Connecticut: | $36,289 |
Change in median per capita income between 2000 and 2022:| East Lyme, Connecticut: | +115.2% |
| State: | +117.5% |
Income statistics for Asian residents
Median household income in East Lyme, CT in 2022:| East Lyme: | $190,127 |
| State: | $110,568 |
Change in median household income between 2000 and 2022:| East Lyme, Connecticut: | +110.1% |
| State: | +79.5% |
Number of households with income < $10k:| East Lyme: | 7.1% (6,238) |
| State: | 7.1% (4,245) |
Number of households with income $10k - 20k:| East Lyme: | 3.5% (3,067) |
| State: | 3.5% (2,087) |
Number of households with income $20k - 30k:| East Lyme: | 4.1% (3,621) |
| State: | 4.1% (2,464) |
Number of households with income $30k - 40k:| East Lyme: | 4.1% (3,641) |
| State: | 4.1% (2,478) |
Number of households with income $40k - 50k:| East Lyme: | 3.3% (2,914) |
| Connecticut: | 3.3% (1,983) |
Number of households with income $50k - 60k:| East Lyme: | 3.9% (3,421) |
| Connecticut: | 3.9% (2,328) |
Number of households with income $60k - 75k:| East Lyme: | 7.0% (6,213) |
| State: | 7.0% (4,228) |
Number of households with income $75k - 100k:| East Lyme: | 11.5% (10,155) |
| State: | 11.5% (6,911) |
Number of households with income $100k - 125k:| East Lyme: | 10.2% (9,003) |
| State: | 10.2% (6,127) |
Number of households with income $125k - 150k:| East Lyme: | 8.5% (7,463) |
| Connecticut: | 8.5% (5,079) |
Number of households with income $150k - 200k:| East Lyme: | 12.4% (10,924) |
| State: | 12.4% (7,434) |
Number of households with income > $200k:| East Lyme: | 24.4% (21,544) |
| State: | 24.4% (14,661) |
Aggregate household income in East Lyme in 2022: $82,441,187
Median family income in East Lyme in 2022:| East Lyme: | $197,736 |
| State: | $134,548 |
Number of families with income < $10k:| East Lyme: | 2.7% (11) |
| Connecticut: | 4.3% (1,875) |
Number of families with income $20k - 30k:| East Lyme: | 1.8% (7) |
| State: | 3.8% (1,682) |
Number of families with income $30k - 40k:| East Lyme: | 2.5% (10) |
| Connecticut: | 3.8% (1,652) |
Number of families with income $50k - 60k:| East Lyme: | 3.3% (13) |
| State: | 3.7% (1,635) |
Number of families with income $60k - 75k:| East Lyme: | 5.7% (22) |
| State: | 6.0% (2,651) |
Number of families with income $75k - 100k:| East Lyme: | 10.3% (41) |
| State: | 11.0% (4,844) |
Number of families with income $100k - 125k:| East Lyme: | 6.4% (26) |
| State: | 10.5% (4,621) |
Number of families with income $125k - 150k:| East Lyme: | 21.6% (86) |
| State: | 8.2% (3,588) |
Number of families with income $150k - 200k:| East Lyme: | 9.6% (38) |
| State: | 14.2% (6,237) |
Number of families with income > $200k:| East Lyme: | 36.1% (143) |
| State: | 30.8% (13,522) |
Median non-family income in East Lyme in 2022:| East Lyme: | $156,779 |
| Connecticut: | $63,785 |
Change in median non-family income between 2000 and 2022:| East Lyme, Connecticut: | +148.6% |
| State: | +77.9% |
Median per capita income in East Lyme in 2022:| East Lyme: | $69,505 |
| Connecticut: | $55,295 |
Change in median per capita income between 2000 and 2022:| East Lyme, Connecticut: | +103.6% |
| State: | +97.8% |
Income statistics for Hispanic or Latino residents
Median household income in East Lyme, CT in 2022:| East Lyme: | $58,728 |
| Connecticut: | $60,275 |
Change in median household income between 2000 and 2022:| East Lyme, Connecticut: | +67.8% |
| State: | +87.9% |
Number of households with income < $10k:| East Lyme: | 8.7% (20,279) |
| State: | 8.7% (18,584) |
Number of households with income $10k - 20k:| East Lyme: | 9.1% (20,990) |
| State: | 9.1% (19,235) |
Number of households with income $20k - 30k:| East Lyme: | 8.9% (20,720) |
| State: | 8.9% (18,989) |
Number of households with income $30k - 40k:| East Lyme: | 7.5% (17,424) |
| State: | 7.5% (15,967) |
Number of households with income $40k - 50k:| East Lyme: | 8.7% (20,150) |
| State: | 8.7% (18,466) |
Number of households with income $50k - 60k:| East Lyme: | 6.9% (16,047) |
| Connecticut: | 6.9% (14,706) |
Number of households with income $60k - 75k:| East Lyme: | 8.9% (20,610) |
| State: | 8.9% (18,888) |
Number of households with income $75k - 100k:| East Lyme: | 13.5% (31,283) |
| State: | 13.5% (28,669) |
Number of households with income $100k - 125k:| East Lyme: | 8.2% (19,024) |
| State: | 8.2% (17,434) |
Number of households with income $125k - 150k:| East Lyme: | 6.5% (15,006) |
| Connecticut: | 6.5% (13,752) |
Number of households with income $150k - 200k:| East Lyme: | 6.6% (15,401) |
| State: | 6.6% (14,114) |
Number of households with income > $200k:| East Lyme: | 6.4% (14,873) |
| State: | 6.4% (13,630) |
Aggregate household income in East Lyme in 2022: $14,901,521
Median family income in East Lyme in 2022:| East Lyme: | $64,869 |
| State: | $68,336 |
Number of families with income < $10k:| East Lyme: | 3.2% (26) |
| State: | 5.2% (7,456) |
Number of families with income $10k - 20k:| East Lyme: | 6.5% (53) |
| State: | 6.0% (8,616) |
Number of families with income $20k - 30k:| East Lyme: | 7.9% (64) |
| State: | 8.9% (12,680) |
Number of families with income $30k - 40k:| East Lyme: | 5.9% (48) |
| Connecticut: | 8.5% (12,090) |
Number of families with income $40k - 50k:| East Lyme: | 6.6% (53) |
| Connecticut: | 8.8% (12,624) |
Number of families with income $50k - 60k:| East Lyme: | 9.6% (78) |
| State: | 8.4% (11,924) |
Number of families with income $60k - 75k:| East Lyme: | 12.1% (99) |
| State: | 8.9% (12,677) |
Number of families with income $75k - 100k:| East Lyme: | 18.1% (147) |
| State: | 14.3% (20,457) |
Number of families with income $100k - 125k:| East Lyme: | 10.7% (87) |
| State: | 8.2% (11,720) |
Number of families with income $125k - 150k:| East Lyme: | 7.4% (60) |
| State: | 8.2% (11,729) |
Number of families with income $150k - 200k:| East Lyme: | 6.5% (53) |
| State: | 7.1% (10,096) |
Number of families with income > $200k:| East Lyme: | 5.5% (45) |
| State: | 7.4% (10,622) |
Median non-family income in East Lyme in 2022:| East Lyme: | $57,133 |
| Connecticut: | $36,714 |
Change in median non-family income between 2000 and 2022:| East Lyme, Connecticut: | +73.9% |
| State: | +90.0% |
Median per capita income in East Lyme in 2022:| East Lyme: | $18,902 |
| Connecticut: | $28,507 |
Change in median per capita income between 2000 and 2022:| East Lyme, Connecticut: | +80.3% |
| State: | +117.2% |
Income statistics for American Indian and Alaska Native residents
Median household income in East Lyme, CT in 2022:| East Lyme: | $97,032 |
| State: | $41,848 |
Change in median household income between 2000 and 2022:| East Lyme, Connecticut: | +12.9% |
| State: | +12.9% |
Number of households with income < $10k:| East Lyme: | 8.4% (244,466) |
| State: | 10.2% (340) |
Number of households with income $10k - 20k:| East Lyme: | 9.4% (272,818) |
| Connecticut: | 8.5% (283) |
Number of households with income $20k - 30k:| East Lyme: | 8.5% (246,768) |
| State: | 9.4% (314) |
Number of households with income $30k - 40k:| East Lyme: | 9.1% (264,381) |
| State: | 10.1% (337) |
Number of households with income $40k - 50k:| East Lyme: | 8.3% (242,508) |
| Connecticut: | 13.4% (447) |
Number of households with income $50k - 60k:| East Lyme: | 7.8% (228,665) |
| State: | 3.1% (104) |
Number of households with income $60k - 75k:| East Lyme: | 9.8% (285,021) |
| State: | 5.6% (188) |
Number of households with income $75k - 100k:| East Lyme: | 12.6% (367,916) |
| State: | 13.4% (447) |
Number of households with income $100k - 125k:| East Lyme: | 9.4% (275,128) |
| Connecticut: | 9.5% (317) |
Number of households with income $125k - 150k:| East Lyme: | 5.6% (164,718) |
| State: | 3.9% (131) |
Number of households with income $150k - 200k:| East Lyme: | 6.0% (173,644) |
| State: | 6.3% (212) |
Number of households with income > $200k:| East Lyme: | 5.2% (150,299) |
| State: | 6.8% (228) |
Aggregate household income in East Lyme in 2022: $1,832,731
Median family income in East Lyme in 2022:| East Lyme: | $121,279 |
| Connecticut: | $57,217 |
Number of families with income $75k - 100k:| East Lyme: | 100.0% (36) |
| State: | 17.4% (349) |
Median non-family income in East Lyme in 2022:| East Lyme: | $19,695 |
| State: | $40,310 |
Change in median non-family income between 2000 and 2022:| East Lyme, Connecticut: | +125.1% |
| State: | +125.1% |
Median per capita income in East Lyme in 2022:| East Lyme: | $32,025 |
| State: | $25,355 |
Change in median per capita income between 2000 and 2022:| East Lyme, Connecticut: | +45.9% |
| State: | +39.4% |
Income statistics for Multirace residents
Median household income in East Lyme, CT in 2022:| East Lyme: | $140,810 |
| Connecticut: | $77,277 |
Change in median household income between 2000 and 2022:| East Lyme, Connecticut: | +119.4% |
| Connecticut: | +113.6% |
Number of households with income < $10k:| East Lyme: | 6.0% (13,223) |
| Connecticut: | 6.0% (7,457) |
Number of households with income $10k - 20k:| East Lyme: | 8.1% (17,979) |
| State: | 8.1% (10,139) |
Number of households with income $20k - 30k:| East Lyme: | 7.0% (15,431) |
| Connecticut: | 7.0% (8,702) |
Number of households with income $30k - 40k:| East Lyme: | 6.9% (15,155) |
| State: | 6.9% (8,546) |
Number of households with income $40k - 50k:| East Lyme: | 7.0% (15,449) |
| State: | 7.0% (8,712) |
Number of households with income $50k - 60k:| East Lyme: | 5.9% (13,000) |
| Connecticut: | 5.9% (7,331) |
Number of households with income $60k - 75k:| East Lyme: | 8.5% (18,857) |
| State: | 8.5% (10,634) |
Number of households with income $75k - 100k:| East Lyme: | 14.1% (31,209) |
| Connecticut: | 14.1% (17,600) |
Number of households with income $100k - 125k:| East Lyme: | 9.9% (21,958) |
| State: | 9.9% (12,383) |
Number of households with income $125k - 150k:| East Lyme: | 7.2% (15,819) |
| State: | 7.2% (8,921) |
Number of households with income $150k - 200k:| East Lyme: | 8.8% (19,367) |
| State: | 8.8% (10,922) |
Number of households with income > $200k:| East Lyme: | 10.6% (23,490) |
| State: | 10.6% (13,247) |
Aggregate household income in East Lyme in 2022: $38,562,727
Median family income in East Lyme in 2022:| East Lyme: | $137,991 |
| State: | $84,255 |
Number of families with income $30k - 40k:| East Lyme: | 10.6% (23) |
| State: | 6.8% (5,759) |
Number of families with income $50k - 60k:| East Lyme: | 12.9% (27) |
| Connecticut: | 7.6% (6,420) |
Number of families with income $60k - 75k:| East Lyme: | 16.1% (34) |
| State: | 7.8% (6,550) |
Number of families with income $75k - 100k:| East Lyme: | 60.5% (129) |
| State: | 14.5% (12,236) |
Median per capita income in East Lyme in 2022:| East Lyme: | $22,278 |
| State: | $32,794 |
Change in median per capita income between 2000 and 2022:| East Lyme, Connecticut: | +95.5% |
| State: | +117.2% |
Income statistics for other residents
Number of households with income < $10k:| East Lyme: | 7.7% (3) |
| State: | 9.0% (8,596) |
Number of households with income $10k - 20k:| East Lyme: | 10.3% (4) |
| State: | 10.2% (9,773) |
Number of households with income $20k - 30k:| East Lyme: | 10.3% (4) |
| Connecticut: | 9.1% (8,691) |
Number of households with income $30k - 40k:| East Lyme: | 7.7% (3) |
| Connecticut: | 7.8% (7,447) |
Number of households with income $40k - 50k:| East Lyme: | 7.7% (3) |
| State: | 8.2% (7,860) |
Number of households with income $50k - 60k:| East Lyme: | 5.1% (2) |
| Connecticut: | 6.0% (5,757) |
Number of households with income $60k - 75k:| East Lyme: | 10.3% (4) |
| State: | 9.3% (8,942) |
Number of households with income $75k - 100k:| East Lyme: | 15.4% (6) |
| State: | 14.3% (13,700) |
Number of households with income $100k - 125k:| East Lyme: | 7.7% (3) |
| State: | 7.2% (6,906) |
Number of households with income $125k - 150k:| East Lyme: | 7.7% (3) |
| State: | 6.5% (6,215) |
Number of households with income $150k - 200k:| East Lyme: | 5.1% (2) |
| State: | 6.1% (5,865) |
Number of households with income > $200k:| East Lyme: | 5.1% (2) |
| Connecticut: | 6.3% (6,065) |
Aggregate household income in East Lyme in 2022: $5,452,434
Median family income in East Lyme in 2022:| East Lyme: | $91,056 |
| State: | $67,610 |
Median non-family income in East Lyme in 2022:| East Lyme: | $36,039 |
| State: | $34,285 |
Change in median non-family income between 2000 and 2022:| East Lyme, Connecticut: | +83.6% |
| State: | +83.6% |
Median per capita income in East Lyme in 2022:| East Lyme: | $19,295 |
| State: | $29,353 |