Dighton, Massachusetts (MA) income map, earnings map, and wages data
The median household income in Dighton, MA in 2022 was $109,869, which was 14.0% greater than the median annual income of $94,488 across the entire state of Massachusetts. Compared to the median income of $58,600 in 2000 this represents an increase of 46.7%. The per capita income in 2022 was $46,083, which means an increase of 51.0% compared to 2000 when it was $22,600.
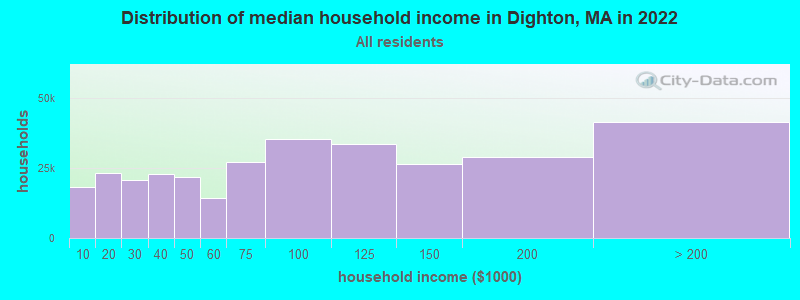
Income statistics for all residents
Median household income in Dighton, MA in 2022:| Dighton: | $109,870 |
| State: | $94,488 |
Change in median household income between 2000 and 2022:| Dighton, Massachusetts: | +87.5% |
| State: | +87.1% |
Number of households with income < $10k:| Dighton: | 5.8% (18,327) |
| State: | 5.2% (146,170) |
Number of households with income $10k - 20k:| Dighton: | 7.3% (23,031) |
| State: | 6.4% (180,001) |
Number of households with income $20k - 30k:| Dighton: | 6.6% (20,725) |
| State: | 5.6% (156,667) |
Number of households with income $30k - 40k:| Dighton: | 7.3% (23,003) |
| Massachusetts: | 5.6% (157,168) |
Number of households with income $40k - 50k:| Dighton: | 6.9% (21,637) |
| State: | 5.4% (151,455) |
Number of households with income $50k - 60k:| Dighton: | 4.6% (14,355) |
| Massachusetts: | 5.1% (142,726) |
Number of households with income $60k - 75k:| Dighton: | 8.6% (27,054) |
| State: | 7.6% (212,203) |
Number of households with income $75k - 100k:| Dighton: | 11.3% (35,399) |
| Massachusetts: | 11.3% (317,064) |
Number of households with income $100k - 125k:| Dighton: | 10.7% (33,595) |
| State: | 9.7% (270,603) |
Number of households with income $125k - 150k:| Dighton: | 8.5% (26,573) |
| State: | 8.0% (223,140) |
Number of households with income $150k - 200k:| Dighton: | 9.2% (29,059) |
| State: | 11.0% (308,695) |
Number of households with income > $200k:| Dighton: | 13.2% (41,413) |
| State: | 19.0% (531,884) |
Aggregate household income in Dighton in 2022: $1,597,158,683
Median family income in Dighton in 2022:| Dighton: | $130,268 |
| State: | $120,263 |
Median non-family income in Dighton in 2022:| Dighton: | $53,316 |
| State: | $55,979 |
Change in median non-family income between 2000 and 2022:| Dighton, Massachusetts: | +93.6% |
| Massachusetts: | +88.0% |
Median per capita income in Dighton in 2022:| Dighton: | $46,083 |
| State: | $54,025 |
Change in median per capita income between 2000 and 2022:| Dighton, Massachusetts: | +103.9% |
| State: | +108.2% |
Income statistics for White residents
Median household income in Dighton, MA in 2022:| Dighton: | $112,414 |
| State: | $101,391 |
Change in median household income between 2000 and 2022:| Dighton, Massachusetts: | +92.2% |
| Massachusetts: | +93.3% |
Number of households with income < $10k:| Dighton: | 5.5% (13,602) |
| State: | 4.4% (91,120) |
Number of households with income $10k - 20k:| Dighton: | 7.4% (18,384) |
| State: | 5.9% (122,055) |
Number of households with income $20k - 30k:| Dighton: | 6.3% (15,578) |
| State: | 5.1% (105,311) |
Number of households with income $30k - 40k:| Dighton: | 6.8% (16,847) |
| State: | 5.3% (110,239) |
Number of households with income $40k - 50k:| Dighton: | 7.0% (17,387) |
| State: | 5.0% (104,636) |
Number of households with income $50k - 60k:| Dighton: | 4.3% (10,727) |
| State: | 4.8% (99,486) |
Number of households with income $60k - 75k:| Dighton: | 8.5% (21,012) |
| Massachusetts: | 7.5% (155,124) |
Number of households with income $75k - 100k:| Dighton: | 10.7% (26,653) |
| Massachusetts: | 11.4% (236,252) |
Number of households with income $100k - 125k:| Dighton: | 11.0% (27,436) |
| State: | 9.9% (204,731) |
Number of households with income $125k - 150k:| Dighton: | 8.7% (21,590) |
| State: | 8.5% (175,324) |
Number of households with income $150k - 200k:| Dighton: | 9.8% (24,418) |
| State: | 11.7% (242,980) |
Number of households with income > $200k:| Dighton: | 14.0% (34,730) |
| State: | 20.5% (425,966) |
Aggregate household income in Dighton in 2022: $1,325,648,236
Median family income in Dighton in 2022:| Dighton: | $132,842 |
| State: | $133,153 |
Number of families with income < $10k:| Dighton: | 0.4% (6) |
| State: | 2.0% (25,038) |
Number of families with income $10k - 20k:| Dighton: | 1.0% (17) |
| State: | 2.1% (26,403) |
Number of families with income $20k - 30k:| Dighton: | 1.6% (25) |
| Massachusetts: | 2.6% (32,525) |
Number of families with income $30k - 40k:| Dighton: | 4.1% (65) |
| State: | 3.9% (48,079) |
Number of families with income $40k - 50k:| Dighton: | 5.0% (79) |
| Massachusetts: | 3.8% (46,908) |
Number of families with income $50k - 60k:| Dighton: | 6.0% (95) |
| State: | 3.8% (46,476) |
Number of families with income $60k - 75k:| Dighton: | 9.0% (143) |
| State: | 6.4% (79,040) |
Number of families with income $75k - 100k:| Dighton: | 14.2% (225) |
| State: | 11.1% (137,395) |
Number of families with income $100k - 125k:| Dighton: | 12.5% (198) |
| State: | 11.1% (136,771) |
Number of families with income $125k - 150k:| Dighton: | 15.0% (237) |
| Massachusetts: | 10.0% (123,709) |
Number of families with income $150k - 200k:| Dighton: | 26.3% (415) |
| State: | 14.7% (181,602) |
Number of families with income > $200k:| Dighton: | 4.7% (75) |
| State: | 28.5% (351,887) |
Median non-family income in Dighton in 2022:| Dighton: | $53,561 |
| Massachusetts: | $59,323 |
Change in median non-family income between 2000 and 2022:| Dighton, Massachusetts: | +92.7% |
| State: | +94.3% |
Median per capita income in Dighton in 2022:| Dighton: | $49,246 |
| State: | $60,804 |
Change in median per capita income between 2000 and 2022:| Dighton, Massachusetts: | +115.0% |
| State: | +118.7% |
Income statistics for Black or African American residents
Number of households with income < $10k:| Dighton: | 13.0% (449) |
| Massachusetts: | 9.1% (15,797) |
Number of households with income $10k - 20k:| Dighton: | 5.4% (187) |
| State: | 9.4% (16,267) |
Number of households with income $20k - 30k:| Dighton: | 3.7% (128) |
| State: | 7.8% (13,520) |
Number of households with income $30k - 40k:| Dighton: | 10.3% (356) |
| State: | 8.3% (14,412) |
Number of households with income $40k - 50k:| Dighton: | 7.6% (264) |
| Massachusetts: | 7.9% (13,790) |
Number of households with income $50k - 60k:| Dighton: | 5.0% (173) |
| State: | 5.8% (10,041) |
Number of households with income $60k - 75k:| Dighton: | 9.4% (324) |
| State: | 8.5% (14,822) |
Number of households with income $75k - 100k:| Dighton: | 11.6% (402) |
| State: | 11.0% (19,122) |
Number of households with income $100k - 125k:| Dighton: | 11.9% (411) |
| State: | 8.4% (14,575) |
Number of households with income $125k - 150k:| Dighton: | 6.7% (232) |
| State: | 6.0% (10,429) |
Number of households with income $150k - 200k:| Dighton: | 5.8% (201) |
| Massachusetts: | 7.2% (12,539) |
Number of households with income > $200k:| Dighton: | 9.4% (326) |
| Massachusetts: | 10.5% (18,185) |
Median per capita income in Dighton in 2022:| Dighton: | $8,955 |
| Massachusetts: | $33,524 |
Change in median per capita income between 2000 and 2022:| Dighton, Massachusetts: | +99.0% |
| State: | +109.4% |
Income statistics for Asian residents
Median household income in Dighton, MA in 2022:| Dighton: | $149,006 |
| Massachusetts: | $117,855 |
Change in median household income between 2000 and 2022:| Dighton, Massachusetts: | +127.6% |
| State: | +129.9% |
Number of households with income < $10k:| Dighton: | 6.8% (15,296) |
| State: | 6.8% (11,982) |
Number of households with income $10k - 20k:| Dighton: | 4.8% (10,693) |
| Massachusetts: | 4.8% (8,376) |
Number of households with income $20k - 30k:| Dighton: | 3.7% (8,372) |
| State: | 3.7% (6,558) |
Number of households with income $30k - 40k:| Dighton: | 3.3% (7,338) |
| Massachusetts: | 3.3% (5,748) |
Number of households with income $40k - 50k:| Dighton: | 4.1% (9,181) |
| State: | 4.1% (7,192) |
Number of households with income $50k - 60k:| Dighton: | 5.0% (11,150) |
| State: | 5.0% (8,734) |
Number of households with income $60k - 75k:| Dighton: | 5.8% (13,025) |
| State: | 5.8% (10,203) |
Number of households with income $75k - 100k:| Dighton: | 8.6% (19,346) |
| State: | 8.6% (15,154) |
Number of households with income $100k - 125k:| Dighton: | 10.8% (24,181) |
| State: | 10.8% (18,942) |
Number of households with income $125k - 150k:| Dighton: | 8.0% (17,920) |
| State: | 8.0% (14,037) |
Number of households with income $150k - 200k:| Dighton: | 12.5% (27,901) |
| Massachusetts: | 12.5% (21,856) |
Number of households with income > $200k:| Dighton: | 26.6% (59,609) |
| State: | 26.6% (46,694) |
Aggregate household income in Dighton in 2022: $4,341,016
Median family income in Dighton in 2022:| Dighton: | $150,178 |
| State: | $140,113 |
Number of families with income $60k - 75k:| Dighton: | 100.0% (13) |
| State: | 6.1% (7,105) |
Median non-family income in Dighton in 2022:| Dighton: | $24,624 |
| State: | $71,440 |
Change in median non-family income between 2000 and 2022:| Dighton, Massachusetts: | +118.9% |
| State: | +128.0% |
Median per capita income in Dighton in 2022:| Dighton: | $29,323 |
| State: | $58,900 |
Income statistics for American Indian and Alaska Native residents
Number of households with income < $10k:| Dighton: | 6.6% (851) |
| Massachusetts: | 6.6% (451) |
Number of households with income $10k - 20k:| Dighton: | 7.0% (899) |
| Massachusetts: | 7.0% (476) |
Number of households with income $20k - 30k:| Dighton: | 2.8% (363) |
| State: | 2.8% (192) |
Number of households with income $30k - 40k:| Dighton: | 3.2% (411) |
| Massachusetts: | 3.2% (218) |
Number of households with income $40k - 50k:| Dighton: | 2.9% (376) |
| State: | 2.9% (199) |
Number of households with income $50k - 60k:| Dighton: | 9.9% (1,278) |
| State: | 9.9% (677) |
Number of households with income $60k - 75k:| Dighton: | 11.5% (1,474) |
| State: | 11.5% (781) |
Number of households with income $75k - 100k:| Dighton: | 9.2% (1,187) |
| State: | 9.2% (629) |
Number of households with income $100k - 125k:| Dighton: | 6.0% (766) |
| State: | 6.0% (406) |
Number of households with income $125k - 150k:| Dighton: | 13.5% (1,738) |
| Massachusetts: | 13.5% (921) |
Number of households with income $150k - 200k:| Dighton: | 12.6% (1,621) |
| State: | 12.6% (859) |
Number of households with income > $200k:| Dighton: | 14.7% (1,893) |
| State: | 14.7% (1,003) |
Median per capita income in Dighton in 2022:| Dighton: | $27,862 |
| State: | $39,434 |
Income statistics for other residents
Number of households with income < $10k:| Dighton: | 9.8% (3,226) |
| State: | 8.4% (11,559) |
Number of households with income $10k - 20k:| Dighton: | 8.3% (2,746) |
| State: | 8.4% (11,499) |
Number of households with income $20k - 30k:| Dighton: | 12.6% (4,142) |
| State: | 9.5% (13,070) |
Number of households with income $30k - 40k:| Dighton: | 7.4% (2,450) |
| Massachusetts: | 6.0% (8,291) |
Number of households with income $40k - 50k:| Dighton: | 6.0% (1,974) |
| State: | 9.2% (12,611) |
Number of households with income $50k - 60k:| Dighton: | 10.7% (3,516) |
| State: | 7.9% (10,879) |
Number of households with income $60k - 75k:| Dighton: | 5.4% (1,775) |
| State: | 7.5% (10,239) |
Number of households with income $75k - 100k:| Dighton: | 11.1% (3,642) |
| State: | 13.1% (18,032) |
Number of households with income $100k - 125k:| Dighton: | 9.0% (2,953) |
| State: | 9.6% (13,141) |
Number of households with income $125k - 150k:| Dighton: | 7.6% (2,496) |
| State: | 5.0% (6,808) |
Number of households with income $150k - 200k:| Dighton: | 8.9% (2,924) |
| Massachusetts: | 6.4% (8,843) |
Number of households with income > $200k:| Dighton: | 3.2% (1,066) |
| State: | 9.0% (12,396) |
Median per capita income in Dighton in 2022:| Dighton: | $64,046 |
| State: | $30,797 |
Change in median per capita income between 2000 and 2022:| Dighton, Massachusetts: | +128.7% |
| State: | +188.5% |