Charlton, Massachusetts (MA) income map, earnings map, and wages data
The median household income in Charlton, MA in 2022 was $113,571, which was 16.8% greater than the median annual income of $94,488 across the entire state of Massachusetts. Compared to the median income of $63,033 in 2000 this represents an increase of 44.5%. The per capita income in 2022 was $46,065, which means an increase of 48.7% compared to 2000 when it was $23,626.
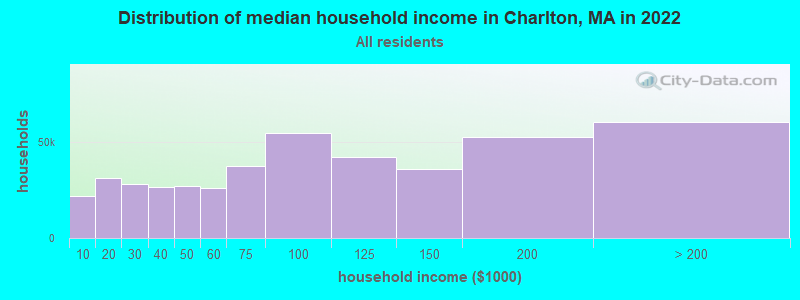
Income statistics for all residents
Median household income in Charlton, MA in 2022:| Charlton: | $113,571 |
| State: | $94,488 |
Change in median household income between 2000 and 2022:| Charlton, Massachusetts: | +80.2% |
| State: | +87.1% |
Number of households with income < $10k:| Charlton: | 4.9% (21,847) |
| Massachusetts: | 5.2% (146,170) |
Number of households with income $10k - 20k:| Charlton: | 7.0% (31,171) |
| Massachusetts: | 6.4% (180,001) |
Number of households with income $20k - 30k:| Charlton: | 6.4% (28,388) |
| Massachusetts: | 5.6% (156,667) |
Number of households with income $30k - 40k:| Charlton: | 5.9% (26,423) |
| State: | 5.6% (157,168) |
Number of households with income $40k - 50k:| Charlton: | 6.1% (27,057) |
| Massachusetts: | 5.4% (151,455) |
Number of households with income $50k - 60k:| Charlton: | 5.8% (25,906) |
| State: | 5.1% (142,726) |
Number of households with income $60k - 75k:| Charlton: | 8.4% (37,594) |
| Massachusetts: | 7.6% (212,203) |
Number of households with income $75k - 100k:| Charlton: | 12.3% (54,679) |
| State: | 11.3% (317,064) |
Number of households with income $100k - 125k:| Charlton: | 9.5% (42,442) |
| State: | 9.7% (270,603) |
Number of households with income $125k - 150k:| Charlton: | 8.1% (36,267) |
| State: | 8.0% (223,140) |
Number of households with income $150k - 200k:| Charlton: | 11.9% (52,821) |
| Massachusetts: | 11.0% (308,695) |
Number of households with income > $200k:| Charlton: | 13.6% (60,546) |
| State: | 19.0% (531,884) |
Aggregate household income in Charlton in 2022: $4,637,365,327
Median family income in Charlton in 2022:| Charlton: | $129,184 |
| State: | $120,263 |
Median non-family income in Charlton in 2022:| Charlton: | $59,373 |
| State: | $55,979 |
Change in median non-family income between 2000 and 2022:| Charlton, Massachusetts: | +85.7% |
| State: | +88.0% |
Median per capita income in Charlton in 2022:| Charlton: | $46,066 |
| State: | $54,025 |
Change in median per capita income between 2000 and 2022:| Charlton, Massachusetts: | +95.0% |
| State: | +108.2% |
Income statistics for White residents
Median household income in Charlton, MA in 2022:| Charlton: | $117,753 |
| Massachusetts: | $101,391 |
Change in median household income between 2000 and 2022:| Charlton, Massachusetts: | +85.1% |
| State: | +93.3% |
Number of households with income < $10k:| Charlton: | 4.6% (15,728) |
| State: | 4.4% (91,120) |
Number of households with income $10k - 20k:| Charlton: | 6.5% (22,490) |
| Massachusetts: | 5.9% (122,055) |
Number of households with income $20k - 30k:| Charlton: | 6.1% (20,855) |
| Massachusetts: | 5.1% (105,311) |
Number of households with income $30k - 40k:| Charlton: | 5.5% (18,817) |
| Massachusetts: | 5.3% (110,239) |
Number of households with income $40k - 50k:| Charlton: | 5.6% (19,267) |
| Massachusetts: | 5.0% (104,636) |
Number of households with income $50k - 60k:| Charlton: | 5.4% (18,683) |
| State: | 4.8% (99,486) |
Number of households with income $60k - 75k:| Charlton: | 8.4% (28,932) |
| State: | 7.5% (155,124) |
Number of households with income $75k - 100k:| Charlton: | 12.2% (42,046) |
| State: | 11.4% (236,252) |
Number of households with income $100k - 125k:| Charlton: | 10.1% (34,940) |
| State: | 9.9% (204,731) |
Number of households with income $125k - 150k:| Charlton: | 8.4% (28,815) |
| State: | 8.5% (175,324) |
Number of households with income $150k - 200k:| Charlton: | 12.5% (42,928) |
| State: | 11.7% (242,980) |
Number of households with income > $200k:| Charlton: | 14.7% (50,775) |
| State: | 20.5% (425,966) |
Aggregate household income in Charlton in 2022: $3,760,185,452
Median family income in Charlton in 2022:| Charlton: | $136,754 |
| Massachusetts: | $133,153 |
Number of families with income < $10k:| Charlton: | 2.2% (54) |
| Massachusetts: | 2.0% (25,038) |
Number of families with income $10k - 20k:| Charlton: | 1.4% (35) |
| State: | 2.1% (26,403) |
Number of families with income $20k - 30k:| Charlton: | 1.8% (46) |
| State: | 2.6% (32,525) |
Number of families with income $30k - 40k:| Charlton: | 3.7% (91) |
| State: | 3.9% (48,079) |
Number of families with income $40k - 50k:| Charlton: | 4.5% (112) |
| Massachusetts: | 3.8% (46,908) |
Number of families with income $50k - 60k:| Charlton: | 5.0% (123) |
| State: | 3.8% (46,476) |
Number of families with income $60k - 75k:| Charlton: | 10.9% (270) |
| State: | 6.4% (79,040) |
Number of families with income $75k - 100k:| Charlton: | 21.8% (539) |
| State: | 11.1% (137,395) |
Number of families with income $100k - 125k:| Charlton: | 16.3% (403) |
| Massachusetts: | 11.1% (136,771) |
Number of families with income $125k - 150k:| Charlton: | 14.5% (357) |
| State: | 10.0% (123,709) |
Number of families with income $150k - 200k:| Charlton: | 9.8% (241) |
| Massachusetts: | 14.7% (181,602) |
Number of families with income > $200k:| Charlton: | 8.1% (199) |
| State: | 28.5% (351,887) |
Median non-family income in Charlton in 2022:| Charlton: | $61,391 |
| State: | $59,323 |
Change in median non-family income between 2000 and 2022:| Charlton, Massachusetts: | +92.0% |
| State: | +94.3% |
Median per capita income in Charlton in 2022:| Charlton: | $48,532 |
| State: | $60,804 |
Change in median per capita income between 2000 and 2022:| Charlton, Massachusetts: | +105.3% |
| State: | +118.7% |
Income statistics for Black or African American residents
Median household income in Charlton, MA in 2022:| Charlton: | $75,831 |
| State: | $63,189 |
Change in median household income between 2000 and 2022:| Charlton, Massachusetts: | +69.8% |
| State: | +87.4% |
Number of households with income < $10k:| Charlton: | 7.3% (1,439) |
| Massachusetts: | 9.1% (15,797) |
Number of households with income $10k - 20k:| Charlton: | 11.9% (2,351) |
| State: | 9.4% (16,267) |
Number of households with income $20k - 30k:| Charlton: | 9.8% (1,936) |
| Massachusetts: | 7.8% (13,520) |
Number of households with income $30k - 40k:| Charlton: | 3.3% (643) |
| State: | 8.3% (14,412) |
Number of households with income $40k - 50k:| Charlton: | 13.5% (2,663) |
| Massachusetts: | 7.9% (13,790) |
Number of households with income $50k - 60k:| Charlton: | 5.8% (1,139) |
| State: | 5.8% (10,041) |
Number of households with income $60k - 75k:| Charlton: | 10.7% (2,118) |
| State: | 8.5% (14,822) |
Number of households with income $75k - 100k:| Charlton: | 13.0% (2,572) |
| State: | 11.0% (19,122) |
Number of households with income $100k - 125k:| Charlton: | 7.5% (1,485) |
| State: | 8.4% (14,575) |
Number of households with income $125k - 150k:| Charlton: | 5.0% (981) |
| State: | 6.0% (10,429) |
Number of households with income $150k - 200k:| Charlton: | 7.3% (1,431) |
| State: | 7.2% (12,539) |
Number of households with income > $200k:| Charlton: | 4.9% (974) |
| Massachusetts: | 10.5% (18,185) |
Aggregate household income in Charlton in 2022: $7,418,496
Median family income in Charlton in 2022:| Charlton: | $73,274 |
| State: | $79,815 |
Number of families with income $40k - 50k:| Charlton: | 27.6% (34) |
| State: | 7.9% (8,656) |
Number of families with income $150k - 200k:| Charlton: | 72.4% (90) |
| State: | 9.3% (10,230) |
Median per capita income in Charlton in 2022:| Charlton: | $79,339 |
| Massachusetts: | $33,524 |
Change in median per capita income between 2000 and 2022:| Charlton, Massachusetts: | +95.7% |
| State: | +109.4% |
Income statistics for Hispanic or Latino residents
Median household income in Charlton, MA in 2022:| Charlton: | $104,505 |
| State: | $61,523 |
Change in median household income between 2000 and 2022:| Charlton, Massachusetts: | +116.0% |
| State: | +125.4% |
Number of households with income < $10k:| Charlton: | 8.1% (5,349) |
| State: | 8.8% (25,307) |
Number of households with income $10k - 20k:| Charlton: | 10.5% (6,879) |
| State: | 10.0% (28,653) |
Number of households with income $20k - 30k:| Charlton: | 10.3% (6,803) |
| State: | 8.8% (25,189) |
Number of households with income $30k - 40k:| Charlton: | 9.5% (6,258) |
| Massachusetts: | 7.2% (20,822) |
Number of households with income $40k - 50k:| Charlton: | 7.1% (4,680) |
| Massachusetts: | 7.2% (20,817) |
Number of households with income $50k - 60k:| Charlton: | 8.0% (5,255) |
| State: | 6.5% (18,748) |
Number of households with income $60k - 75k:| Charlton: | 11.1% (7,283) |
| State: | 8.8% (25,390) |
Number of households with income $75k - 100k:| Charlton: | 14.1% (9,266) |
| State: | 12.0% (34,488) |
Number of households with income $100k - 125k:| Charlton: | 5.7% (3,740) |
| State: | 8.6% (24,599) |
Number of households with income $125k - 150k:| Charlton: | 8.8% (5,810) |
| State: | 6.2% (17,743) |
Number of households with income $150k - 200k:| Charlton: | 3.6% (2,336) |
| State: | 7.3% (21,017) |
Number of households with income > $200k:| Charlton: | 3.2% (2,094) |
| State: | 8.6% (24,606) |
Aggregate household income in Charlton in 2022: $6,138,166
Median family income in Charlton in 2022:| Charlton: | $107,344 |
| Massachusetts: | $66,072 |
Number of families with income < $10k:| Charlton: | 8.6% (34) |
| State: | 6.2% (12,456) |
Number of families with income $10k - 20k:| Charlton: | 2.5% (10) |
| Massachusetts: | 6.0% (12,071) |
Number of families with income $20k - 30k:| Charlton: | 5.3% (21) |
| State: | 10.1% (20,376) |
Number of families with income $30k - 40k:| Charlton: | 7.6% (30) |
| State: | 8.2% (16,470) |
Number of families with income $40k - 50k:| Charlton: | 10.0% (40) |
| State: | 7.4% (14,829) |
Number of families with income $50k - 60k:| Charlton: | 10.6% (42) |
| State: | 7.3% (14,643) |
Number of families with income $60k - 75k:| Charlton: | 11.6% (46) |
| Massachusetts: | 10.6% (21,252) |
Number of families with income $75k - 100k:| Charlton: | 20.5% (81) |
| State: | 12.0% (24,088) |
Number of families with income $100k - 125k:| Charlton: | 6.5% (26) |
| State: | 8.9% (17,954) |
Number of families with income $125k - 150k:| Charlton: | 13.4% (53) |
| Massachusetts: | 6.9% (13,837) |
Number of families with income $150k - 200k:| Charlton: | 1.9% (8) |
| State: | 7.3% (14,683) |
Number of families with income > $200k:| Charlton: | 1.4% (6) |
| State: | 9.3% (18,741) |
Median non-family income in Charlton in 2022:| Charlton: | $70,999 |
| State: | $37,563 |
Change in median non-family income between 2000 and 2022:| Charlton, Massachusetts: | +95.9% |
| Massachusetts: | +115.0% |
Median per capita income in Charlton in 2022:| Charlton: | $52,240 |
| State: | $28,993 |
Change in median per capita income between 2000 and 2022:| Charlton, Massachusetts: | +110.9% |
| State: | +142.4% |
Income statistics for Multirace residents
Median household income in Charlton, MA in 2022:| Charlton: | $27,516 |
| State: | $71,552 |
Change in median household income between 2000 and 2022:| Charlton, Massachusetts: | +84.7% |
| Massachusetts: | +109.0% |
Number of households with income < $10k:| Charlton: | 7.4% (1,025) |
| State: | 6.6% (15,127) |
Number of households with income $10k - 20k:| Charlton: | 10.3% (1,424) |
| State: | 9.2% (21,158) |
Number of households with income $20k - 30k:| Charlton: | 10.2% (1,407) |
| State: | 7.8% (18,016) |
Number of households with income $30k - 40k:| Charlton: | 11.3% (1,558) |
| State: | 7.9% (18,260) |
Number of households with income $40k - 50k:| Charlton: | 6.2% (854) |
| State: | 5.6% (13,027) |
Number of households with income $50k - 60k:| Charlton: | 8.7% (1,203) |
| Massachusetts: | 5.6% (12,909) |
Number of households with income $60k - 75k:| Charlton: | 8.2% (1,126) |
| Massachusetts: | 9.0% (20,800) |
Number of households with income $75k - 100k:| Charlton: | 13.5% (1,860) |
| Massachusetts: | 12.1% (27,875) |
Number of households with income $100k - 125k:| Charlton: | 6.2% (851) |
| State: | 8.1% (18,754) |
Number of households with income $125k - 150k:| Charlton: | 6.4% (885) |
| Massachusetts: | 6.8% (15,621) |
Number of households with income $150k - 200k:| Charlton: | 5.9% (817) |
| State: | 9.4% (21,618) |
Number of households with income > $200k:| Charlton: | 5.6% (768) |
| State: | 12.0% (27,592) |
Aggregate household income in Charlton in 2022: $26,980,802
Median family income in Charlton in 2022:| Charlton: | $23,560 |
| Massachusetts: | $78,380 |
Number of families with income < $10k:| Charlton: | 14.0% (36) |
| State: | 4.5% (7,017) |
Number of families with income $10k - 20k:| Charlton: | 21.5% (56) |
| Massachusetts: | 4.9% (7,678) |
Number of families with income $75k - 100k:| Charlton: | 49.2% (128) |
| State: | 12.1% (18,758) |
Number of families with income $100k - 125k:| Charlton: | 15.4% (40) |
| State: | 7.9% (12,321) |
Median per capita income in Charlton in 2022:| Charlton: | $36,824 |
| State: | $34,029 |
Change in median per capita income between 2000 and 2022:| Charlton, Massachusetts: | +104.0% |
| State: | +132.1% |
Income statistics for other residents
Aggregate household income in Charlton in 2022: $797,426
Median family income in Charlton in 2022:| Charlton: | $36,610 |
| State: | $66,840 |
Median per capita income in Charlton in 2022:| Charlton: | $20,050 |
| State: | $30,797 |