Burlington, Connecticut (CT) income map, earnings map, and wages data
The median household income in Burlington, CT in 2022 was $139,958, which was 36.8% greater than the median annual income of $88,429 across the entire state of Connecticut. Compared to the median income of $82,711 in 2000 this represents an increase of 40.9%. The per capita income in 2022 was $66,171, which means an increase of 45.3% compared to 2000 when it was $36,173.
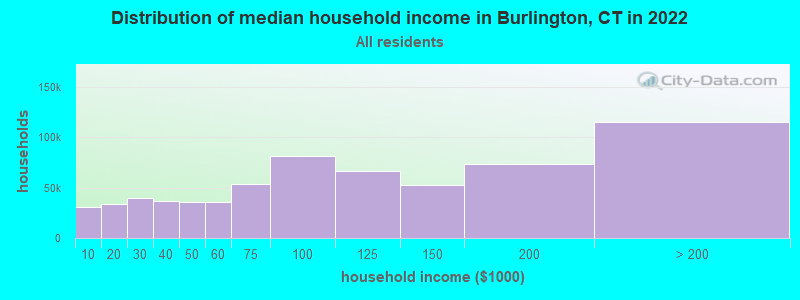
Income statistics for all residents
Median household income in Burlington, CT in 2022:| Burlington: | $139,958 |
| State: | $88,429 |
Change in median household income between 2000 and 2022:| Burlington, Connecticut: | +69.2% |
| State: | +64.0% |
Number of households with income < $10k:| Burlington: | 5.2% (57,008) |
| State: | 5.1% (72,746) |
Number of households with income $10k - 20k:| Burlington: | 5.8% (64,284) |
| State: | 5.7% (81,643) |
Number of households with income $20k - 30k:| Burlington: | 6.6% (72,764) |
| State: | 6.5% (92,844) |
Number of households with income $30k - 40k:| Burlington: | 5.9% (65,301) |
| State: | 5.9% (83,934) |
Number of households with income $40k - 50k:| Burlington: | 5.9% (64,883) |
| Connecticut: | 5.8% (83,025) |
Number of households with income $50k - 60k:| Burlington: | 5.8% (63,621) |
| Connecticut: | 5.7% (81,788) |
Number of households with income $60k - 75k:| Burlington: | 8.1% (89,141) |
| State: | 8.1% (115,651) |
Number of households with income $75k - 100k:| Burlington: | 12.6% (139,219) |
| State: | 12.6% (180,173) |
Number of households with income $100k - 125k:| Burlington: | 9.8% (108,380) |
| State: | 9.9% (141,231) |
Number of households with income $125k - 150k:| Burlington: | 7.8% (86,552) |
| State: | 7.9% (112,826) |
Number of households with income $150k - 200k:| Burlington: | 10.7% (118,396) |
| State: | 10.8% (154,641) |
Number of households with income > $200k:| Burlington: | 16.0% (176,877) |
| Connecticut: | 16.3% (233,133) |
Aggregate household income in Burlington in 2022: $12,634,129,120
Median family income in Burlington in 2022:| Burlington: | $156,812 |
| State: | $115,183 |
Median non-family income in Burlington in 2022:| Burlington: | $85,065 |
| State: | $50,964 |
Change in median non-family income between 2000 and 2022:| Burlington, Connecticut: | +71.5% |
| State: | +65.1% |
Median per capita income in Burlington in 2022:| Burlington: | $66,171 |
| State: | $51,581 |
Change in median per capita income between 2000 and 2022:| Burlington, Connecticut: | +82.9% |
| Connecticut: | +79.3% |
Income statistics for White residents
Median household income in Burlington, CT in 2022:| Burlington: | $139,315 |
| Connecticut: | $96,890 |
Change in median household income between 2000 and 2022:| Burlington, Connecticut: | +69.4% |
| Connecticut: | +68.5% |
Number of households with income < $10k:| Burlington: | 4.2% (30,471) |
| Connecticut: | 4.2% (42,265) |
Number of households with income $10k - 20k:| Burlington: | 4.9% (35,033) |
| State: | 4.8% (48,323) |
Number of households with income $20k - 30k:| Burlington: | 5.8% (41,663) |
| Connecticut: | 5.7% (57,716) |
Number of households with income $30k - 40k:| Burlington: | 5.4% (38,566) |
| State: | 5.3% (53,827) |
Number of households with income $40k - 50k:| Burlington: | 5.3% (38,406) |
| State: | 5.3% (53,301) |
Number of households with income $50k - 60k:| Burlington: | 5.6% (39,969) |
| Connecticut: | 5.5% (55,690) |
Number of households with income $60k - 75k:| Burlington: | 7.9% (57,118) |
| State: | 8.0% (80,329) |
Number of households with income $75k - 100k:| Burlington: | 12.7% (91,524) |
| State: | 12.7% (128,070) |
Number of households with income $100k - 125k:| Burlington: | 10.0% (71,868) |
| State: | 10.0% (101,210) |
Number of households with income $125k - 150k:| Burlington: | 8.0% (57,698) |
| State: | 8.0% (81,250) |
Number of households with income $150k - 200k:| Burlington: | 11.8% (84,839) |
| Connecticut: | 11.8% (119,527) |
Number of households with income > $200k:| Burlington: | 18.4% (132,812) |
| State: | 18.6% (187,875) |
Aggregate household income in Burlington in 2022: $9,457,497,374
Median family income in Burlington in 2022:| Burlington: | $160,342 |
| Connecticut: | $128,955 |
Number of families with income < $10k:| Burlington: | 0.5% (12) |
| Connecticut: | 1.9% (11,537) |
Number of families with income $10k - 20k:| Burlington: | 0.8% (19) |
| State: | 1.8% (11,289) |
Number of families with income $20k - 30k:| Burlington: | 1.0% (26) |
| State: | 3.0% (18,506) |
Number of families with income $30k - 40k:| Burlington: | 1.8% (45) |
| State: | 2.9% (18,160) |
Number of families with income $40k - 50k:| Burlington: | 2.3% (57) |
| State: | 3.9% (24,550) |
Number of families with income $50k - 60k:| Burlington: | 2.7% (67) |
| Connecticut: | 4.3% (26,723) |
Number of families with income $60k - 75k:| Burlington: | 7.0% (175) |
| State: | 7.1% (44,075) |
Number of families with income $75k - 100k:| Burlington: | 11.1% (277) |
| Connecticut: | 12.5% (77,679) |
Number of families with income $100k - 125k:| Burlington: | 15.6% (389) |
| State: | 11.1% (69,086) |
Number of families with income $125k - 150k:| Burlington: | 11.4% (286) |
| Connecticut: | 9.6% (59,616) |
Number of families with income $150k - 200k:| Burlington: | 26.0% (651) |
| Connecticut: | 15.7% (97,890) |
Number of families with income > $200k:| Burlington: | 19.9% (498) |
| State: | 26.3% (163,417) |
Median non-family income in Burlington in 2022:| Burlington: | $86,295 |
| Connecticut: | $54,067 |
Change in median non-family income between 2000 and 2022:| Burlington, Connecticut: | +73.7% |
| State: | +68.7% |
Median per capita income in Burlington in 2022:| Burlington: | $70,084 |
| State: | $59,916 |
Change in median per capita income between 2000 and 2022:| Burlington, Connecticut: | +92.1% |
| State: | +90.2% |
Income statistics for Black or African American residents
Median household income in Burlington, CT in 2022:| Burlington: | $68,135 |
| State: | $61,803 |
Change in median household income between 2000 and 2022:| Burlington, Connecticut: | +60.9% |
| State: | +76.1% |
Number of households with income < $10k:| Burlington: | 6.8% (11,452) |
| State: | 6.8% (9,494) |
Number of households with income $10k - 20k:| Burlington: | 7.9% (13,272) |
| Connecticut: | 7.9% (11,003) |
Number of households with income $20k - 30k:| Burlington: | 10.8% (18,147) |
| Connecticut: | 10.8% (15,045) |
Number of households with income $30k - 40k:| Burlington: | 8.2% (13,873) |
| State: | 8.2% (11,501) |
Number of households with income $40k - 50k:| Burlington: | 7.4% (12,565) |
| State: | 7.4% (10,416) |
Number of households with income $50k - 60k:| Burlington: | 7.5% (12,707) |
| Connecticut: | 7.5% (10,534) |
Number of households with income $60k - 75k:| Burlington: | 8.0% (13,563) |
| State: | 8.0% (11,244) |
Number of households with income $75k - 100k:| Burlington: | 9.6% (16,127) |
| State: | 9.6% (13,370) |
Number of households with income $100k - 125k:| Burlington: | 10.2% (17,182) |
| State: | 10.2% (14,244) |
Number of households with income $125k - 150k:| Burlington: | 8.0% (13,565) |
| State: | 8.0% (11,246) |
Number of households with income $150k - 200k:| Burlington: | 7.7% (12,939) |
| State: | 7.7% (10,727) |
Number of households with income > $200k:| Burlington: | 7.9% (13,372) |
| Connecticut: | 7.9% (11,086) |
Aggregate household income in Burlington in 2022: $5,716,020
Median family income in Burlington in 2022:| Burlington: | $227,228 |
| Connecticut: | $87,228 |
Number of families with income $100k - 125k:| Burlington: | 100.0% (19) |
| State: | 11.4% (9,482) |
Median non-family income in Burlington in 2022:| Burlington: | $73,004 |
| State: | $38,608 |
Change in median non-family income between 2000 and 2022:| Burlington, Connecticut: | +77.0% |
| State: | +77.0% |
Median per capita income in Burlington in 2022:| Burlington: | $73,323 |
| State: | $36,289 |
Change in median per capita income between 2000 and 2022:| Burlington, Connecticut: | +115.2% |
| State: | +117.5% |
Income statistics for Asian residents
Median household income in Burlington, CT in 2022:| Burlington: | $263,271 |
| State: | $110,568 |
Change in median household income between 2000 and 2022:| Burlington, Connecticut: | +110.1% |
| Connecticut: | +79.5% |
Number of households with income < $10k:| Burlington: | 7.1% (8,638) |
| State: | 7.1% (4,245) |
Number of households with income $10k - 20k:| Burlington: | 3.5% (4,247) |
| Connecticut: | 3.5% (2,087) |
Number of households with income $20k - 30k:| Burlington: | 4.1% (5,013) |
| State: | 4.1% (2,464) |
Number of households with income $30k - 40k:| Burlington: | 4.1% (5,042) |
| State: | 4.1% (2,478) |
Number of households with income $40k - 50k:| Burlington: | 3.3% (4,035) |
| Connecticut: | 3.3% (1,983) |
Number of households with income $50k - 60k:| Burlington: | 3.9% (4,737) |
| Connecticut: | 3.9% (2,328) |
Number of households with income $60k - 75k:| Burlington: | 7.0% (8,603) |
| Connecticut: | 7.0% (4,228) |
Number of households with income $75k - 100k:| Burlington: | 11.5% (14,062) |
| State: | 11.5% (6,911) |
Number of households with income $100k - 125k:| Burlington: | 10.2% (12,467) |
| Connecticut: | 10.2% (6,127) |
Number of households with income $125k - 150k:| Burlington: | 8.5% (10,335) |
| State: | 8.5% (5,079) |
Number of households with income $150k - 200k:| Burlington: | 12.4% (15,126) |
| Connecticut: | 12.4% (7,434) |
Number of households with income > $200k:| Burlington: | 24.4% (29,832) |
| State: | 24.4% (14,661) |
Aggregate household income in Burlington in 2022: $6,076,298
Median family income in Burlington in 2022:| Burlington: | $260,418 |
| Connecticut: | $134,548 |
Number of families with income $60k - 75k:| Burlington: | 20.4% (5) |
| State: | 6.0% (2,651) |
Number of families with income $125k - 150k:| Burlington: | 79.6% (19) |
| State: | 8.2% (3,588) |
Median per capita income in Burlington in 2022:| Burlington: | $52,554 |
| State: | $55,295 |
Change in median per capita income between 2000 and 2022:| Burlington, Connecticut: | +103.6% |
| State: | +97.8% |
Income statistics for Hispanic or Latino residents
Median household income in Burlington, CT in 2022:| Burlington: | $139,752 |
| State: | $60,275 |
Change in median household income between 2000 and 2022:| Burlington, Connecticut: | +67.8% |
| Connecticut: | +87.9% |
Number of households with income < $10k:| Burlington: | 8.7% (48,256) |
| Connecticut: | 8.7% (18,584) |
Number of households with income $10k - 20k:| Burlington: | 9.1% (49,946) |
| State: | 9.1% (19,235) |
Number of households with income $20k - 30k:| Burlington: | 8.9% (49,308) |
| State: | 8.9% (18,989) |
Number of households with income $30k - 40k:| Burlington: | 7.5% (41,461) |
| State: | 7.5% (15,967) |
Number of households with income $40k - 50k:| Burlington: | 8.7% (47,950) |
| State: | 8.7% (18,466) |
Number of households with income $50k - 60k:| Burlington: | 6.9% (38,187) |
| State: | 6.9% (14,706) |
Number of households with income $60k - 75k:| Burlington: | 8.9% (49,046) |
| Connecticut: | 8.9% (18,888) |
Number of households with income $75k - 100k:| Burlington: | 13.5% (74,444) |
| Connecticut: | 13.5% (28,669) |
Number of households with income $100k - 125k:| Burlington: | 8.2% (45,270) |
| State: | 8.2% (17,434) |
Number of households with income $125k - 150k:| Burlington: | 6.5% (35,709) |
| Connecticut: | 6.5% (13,752) |
Number of households with income $150k - 200k:| Burlington: | 6.6% (36,649) |
| State: | 6.6% (14,114) |
Number of households with income > $200k:| Burlington: | 6.4% (35,393) |
| State: | 6.4% (13,630) |
Aggregate household income in Burlington in 2022: $17,308,601
Median family income in Burlington in 2022:| Burlington: | $142,490 |
| Connecticut: | $68,336 |
Number of families with income < $10k:| Burlington: | 1.4% (6) |
| Connecticut: | 5.2% (7,456) |
Number of families with income $10k - 20k:| Burlington: | 3.6% (16) |
| Connecticut: | 6.0% (8,616) |
Number of families with income $20k - 30k:| Burlington: | 4.2% (19) |
| Connecticut: | 8.9% (12,680) |
Number of families with income $30k - 40k:| Burlington: | 5.8% (26) |
| State: | 8.5% (12,090) |
Number of families with income $40k - 50k:| Burlington: | 6.2% (28) |
| State: | 8.8% (12,624) |
Number of families with income $50k - 60k:| Burlington: | 6.7% (30) |
| Connecticut: | 8.4% (11,924) |
Number of families with income $60k - 75k:| Burlington: | 10.5% (47) |
| State: | 8.9% (12,677) |
Number of families with income $75k - 100k:| Burlington: | 15.8% (71) |
| State: | 14.3% (20,457) |
Number of families with income $100k - 125k:| Burlington: | 13.8% (62) |
| State: | 8.2% (11,720) |
Number of families with income $125k - 150k:| Burlington: | 12.0% (54) |
| State: | 8.2% (11,729) |
Number of families with income $150k - 200k:| Burlington: | 13.6% (61) |
| Connecticut: | 7.1% (10,096) |
Number of families with income > $200k:| Burlington: | 6.2% (28) |
| Connecticut: | 7.4% (10,622) |
Median per capita income in Burlington in 2022:| Burlington: | $21,400 |
| State: | $28,507 |
Change in median per capita income between 2000 and 2022:| Burlington, Connecticut: | +80.3% |
| Connecticut: | +117.2% |
Income statistics for Multirace residents
Median household income in Burlington, CT in 2022:| Burlington: | $198,019 |
| Connecticut: | $77,277 |
Change in median household income between 2000 and 2022:| Burlington, Connecticut: | +119.4% |
| Connecticut: | +113.6% |
Number of households with income < $10k:| Burlington: | 6.0% (18,596) |
| State: | 6.0% (7,457) |
Number of households with income $10k - 20k:| Burlington: | 8.1% (25,284) |
| Connecticut: | 8.1% (10,139) |
Number of households with income $20k - 30k:| Burlington: | 7.0% (21,700) |
| State: | 7.0% (8,702) |
Number of households with income $30k - 40k:| Burlington: | 6.9% (21,311) |
| Connecticut: | 6.9% (8,546) |
Number of households with income $40k - 50k:| Burlington: | 7.0% (21,725) |
| State: | 7.0% (8,712) |
Number of households with income $50k - 60k:| Burlington: | 5.9% (18,281) |
| State: | 5.9% (7,331) |
Number of households with income $60k - 75k:| Burlington: | 8.5% (26,518) |
| Connecticut: | 8.5% (10,634) |
Number of households with income $75k - 100k:| Burlington: | 14.1% (43,889) |
| State: | 14.1% (17,600) |
Number of households with income $100k - 125k:| Burlington: | 9.9% (30,879) |
| State: | 9.9% (12,383) |
Number of households with income $125k - 150k:| Burlington: | 7.2% (22,246) |
| State: | 7.2% (8,921) |
Number of households with income $150k - 200k:| Burlington: | 8.8% (27,236) |
| State: | 8.8% (10,922) |
Number of households with income > $200k:| Burlington: | 10.6% (33,034) |
| State: | 10.6% (13,247) |
Aggregate household income in Burlington in 2022: $30,556,077
Median family income in Burlington in 2022:| Burlington: | $180,558 |
| Connecticut: | $84,255 |
Number of families with income $20k - 30k:| Burlington: | 11.0% (15) |
| State: | 6.9% (5,812) |
Number of families with income $75k - 100k:| Burlington: | 89.0% (121) |
| State: | 14.5% (12,236) |
Median non-family income in Burlington in 2022:| Burlington: | $164,653 |
| State: | $44,462 |
Change in median non-family income between 2000 and 2022:| Burlington, Connecticut: | +81.0% |
| Connecticut: | +97.6% |
Median per capita income in Burlington in 2022:| Burlington: | $47,098 |
| State: | $32,794 |
Change in median per capita income between 2000 and 2022:| Burlington, Connecticut: | +95.5% |
| State: | +117.2% |
Income statistics for other residents
Number of households with income < $10k:| Burlington: | 8.3% (3) |
| Connecticut: | 9.0% (8,596) |
Number of households with income $10k - 20k:| Burlington: | 11.1% (4) |
| State: | 10.2% (9,773) |
Number of households with income $20k - 30k:| Burlington: | 11.1% (4) |
| State: | 9.1% (8,691) |
Number of households with income $30k - 40k:| Burlington: | 5.6% (2) |
| Connecticut: | 7.8% (7,447) |
Number of households with income $40k - 50k:| Burlington: | 8.3% (3) |
| Connecticut: | 8.2% (7,860) |
Number of households with income $50k - 60k:| Burlington: | 5.6% (2) |
| State: | 6.0% (5,757) |
Number of households with income $60k - 75k:| Burlington: | 11.1% (4) |
| State: | 9.3% (8,942) |
Number of households with income $75k - 100k:| Burlington: | 13.9% (5) |
| State: | 14.3% (13,700) |
Number of households with income $100k - 125k:| Burlington: | 8.3% (3) |
| State: | 7.2% (6,906) |
Number of households with income $125k - 150k:| Burlington: | 5.6% (2) |
| State: | 6.5% (6,215) |
Number of households with income $150k - 200k:| Burlington: | 5.6% (2) |
| Connecticut: | 6.1% (5,865) |
Number of households with income > $200k:| Burlington: | 5.6% (2) |
| State: | 6.3% (6,065) |
Aggregate household income in Burlington in 2022: $5,298,525
Median family income in Burlington in 2022:| Burlington: | $213,733 |
| State: | $67,610 |
Number of families with income $75k - 100k:| Burlington: | 100.0% (37) |
| State: | 15.7% (10,362) |
Median per capita income in Burlington in 2022:| Burlington: | $45,454 |
| State: | $29,353 |