The median household income in Bristol, TN in 2022 was $48,432, which was 34.7% less than the median annual income of $65,254 across the entire state of Tennessee. Compared to the median income of $30,039 in 2000 this represents an increase of 38.0%. The per capita income in 2022 was $29,923, which means an increase of 38.1% compared to 2000 when it was $18,535.
Whole page based on the data from 2000 / 2022 when the population of Bristol, Tennessee was 24,821 / 27,668
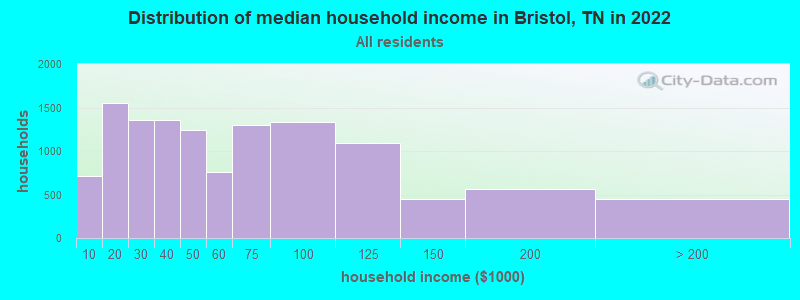
Income statistics for all residents
Median household income in Bristol, TN in 2022:
Bristol:
$48,432
State:
$65,254
Change in median household income between 2000 and 2022:
Bristol, Tennessee:
+61.2%
State:
+79.5%
Number of households with income < $10k:
Bristol:
5.9% (715)
Tennessee:
5.4% (154,793)
Number of households with income $10k - 20k:
Bristol:
12.8% (1,555)
State:
8.0% (228,599)
Number of households with income $20k - 30k:
Bristol:
11.1% (1,355)
Tennessee:
7.9% (224,908)
Number of households with income $30k - 40k:
Bristol:
11.1% (1,352)
State:
8.6% (244,297)
Number of households with income $40k - 50k:
Bristol:
10.2% (1,245)
Tennessee:
8.4% (238,949)
Number of households with income $50k - 60k:
Bristol:
6.3% (762)
Tennessee:
7.7% (218,438)
Number of households with income $60k - 75k:
Bristol:
10.7% (1,295)
State:
10.3% (294,172)
Number of households with income $75k - 100k:
Bristol:
11.0% (1,333)
State:
13.3% (377,310)
Number of households with income $100k - 125k:
Bristol:
9.0% (1,092)
State:
9.5% (269,124)
Number of households with income $125k - 150k:
Bristol:
3.7% (446)
State:
6.3% (178,328)
Number of households with income $150k - 200k:
Bristol:
4.6% (559)
State:
7.2% (204,030)
Number of households with income > $200k:
Bristol:
3.7% (444)
State:
7.5% (213,736)
Aggregate household income in Bristol in 2022: $831,520,703
Median family income in Bristol in 2022:
Bristol:
$59,005
Tennessee:
$80,910
Number of families with income < $10k:
Bristol:
6.3% (460)
Tennessee:
3.9% (72,917)
Number of families with income $10k - 20k:
Bristol:
5.7% (422)
Tennessee:
4.0% (73,770)
Number of families with income $20k - 30k:
Bristol:
8.5% (623)
State:
5.6% (104,070)
Number of families with income $30k - 40k:
Bristol:
10.4% (769)
Tennessee:
7.2% (133,292)
Number of families with income $40k - 50k:
Bristol:
11.9% (875)
State:
7.4% (136,997)
Number of families with income $50k - 60k:
Bristol:
6.9% (511)
Tennessee:
7.1% (131,374)
Number of families with income $60k - 75k:
Bristol:
10.2% (751)
State:
10.8% (198,685)
Number of families with income $75k - 100k:
Bristol:
11.8% (870)
State:
15.1% (279,195)
Number of families with income $100k - 125k:
Bristol:
12.0% (881)
State:
11.7% (216,356)
Number of families with income $125k - 150k:
Bristol:
4.9% (364)
Tennessee:
7.8% (144,000)
Number of families with income $150k - 200k:
Bristol:
6.5% (481)
State:
9.3% (172,160)
Number of families with income > $200k:
Bristol:
4.8% (353)
State:
10.0% (183,756)
Median non-family income in Bristol in 2022:
Bristol:
$31,091
Tennessee:
$40,285
Change in median non-family income between 2000 and 2022:
Bristol, Tennessee:
+82.3%
State:
+91.5%
Median per capita income in Bristol in 2022:
Bristol:
$29,924
State:
$36,704
Change in median per capita income between 2000 and 2022:
Bristol, Tennessee:
+61.4%
State:
+89.3%
Income statistics for White residents
Median household income in Bristol, TN in 2022:
Bristol:
$48,483
State:
$69,826
Change in median household income between 2000 and 2022:
Bristol, Tennessee:
+61.4%
State:
+82.9%
Number of households with income < $10k:
Bristol:
5.9% (655)
State:
4.6% (100,279)
Number of households with income $10k - 20k:
Bristol:
12.6% (1,409)
State:
7.6% (165,031)
Number of households with income $20k - 30k:
Bristol:
11.6% (1,300)
Tennessee:
7.4% (160,229)
Number of households with income $30k - 40k:
Bristol:
10.5% (1,178)
Tennessee:
8.1% (174,784)
Number of households with income $40k - 50k:
Bristol:
10.4% (1,163)
State:
7.8% (169,622)
Number of households with income $50k - 60k:
Bristol:
6.5% (726)
State:
7.6% (165,508)
Number of households with income $60k - 75k:
Bristol:
9.3% (1,042)
State:
10.3% (223,937)
Number of households with income $75k - 100k:
Bristol:
11.2% (1,252)
Tennessee:
13.5% (292,688)
Number of households with income $100k - 125k:
Bristol:
9.1% (1,019)
State:
10.1% (219,251)
Number of households with income $125k - 150k:
Bristol:
4.1% (463)
State:
6.6% (142,574)
Number of households with income $150k - 200k:
Bristol:
4.9% (544)
State:
7.7% (166,039)
Number of households with income > $200k:
Bristol:
3.8% (425)
Tennessee:
8.5% (184,546)
Aggregate household income in Bristol in 2022: $779,841,377
Median family income in Bristol in 2022:
Bristol:
$58,985
State:
$86,015
Number of families with income < $10k:
Bristol:
6.0% (410)
Tennessee:
3.1% (43,751)
Number of families with income $10k - 20k:
Bristol:
5.9% (402)
State:
3.5% (49,925)
Number of families with income $20k - 30k:
Bristol:
8.5% (578)
State:
5.0% (70,431)
Number of families with income $30k - 40k:
Bristol:
10.1% (688)
State:
6.6% (93,498)
Number of families with income $40k - 50k:
Bristol:
12.4% (845)
State:
6.8% (96,726)
Number of families with income $50k - 60k:
Bristol:
6.9% (472)
State:
7.2% (101,879)
Number of families with income $60k - 75k:
Bristol:
8.9% (606)
State:
10.7% (151,997)
Number of families with income $75k - 100k:
Bristol:
12.0% (816)
State:
15.4% (218,373)
Number of families with income $100k - 125k:
Bristol:
12.1% (822)
Tennessee:
12.6% (178,761)
Number of families with income $125k - 150k:
Bristol:
5.6% (380)
State:
8.2% (116,575)
Number of families with income $150k - 200k:
Bristol:
6.8% (462)
Tennessee:
9.9% (141,123)
Number of families with income > $200k:
Bristol:
4.9% (333)
State:
11.2% (159,431)
Median non-family income in Bristol in 2022:
Bristol:
$30,101
Tennessee:
$41,178
Change in median non-family income between 2000 and 2022:
Bristol, Tennessee:
+74.0%
State:
+91.1%
Median per capita income in Bristol in 2022:
Bristol:
$31,234
State:
$40,126
Change in median per capita income between 2000 and 2022:
Bristol, Tennessee:
+66.7%
State:
+92.6%
Income statistics for Black or African American residents
Median household income in Bristol, TN in 2022:
Bristol:
$17,287
State:
$49,531
Change in median household income between 2000 and 2022:: -27.7%
Bristol, Tennessee:
-27.7%
State:
+82.3%
Number of households with income < $10k:
Bristol:
0.0% (0)
State:
9.1% (39,909)
Number of households with income $10k - 20k:
Bristol:
18.7% (60)
Tennessee:
10.5% (46,276)
Number of households with income $20k - 30k:
Bristol:
4.0% (13)
State:
10.2% (45,072)
Number of households with income $30k - 40k:
Bristol:
22.1% (71)
State:
10.0% (43,885)
Number of households with income $40k - 50k:
Bristol:
3.1% (10)
State:
10.7% (47,267)
Number of households with income $50k - 60k:
Bristol:
6.5% (21)
Tennessee:
7.7% (33,868)
Number of households with income $60k - 75k:
Bristol:
22.4% (72)
State:
10.5% (46,247)
Number of households with income $75k - 100k:
Bristol:
16.2% (52)
State:
12.6% (55,465)
Number of households with income $100k - 125k:
Bristol:
3.7% (12)
State:
6.7% (29,515)
Number of households with income $125k - 150k:
Bristol:
0.0% (0)
State:
4.8% (21,306)
Number of households with income $150k - 200k:
Bristol:
0.0% (0)
State:
4.6% (20,425)
Number of households with income > $200k:
Bristol:
3.1% (10)
State:
2.5% (11,183)
Aggregate household income in Bristol in 2022: $19,464,733
Median family income in Bristol in 2022:
Bristol:
$50,162
Tennessee:
$61,153
Number of families with income $10k - 20k:
Bristol:
2.8% (6)
Tennessee:
6.0% (15,530)
Number of families with income $30k - 40k:
Bristol:
26.3% (53)
State:
9.3% (24,089)
Number of families with income $40k - 50k:
Bristol:
24.4% (49)
State:
10.2% (26,463)
Number of families with income $50k - 60k:
Bristol:
9.8% (20)
State:
6.9% (17,798)
Number of families with income $60k - 75k:
Bristol:
17.6% (35)
State:
11.6% (30,015)
Number of families with income $75k - 100k:
Bristol:
14.3% (29)
State:
14.7% (38,065)
Number of families with income > $200k:
Bristol:
4.8% (10)
State:
3.4% (8,711)
Median non-family income in Bristol in 2022:
Bristol:
$11,946
State:
$35,793
Change in median non-family income between 2000 and 2022:
Bristol, Tennessee:
+13.5%
Tennessee:
+104.3%
Median per capita income in Bristol in 2022:
Bristol:
$14,522
State:
$27,306
Change in median per capita income between 2000 and 2022:
Bristol, Tennessee:
+8.7%
Tennessee:
+105.3%
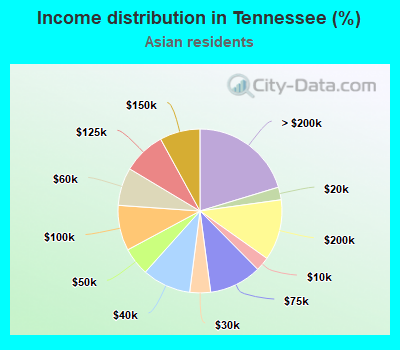
Income statistics for Asian residents
Number of households with income < $10k:
Bristol:
0.0% (0)
State:
2.8% (1,217)
Number of households with income $10k - 20k:
Bristol:
82.5% (33)
State:
2.5% (1,093)
Number of households with income $20k - 30k:
Bristol:
0.0% (0)
State:
4.1% (1,796)
Number of households with income $30k - 40k:
Bristol:
0.0% (0)
State:
9.6% (4,208)
Number of households with income $40k - 50k:
Bristol:
0.0% (0)
Tennessee:
5.5% (2,423)
Number of households with income $50k - 60k:
Bristol:
0.0% (0)
State:
7.5% (3,277)
Number of households with income $60k - 75k:
Bristol:
17.5% (7)
State:
10.3% (4,520)
Number of households with income $75k - 100k:
Bristol:
0.0% (0)
Tennessee:
9.0% (3,926)
Number of households with income $100k - 125k:
Bristol:
0.0% (0)
State:
8.4% (3,699)
Number of households with income $125k - 150k:
Bristol:
0.0% (0)
State:
8.0% (3,488)
Number of households with income $150k - 200k:
Bristol:
0.0% (0)
State:
12.0% (5,262)
Number of households with income > $200k:
Bristol:
0.0% (0)
Tennessee:
20.3% (8,903)
Aggregate household income in Bristol in 2022: $8,631,005
Median per capita income in Bristol in 2022:
Bristol:
$11,768
State:
$46,931
Change in median per capita income between 2000 and 2022:: -44.1%
Bristol, Tennessee:
-44.1%
State:
+130.8%
Income statistics for Hispanic or Latino residents
Median household income in Bristol, TN in 2022:
Bristol:
$64,163
State:
$58,385
Change in median household income between 2000 and 2022:
Bristol, Tennessee:
+144.4%
Tennessee:
+82.3%
Number of households with income < $10k:
Bristol:
3.4% (11)
State:
7.2% (8,567)
Number of households with income $10k - 20k:
Bristol:
12.8% (41)
State:
6.4% (7,670)
Number of households with income $20k - 30k:
Bristol:
7.8% (25)
State:
9.4% (11,247)
Number of households with income $30k - 40k:
Bristol:
3.4% (11)
State:
10.1% (12,072)
Number of households with income $40k - 50k:
Bristol:
18.4% (59)
State:
10.0% (11,947)
Number of households with income $50k - 60k:
Bristol:
2.8% (9)
Tennessee:
8.0% (9,569)
Number of households with income $60k - 75k:
Bristol:
34.3% (110)
Tennessee:
10.3% (12,315)
Number of households with income $75k - 100k:
Bristol:
3.4% (11)
Tennessee:
15.3% (18,285)
Number of households with income $100k - 125k:
Bristol:
9.7% (31)
State:
8.3% (9,886)
Number of households with income $125k - 150k:
Bristol:
2.2% (7)
Tennessee:
5.9% (7,066)
Number of households with income $150k - 200k:
Bristol:
1.9% (6)
State:
4.9% (5,822)
Number of households with income > $200k:
Bristol:
0.0% (0)
State:
4.5% (5,337)
Aggregate household income in Bristol in 2022: $16,019,871
Median family income in Bristol in 2022:
Bristol:
$65,859
Tennessee:
$64,014
Number of families with income $10k - 20k:
Bristol:
9.0% (20)
State:
5.4% (4,773)
Number of families with income $20k - 30k:
Bristol:
10.4% (23)
Tennessee:
9.2% (8,233)
Number of families with income $40k - 50k:
Bristol:
2.7% (6)
State:
8.8% (7,850)
Number of families with income $50k - 60k:
Bristol:
4.2% (9)
State:
7.9% (7,017)
Number of families with income $60k - 75k:
Bristol:
48.6% (108)
State:
10.8% (9,605)
Number of families with income $75k - 100k:
Bristol:
9.0% (20)
State:
16.6% (14,820)
Number of families with income $100k - 125k:
Bristol:
13.3% (30)
State:
8.4% (7,480)
Number of families with income $150k - 200k:
Bristol:
2.9% (6)
State:
5.4% (4,817)
Median non-family income in Bristol in 2022:
Bristol:
$58,720
Tennessee:
$39,279
Change in median non-family income between 2000 and 2022:
Bristol, Tennessee:
+95.7%
State:
+69.2%
Median per capita income in Bristol in 2022:
Bristol:
$15,991
State:
$21,276
Change in median per capita income between 2000 and 2022:
Bristol, Tennessee:
+10.2%
State:
+76.0%
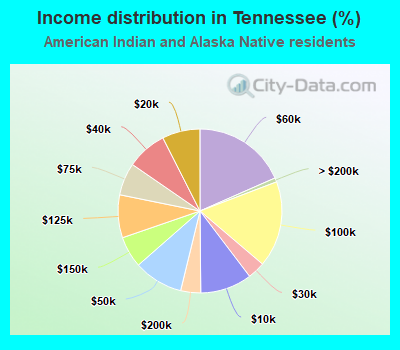
Income statistics for American Indian and Alaska Native residents
Number of households with income < $10k:
Bristol:
46.7% (7)
State:
10.2% (535)
Number of households with income $10k - 20k:
Bristol:
0.0% (0)
State:
7.5% (392)
Number of households with income $20k - 30k:
Bristol:
6.7% (1)
State:
3.4% (181)
Number of households with income $30k - 40k:
Bristol:
0.0% (0)
Tennessee:
7.9% (416)
Number of households with income $40k - 50k:
Bristol:
46.7% (7)
Tennessee:
9.7% (511)
Number of households with income $50k - 60k:
Bristol:
0.0% (0)
State:
18.4% (966)
Number of households with income $60k - 75k:
Bristol:
0.0% (0)
Tennessee:
6.4% (337)
Number of households with income $75k - 100k:
Bristol:
0.0% (0)
State:
17.0% (892)
Number of households with income $100k - 125k:
Bristol:
0.0% (0)
State:
8.5% (444)
Number of households with income $125k - 150k:
Bristol:
0.0% (0)
State:
6.2% (324)
Number of households with income $150k - 200k:
Bristol:
0.0% (0)
State:
3.9% (207)
Number of households with income > $200k:
Bristol:
0.0% (0)
State:
0.8% (43)
Median per capita income in Bristol in 2022:
Bristol:
$12,504
Tennessee:
$25,981
Income statistics for Multirace residents
Median household income in Bristol, TN in 2022:
Bristol:
$39,579
State:
$57,741
Change in median household income between 2000 and 2022:
Bristol, Tennessee:
+22.6%
State:
+87.1%
Number of households with income < $10k:
Bristol:
8.2% (58)
State:
6.7% (9,867)
Number of households with income $10k - 20k:
Bristol:
5.2% (37)
State:
8.6% (12,639)
Number of households with income $20k - 30k:
Bristol:
8.1% (57)
State:
9.2% (13,555)
Number of households with income $30k - 40k:
Bristol:
16.0% (113)
State:
10.3% (15,117)
Number of households with income $40k - 50k:
Bristol:
19.7% (139)
State:
9.4% (13,829)
Number of households with income $50k - 60k:
Bristol:
0.8% (6)
Tennessee:
7.5% (10,969)
Number of households with income $60k - 75k:
Bristol:
33.0% (233)
State:
9.2% (13,568)
Number of households with income $75k - 100k:
Bristol:
5.0% (35)
State:
12.6% (18,516)
Number of households with income $100k - 125k:
Bristol:
1.3% (9)
State:
8.6% (12,656)
Number of households with income $125k - 150k:
Bristol:
0.0% (0)
State:
5.9% (8,674)
Number of households with income $150k - 200k:
Bristol:
2.8% (20)
State:
7.2% (10,611)
Number of households with income > $200k:
Bristol:
0.0% (0)
State:
4.8% (6,986)
Aggregate household income in Bristol in 2022: $35,612,356
Median family income in Bristol in 2022:
Bristol:
$54,434
Tennessee:
$70,058
Number of families with income < $10k:
Bristol:
1.7% (7)
State:
5.6% (5,426)
Number of families with income $10k - 20k:
Bristol:
9.7% (38)
State:
6.6% (6,301)
Number of families with income $20k - 30k:
Bristol:
14.3% (56)
State:
7.7% (7,412)
Number of families with income $30k - 40k:
Bristol:
17.0% (67)
State:
9.0% (8,699)
Number of families with income $40k - 50k:
Bristol:
4.7% (18)
State:
8.2% (7,919)
Number of families with income $50k - 60k:
Bristol:
0.8% (3)
Tennessee:
6.9% (6,630)
Number of families with income $60k - 75k:
Bristol:
34.8% (137)
State:
9.6% (9,232)
Number of families with income $75k - 100k:
Bristol:
9.6% (38)
Tennessee:
15.0% (14,413)
Number of families with income $100k - 125k:
Bristol:
2.1% (8)
Tennessee:
9.1% (8,743)
Number of families with income $150k - 200k:
Bristol:
5.2% (21)
State:
8.7% (8,373)
Median non-family income in Bristol in 2022:
Bristol:
$44,424
Tennessee:
$39,395
Change in median non-family income between 2000 and 2022:
Bristol, Tennessee:
+40.3%
State:
+99.1%
Median per capita income in Bristol in 2022:
Bristol:
$17,667
State:
$24,436
Change in median per capita income between 2000 and 2022:
Bristol, Tennessee:
+4.8%
State:
+84.3%
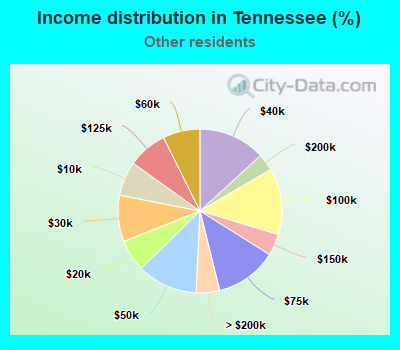
Income statistics for other residents
Median household income in Bristol, TN in 2022:
Bristol:
$179,189
State:
$54,475
Number of households with income < $10k:
Bristol:
0.0% (0)
State:
6.8% (2,986)
Number of households with income $10k - 20k:
Bristol:
0.0% (0)
State:
6.3% (2,777)
Number of households with income $20k - 30k:
Bristol:
0.0% (0)
State:
9.2% (4,034)
Number of households with income $30k - 40k:
Bristol:
0.0% (0)
State:
13.2% (5,819)
Number of households with income $40k - 50k:
Bristol:
0.0% (0)
State:
11.9% (5,244)
Number of households with income $50k - 60k:
Bristol:
24.3% (9)
Tennessee:
7.3% (3,232)
Number of households with income $60k - 75k:
Bristol:
0.0% (0)
State:
12.2% (5,384)
Number of households with income $75k - 100k:
Bristol:
0.0% (0)
State:
13.1% (5,771)
Number of households with income $100k - 125k:
Bristol:
62.2% (23)
State:
7.8% (3,429)
Number of households with income $125k - 150k:
Bristol:
0.0% (0)
State:
4.3% (1,881)
Number of households with income $150k - 200k:
Bristol:
13.5% (5)
State:
3.4% (1,486)
Number of households with income > $200k:
Bristol:
0.0% (0)
State:
4.6% (2,040)
Aggregate household income in Bristol in 2022: $8,042,725
Median family income in Bristol in 2022:
Bristol:
$114,445
State:
$60,601
Number of families with income $50k - 60k:
Bristol:
23.2% (9)
State:
7.0% (2,361)
Number of families with income $100k - 125k:
Bristol:
61.3% (25)
State:
8.1% (2,757)
Number of families with income $150k - 200k:
Bristol:
15.5% (6)
State:
4.4% (1,498)
Median per capita income in Bristol in 2022:
Bristol:
$20,611
State:
$21,430
Discuss Bristol, Tennessee (TN) on our hugely popular Tennessee forum.