Blackstone, Massachusetts (MA) income map, earnings map, and wages data
The median household income in Blackstone, MA in 2022 was $99,391, which was 4.9% greater than the median annual income of $94,488 across the entire state of Massachusetts. Compared to the median income of $55,163 in 2000 this represents an increase of 44.5%. The per capita income in 2022 was $40,820, which means an increase of 48.7% compared to 2000 when it was $20,936.
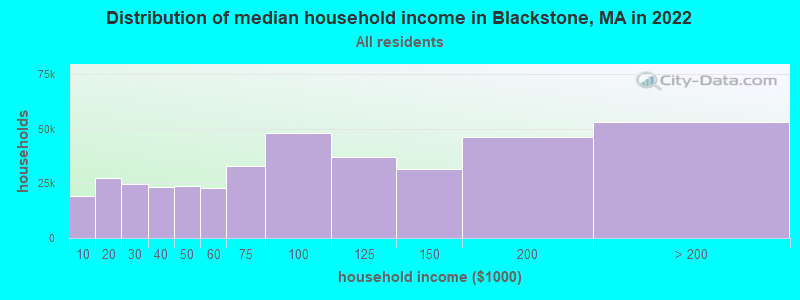
Income statistics for all residents
Median household income in Blackstone, MA in 2022:| Blackstone: | $99,391 |
| Massachusetts: | $94,488 |
Change in median household income between 2000 and 2022:| Blackstone, Massachusetts: | +80.2% |
| Massachusetts: | +87.1% |
Number of households with income < $10k:| Blackstone: | 4.9% (19,119) |
| Massachusetts: | 5.2% (146,170) |
Number of households with income $10k - 20k:| Blackstone: | 7.0% (27,279) |
| State: | 6.4% (180,001) |
Number of households with income $20k - 30k:| Blackstone: | 6.4% (24,843) |
| Massachusetts: | 5.6% (156,667) |
Number of households with income $30k - 40k:| Blackstone: | 5.9% (23,123) |
| State: | 5.6% (157,168) |
Number of households with income $40k - 50k:| Blackstone: | 6.1% (23,679) |
| Massachusetts: | 5.4% (151,455) |
Number of households with income $50k - 60k:| Blackstone: | 5.8% (22,672) |
| State: | 5.1% (142,726) |
Number of households with income $60k - 75k:| Blackstone: | 8.4% (32,900) |
| Massachusetts: | 7.6% (212,203) |
Number of households with income $75k - 100k:| Blackstone: | 12.3% (47,852) |
| State: | 11.3% (317,064) |
Number of households with income $100k - 125k:| Blackstone: | 9.5% (37,143) |
| State: | 9.7% (270,603) |
Number of households with income $125k - 150k:| Blackstone: | 8.1% (31,739) |
| State: | 8.0% (223,140) |
Number of households with income $150k - 200k:| Blackstone: | 11.9% (46,226) |
| State: | 11.0% (308,695) |
Number of households with income > $200k:| Blackstone: | 13.6% (52,986) |
| State: | 19.0% (531,884) |
Aggregate household income in Blackstone in 2022: $3,280,328,067
Median family income in Blackstone in 2022:| Blackstone: | $113,406 |
| Massachusetts: | $120,263 |
Median non-family income in Blackstone in 2022:| Blackstone: | $44,434 |
| Massachusetts: | $55,979 |
Change in median non-family income between 2000 and 2022:| Blackstone, Massachusetts: | +85.7% |
| State: | +88.0% |
Median per capita income in Blackstone in 2022:| Blackstone: | $40,821 |
| State: | $54,025 |
Change in median per capita income between 2000 and 2022:| Blackstone, Massachusetts: | +95.0% |
| State: | +108.2% |
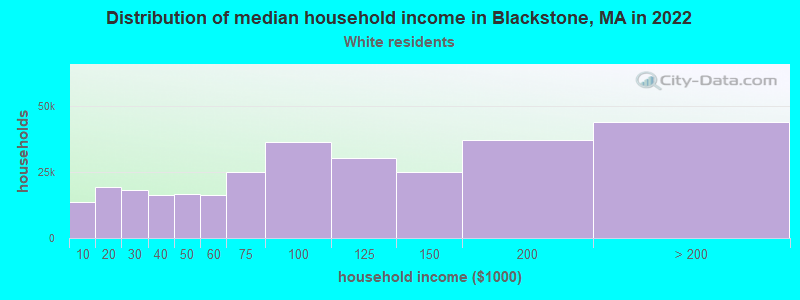
Income statistics for White residents
Median household income in Blackstone, MA in 2022:| Blackstone: | $101,844 |
| State: | $101,391 |
Change in median household income between 2000 and 2022:| Blackstone, Massachusetts: | +85.1% |
| State: | +93.3% |
Number of households with income < $10k:| Blackstone: | 4.6% (13,603) |
| Massachusetts: | 4.4% (91,120) |
Number of households with income $10k - 20k:| Blackstone: | 6.5% (19,452) |
| Massachusetts: | 5.9% (122,055) |
Number of households with income $20k - 30k:| Blackstone: | 6.1% (18,037) |
| State: | 5.1% (105,311) |
Number of households with income $30k - 40k:| Blackstone: | 5.5% (16,274) |
| Massachusetts: | 5.3% (110,239) |
Number of households with income $40k - 50k:| Blackstone: | 5.6% (16,663) |
| State: | 5.0% (104,636) |
Number of households with income $50k - 60k:| Blackstone: | 5.4% (16,159) |
| State: | 4.8% (99,486) |
Number of households with income $60k - 75k:| Blackstone: | 8.4% (25,023) |
| Massachusetts: | 7.5% (155,124) |
Number of households with income $75k - 100k:| Blackstone: | 12.2% (36,366) |
| Massachusetts: | 11.4% (236,252) |
Number of households with income $100k - 125k:| Blackstone: | 10.1% (30,220) |
| Massachusetts: | 9.9% (204,731) |
Number of households with income $125k - 150k:| Blackstone: | 8.4% (24,922) |
| Massachusetts: | 8.5% (175,324) |
Number of households with income $150k - 200k:| Blackstone: | 12.5% (37,128) |
| State: | 11.7% (242,980) |
Number of households with income > $200k:| Blackstone: | 14.7% (43,915) |
| State: | 20.5% (425,966) |
Aggregate household income in Blackstone in 2022: $2,617,337,444
Median family income in Blackstone in 2022:| Blackstone: | $119,432 |
| Massachusetts: | $133,153 |
Number of families with income < $10k:| Blackstone: | 1.2% (20) |
| State: | 2.0% (25,038) |
Number of families with income $10k - 20k:| Blackstone: | 1.9% (30) |
| State: | 2.1% (26,403) |
Number of families with income $20k - 30k:| Blackstone: | 5.7% (94) |
| State: | 2.6% (32,525) |
Number of families with income $30k - 40k:| Blackstone: | 6.5% (107) |
| State: | 3.9% (48,079) |
Number of families with income $40k - 50k:| Blackstone: | 4.4% (72) |
| Massachusetts: | 3.8% (46,908) |
Number of families with income $50k - 60k:| Blackstone: | 6.2% (102) |
| Massachusetts: | 3.8% (46,476) |
Number of families with income $60k - 75k:| Blackstone: | 15.0% (246) |
| State: | 6.4% (79,040) |
Number of families with income $75k - 100k:| Blackstone: | 17.8% (292) |
| Massachusetts: | 11.1% (137,395) |
Number of families with income $100k - 125k:| Blackstone: | 18.0% (295) |
| Massachusetts: | 11.1% (136,771) |
Number of families with income $125k - 150k:| Blackstone: | 6.7% (110) |
| Massachusetts: | 10.0% (123,709) |
Number of families with income $150k - 200k:| Blackstone: | 8.0% (131) |
| State: | 14.7% (181,602) |
Number of families with income > $200k:| Blackstone: | 8.6% (142) |
| Massachusetts: | 28.5% (351,887) |
Median non-family income in Blackstone in 2022:| Blackstone: | $44,571 |
| State: | $59,323 |
Change in median non-family income between 2000 and 2022:| Blackstone, Massachusetts: | +92.0% |
| Massachusetts: | +94.3% |
Median per capita income in Blackstone in 2022:| Blackstone: | $43,295 |
| State: | $60,804 |
Change in median per capita income between 2000 and 2022:| Blackstone, Massachusetts: | +105.3% |
| State: | +118.7% |
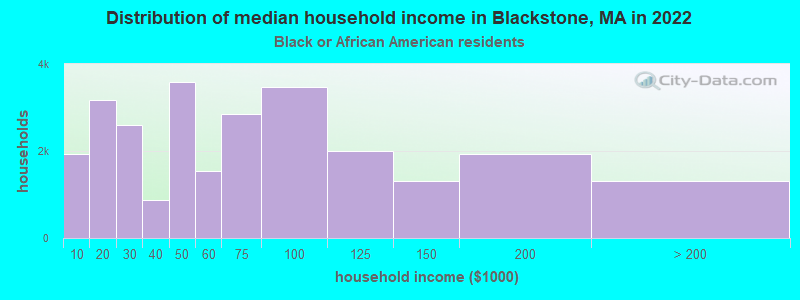
Income statistics for Black or African American residents
Median household income in Blackstone, MA in 2022:| Blackstone: | $102,145 |
| Massachusetts: | $63,189 |
Change in median household income between 2000 and 2022:| Blackstone, Massachusetts: | +69.8% |
| State: | +87.4% |
Number of households with income < $10k:| Blackstone: | 7.3% (1,938) |
| State: | 9.1% (15,797) |
Number of households with income $10k - 20k:| Blackstone: | 11.9% (3,166) |
| State: | 9.4% (16,267) |
Number of households with income $20k - 30k:| Blackstone: | 9.8% (2,608) |
| State: | 7.8% (13,520) |
Number of households with income $30k - 40k:| Blackstone: | 3.3% (865) |
| State: | 8.3% (14,412) |
Number of households with income $40k - 50k:| Blackstone: | 13.5% (3,587) |
| Massachusetts: | 7.9% (13,790) |
Number of households with income $50k - 60k:| Blackstone: | 5.8% (1,534) |
| State: | 5.8% (10,041) |
Number of households with income $60k - 75k:| Blackstone: | 10.7% (2,853) |
| State: | 8.5% (14,822) |
Number of households with income $75k - 100k:| Blackstone: | 13.0% (3,465) |
| State: | 11.0% (19,122) |
Number of households with income $100k - 125k:| Blackstone: | 7.5% (2,000) |
| Massachusetts: | 8.4% (14,575) |
Number of households with income $125k - 150k:| Blackstone: | 5.0% (1,321) |
| State: | 6.0% (10,429) |
Number of households with income $150k - 200k:| Blackstone: | 7.3% (1,927) |
| State: | 7.2% (12,539) |
Number of households with income > $200k:| Blackstone: | 4.9% (1,313) |
| Massachusetts: | 10.5% (18,185) |
Aggregate household income in Blackstone in 2022: $2,640,585
Median family income in Blackstone in 2022:| Blackstone: | $100,495 |
| State: | $79,815 |
Number of families with income $60k - 75k:| Blackstone: | 100.0% (23) |
| State: | 7.9% (8,699) |
Median non-family income in Blackstone in 2022:| Blackstone: | $32,385 |
| Massachusetts: | $38,934 |
Change in median non-family income between 2000 and 2022:| Blackstone, Massachusetts: | +36.4% |
| Massachusetts: | +69.2% |
Median per capita income in Blackstone in 2022:| Blackstone: | $41,728 |
| State: | $33,524 |
Change in median per capita income between 2000 and 2022:| Blackstone, Massachusetts: | +95.7% |
| State: | +109.4% |
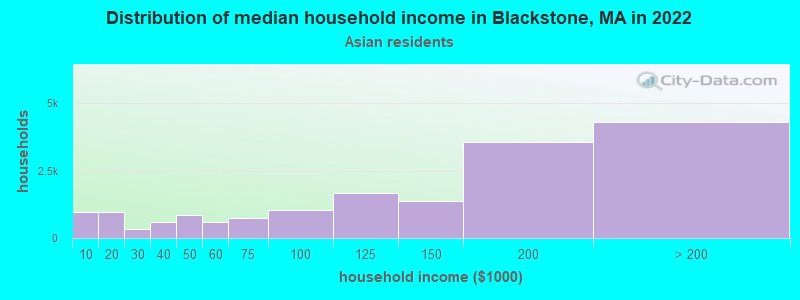
Income statistics for Asian residents
Median household income in Blackstone, MA in 2022:| Blackstone: | $153,568 |
| State: | $117,855 |
Change in median household income between 2000 and 2022:| Blackstone, Massachusetts: | +149.6% |
| State: | +129.9% |
Number of households with income < $10k:| Blackstone: | 5.7% (974) |
| State: | 6.8% (11,982) |
Number of households with income $10k - 20k:| Blackstone: | 5.8% (979) |
| Massachusetts: | 4.8% (8,376) |
Number of households with income $20k - 30k:| Blackstone: | 1.9% (323) |
| State: | 3.7% (6,558) |
Number of households with income $30k - 40k:| Blackstone: | 3.5% (602) |
| State: | 3.3% (5,748) |
Number of households with income $40k - 50k:| Blackstone: | 4.9% (837) |
| State: | 4.1% (7,192) |
Number of households with income $50k - 60k:| Blackstone: | 3.5% (595) |
| State: | 5.0% (8,734) |
Number of households with income $60k - 75k:| Blackstone: | 4.3% (737) |
| Massachusetts: | 5.8% (10,203) |
Number of households with income $75k - 100k:| Blackstone: | 6.1% (1,035) |
| State: | 8.6% (15,154) |
Number of households with income $100k - 125k:| Blackstone: | 9.7% (1,656) |
| Massachusetts: | 10.8% (18,942) |
Number of households with income $125k - 150k:| Blackstone: | 8.1% (1,371) |
| State: | 8.0% (14,037) |
Number of households with income $150k - 200k:| Blackstone: | 21.1% (3,583) |
| Massachusetts: | 12.5% (21,856) |
Number of households with income > $200k:| Blackstone: | 25.4% (4,312) |
| State: | 26.6% (46,694) |
Aggregate household income in Blackstone in 2022: $14,590,134
Median family income in Blackstone in 2022:| Blackstone: | $174,118 |
| State: | $140,113 |
Number of families with income $30k - 40k:| Blackstone: | 15.0% (3) |
| State: | 2.8% (3,234) |
Number of families with income $60k - 75k:| Blackstone: | 67.0% (14) |
| Massachusetts: | 6.1% (7,105) |
Number of families with income $75k - 100k:| Blackstone: | 18.0% (4) |
| State: | 8.5% (10,022) |
Median non-family income in Blackstone in 2022:| Blackstone: | $130,739 |
| State: | $71,440 |
Median per capita income in Blackstone in 2022:| Blackstone: | $43,623 |
| Massachusetts: | $58,900 |
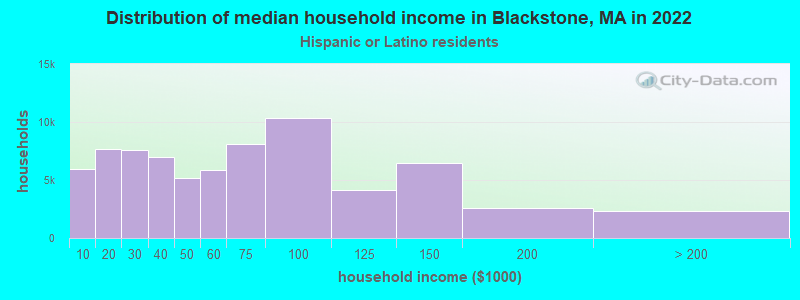
Income statistics for Hispanic or Latino residents
Median household income in Blackstone, MA in 2022:| Blackstone: | $116,417 |
| State: | $61,523 |
Change in median household income between 2000 and 2022:| Blackstone, Massachusetts: | +116.0% |
| Massachusetts: | +125.4% |
Number of households with income < $10k:| Blackstone: | 8.1% (5,958) |
| State: | 8.8% (25,307) |
Number of households with income $10k - 20k:| Blackstone: | 10.5% (7,662) |
| State: | 10.0% (28,653) |
Number of households with income $20k - 30k:| Blackstone: | 10.3% (7,578) |
| State: | 8.8% (25,189) |
Number of households with income $30k - 40k:| Blackstone: | 9.5% (6,971) |
| State: | 7.2% (20,822) |
Number of households with income $40k - 50k:| Blackstone: | 7.1% (5,213) |
| State: | 7.2% (20,817) |
Number of households with income $50k - 60k:| Blackstone: | 8.0% (5,854) |
| State: | 6.5% (18,748) |
Number of households with income $60k - 75k:| Blackstone: | 11.1% (8,113) |
| Massachusetts: | 8.8% (25,390) |
Number of households with income $75k - 100k:| Blackstone: | 14.1% (10,322) |
| Massachusetts: | 12.0% (34,488) |
Number of households with income $100k - 125k:| Blackstone: | 5.7% (4,167) |
| Massachusetts: | 8.6% (24,599) |
Number of households with income $125k - 150k:| Blackstone: | 8.8% (6,472) |
| Massachusetts: | 6.2% (17,743) |
Number of households with income $150k - 200k:| Blackstone: | 3.6% (2,602) |
| Massachusetts: | 7.3% (21,017) |
Number of households with income > $200k:| Blackstone: | 3.2% (2,333) |
| State: | 8.6% (24,606) |
Aggregate household income in Blackstone in 2022: $7,992,264
Median family income in Blackstone in 2022:| Blackstone: | $133,506 |
| State: | $66,072 |
Number of families with income < $10k:| Blackstone: | 4.2% (13) |
| Massachusetts: | 6.2% (12,456) |
Number of families with income $10k - 20k:| Blackstone: | 2.7% (8) |
| State: | 6.0% (12,071) |
Number of families with income $20k - 30k:| Blackstone: | 16.9% (50) |
| State: | 10.1% (20,376) |
Number of families with income $30k - 40k:| Blackstone: | 11.5% (34) |
| Massachusetts: | 8.2% (16,470) |
Number of families with income $40k - 50k:| Blackstone: | 9.7% (29) |
| State: | 7.4% (14,829) |
Number of families with income $50k - 60k:| Blackstone: | 11.7% (35) |
| Massachusetts: | 7.3% (14,643) |
Number of families with income $60k - 75k:| Blackstone: | 14.1% (42) |
| State: | 10.6% (21,252) |
Number of families with income $75k - 100k:| Blackstone: | 14.8% (44) |
| State: | 12.0% (24,088) |
Number of families with income $100k - 125k:| Blackstone: | 6.4% (19) |
| State: | 8.9% (17,954) |
Number of families with income $125k - 150k:| Blackstone: | 5.5% (16) |
| State: | 6.9% (13,837) |
Number of families with income $150k - 200k:| Blackstone: | 1.2% (4) |
| State: | 7.3% (14,683) |
Number of families with income > $200k:| Blackstone: | 1.4% (4) |
| Massachusetts: | 9.3% (18,741) |
Median non-family income in Blackstone in 2022:| Blackstone: | $58,313 |
| State: | $37,563 |
Change in median non-family income between 2000 and 2022:| Blackstone, Massachusetts: | +95.9% |
| State: | +115.0% |
Median per capita income in Blackstone in 2022:| Blackstone: | $42,256 |
| Massachusetts: | $28,993 |
Change in median per capita income between 2000 and 2022:| Blackstone, Massachusetts: | +110.9% |
| Massachusetts: | +142.4% |
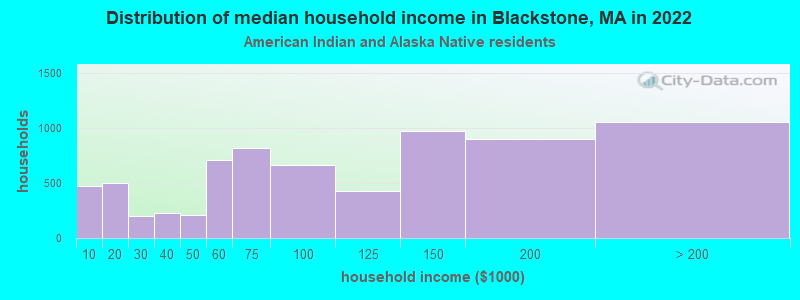
Income statistics for American Indian and Alaska Native residents
Median household income in Blackstone, MA in 2022:| Blackstone: | $126,601 |
| State: | $87,730 |
Number of households with income < $10k:| Blackstone: | 6.6% (475) |
| State: | 6.6% (451) |
Number of households with income $10k - 20k:| Blackstone: | 7.0% (501) |
| State: | 7.0% (476) |
Number of households with income $20k - 30k:| Blackstone: | 2.8% (202) |
| State: | 2.8% (192) |
Number of households with income $30k - 40k:| Blackstone: | 3.2% (229) |
| State: | 3.2% (218) |
Number of households with income $40k - 50k:| Blackstone: | 2.9% (210) |
| State: | 2.9% (199) |
Number of households with income $50k - 60k:| Blackstone: | 9.9% (713) |
| Massachusetts: | 9.9% (677) |
Number of households with income $60k - 75k:| Blackstone: | 11.5% (822) |
| State: | 11.5% (781) |
Number of households with income $75k - 100k:| Blackstone: | 9.2% (662) |
| State: | 9.2% (629) |
Number of households with income $100k - 125k:| Blackstone: | 6.0% (427) |
| State: | 6.0% (406) |
Number of households with income $125k - 150k:| Blackstone: | 13.5% (970) |
| State: | 13.5% (921) |
Number of households with income $150k - 200k:| Blackstone: | 12.6% (904) |
| State: | 12.6% (859) |
Number of households with income > $200k:| Blackstone: | 14.7% (1,056) |
| Massachusetts: | 14.7% (1,003) |
Aggregate household income in Blackstone in 2022: $967,329
Median family income in Blackstone in 2022:| Blackstone: | $117,684 |
| State: | $105,715 |
Median per capita income in Blackstone in 2022:| Blackstone: | $18,357 |
| State: | $39,434 |
Change in median per capita income between 2000 and 2022:| Blackstone, Massachusetts: | +80.0% |
| Massachusetts: | +148.2% |
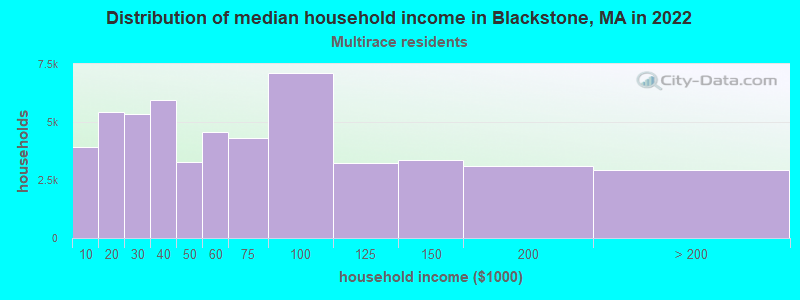
Income statistics for Multirace residents
Median household income in Blackstone, MA in 2022:| Blackstone: | $104,897 |
| State: | $71,552 |
Change in median household income between 2000 and 2022:| Blackstone, Massachusetts: | +84.7% |
| State: | +109.0% |
Number of households with income < $10k:| Blackstone: | 7.4% (3,906) |
| State: | 6.6% (15,127) |
Number of households with income $10k - 20k:| Blackstone: | 10.3% (5,428) |
| Massachusetts: | 9.2% (21,158) |
Number of households with income $20k - 30k:| Blackstone: | 10.2% (5,366) |
| State: | 7.8% (18,016) |
Number of households with income $30k - 40k:| Blackstone: | 11.3% (5,940) |
| Massachusetts: | 7.9% (18,260) |
Number of households with income $40k - 50k:| Blackstone: | 6.2% (3,258) |
| Massachusetts: | 5.6% (13,027) |
Number of households with income $50k - 60k:| Blackstone: | 8.7% (4,588) |
| State: | 5.6% (12,909) |
Number of households with income $60k - 75k:| Blackstone: | 8.2% (4,291) |
| Massachusetts: | 9.0% (20,800) |
Number of households with income $75k - 100k:| Blackstone: | 13.5% (7,092) |
| State: | 12.1% (27,875) |
Number of households with income $100k - 125k:| Blackstone: | 6.2% (3,244) |
| State: | 8.1% (18,754) |
Number of households with income $125k - 150k:| Blackstone: | 6.4% (3,375) |
| State: | 6.8% (15,621) |
Number of households with income $150k - 200k:| Blackstone: | 5.9% (3,115) |
| Massachusetts: | 9.4% (21,618) |
Number of households with income > $200k:| Blackstone: | 5.6% (2,928) |
| Massachusetts: | 12.0% (27,592) |
Aggregate household income in Blackstone in 2022: $31,285,671
Median family income in Blackstone in 2022:| Blackstone: | $97,255 |
| Massachusetts: | $78,380 |
Number of families with income $30k - 40k:| Blackstone: | 7.3% (18) |
| Massachusetts: | 8.2% (12,705) |
Number of families with income $50k - 60k:| Blackstone: | 59.6% (147) |
| State: | 6.7% (10,445) |
Number of families with income $75k - 100k:| Blackstone: | 33.1% (82) |
| State: | 12.1% (18,758) |
Median non-family income in Blackstone in 2022:| Blackstone: | $35,425 |
| State: | $42,253 |
Change in median non-family income between 2000 and 2022:| Blackstone, Massachusetts: | +60.0% |
| State: | +93.7% |
Median per capita income in Blackstone in 2022:| Blackstone: | $38,026 |
| State: | $34,029 |
Change in median per capita income between 2000 and 2022:| Blackstone, Massachusetts: | +104.0% |
| State: | +132.1% |