Bethlehem, New York (NY) income map, earnings map, and wages data
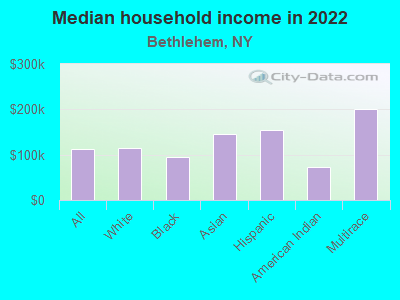
The median household income in Bethlehem, NY in 2022 was $113,359, which was 29.8% greater than the median annual income of $79,557 across the entire state of New York. Compared to the median income of $63,169 in 2000 this represents an increase of 44.3%. The per capita income in 2022 was $60,693, which means an increase of 48.1% compared to 2000 when it was $31,492.
Income statistics for all residents
Median household income in Bethlehem, NY in 2022:| Bethlehem: | $113,360 |
| New York: | $79,557 |
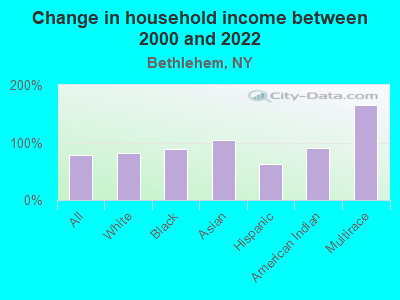
Change in median household income between 2000 and 2022:| Bethlehem, New York: | +79.5% |
| State: | +83.3% |
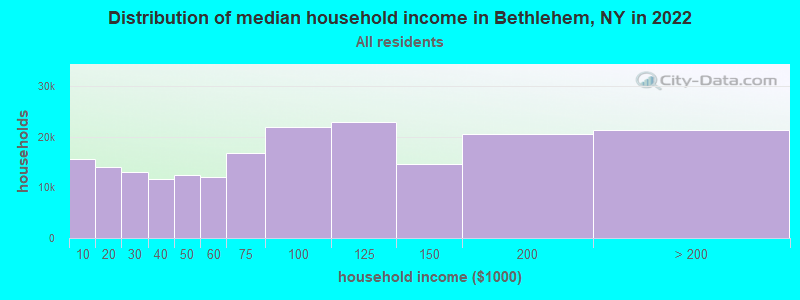
Number of households with income < $10k:| Bethlehem: | 7.9% (15,631) |
| New York: | 6.8% (527,598) |
Number of households with income $10k - 20k:| Bethlehem: | 7.1% (14,067) |
| State: | 7.4% (574,940) |
Number of households with income $20k - 30k:| Bethlehem: | 6.6% (13,080) |
| State: | 6.7% (517,718) |
Number of households with income $30k - 40k:| Bethlehem: | 5.9% (11,673) |
| State: | 6.5% (506,674) |
Number of households with income $40k - 50k:| Bethlehem: | 6.3% (12,465) |
| State: | 6.1% (470,439) |
Number of households with income $50k - 60k:| Bethlehem: | 6.1% (12,084) |
| State: | 5.8% (454,042) |
Number of households with income $60k - 75k:| Bethlehem: | 8.5% (16,745) |
| State: | 8.5% (657,508) |
Number of households with income $75k - 100k:| Bethlehem: | 11.1% (21,941) |
| New York: | 11.6% (899,824) |
Number of households with income $100k - 125k:| Bethlehem: | 11.6% (22,864) |
| State: | 9.3% (723,825) |
Number of households with income $125k - 150k:| Bethlehem: | 7.4% (14,589) |
| State: | 7.1% (552,420) |
Number of households with income $150k - 200k:| Bethlehem: | 10.4% (20,467) |
| State: | 9.4% (727,051) |
Number of households with income > $200k:| Bethlehem: | 10.8% (21,269) |
| State: | 15.0% (1,162,269) |
Aggregate household income in Bethlehem in 2022: $6,380,438,825
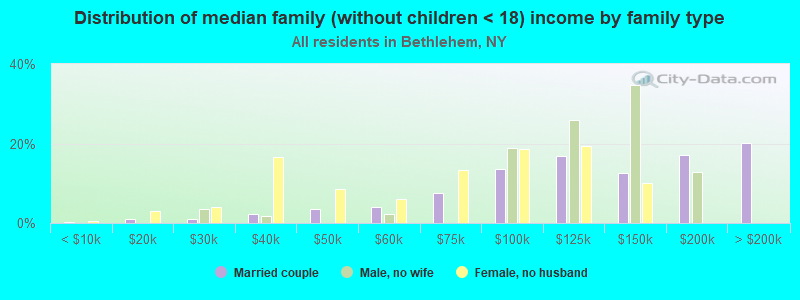
Median family income in Bethlehem in 2022:| Bethlehem: | $153,181 |
| State: | $99,066 |
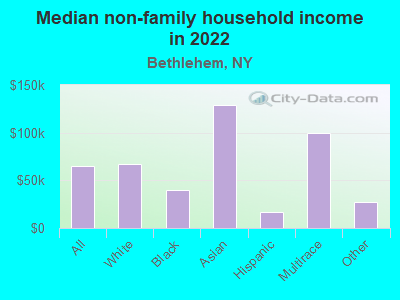
Median non-family income in Bethlehem in 2022:| Bethlehem: | $64,576 |
| State: | $50,181 |
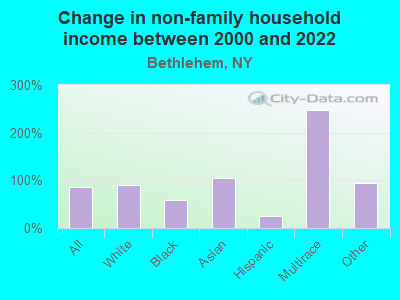
Change in median non-family income between 2000 and 2022:| Bethlehem, New York: | +85.2% |
| New York: | +85.4% |
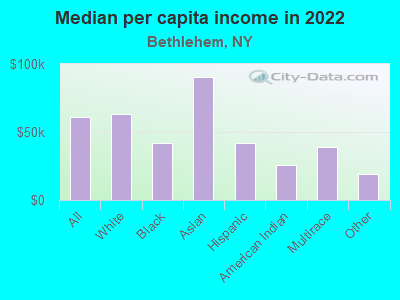
Median per capita income in Bethlehem in 2022:| Bethlehem: | $60,693 |
| New York: | $47,421 |
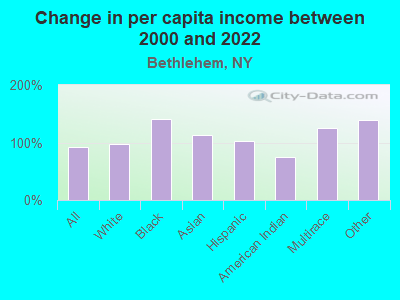
Change in median per capita income between 2000 and 2022:| Bethlehem, New York: | +92.7% |
| State: | +102.7% |
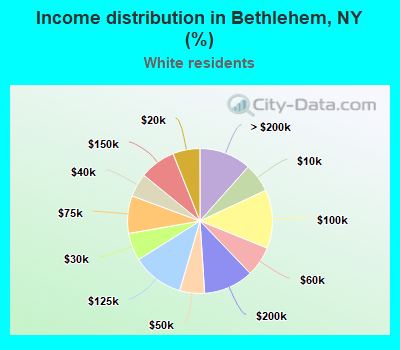
Income statistics for White residents
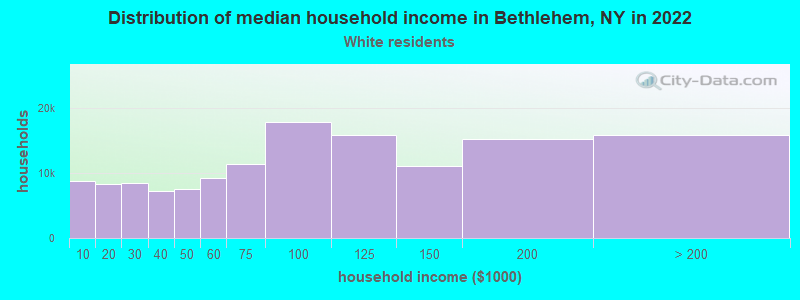
Median household income in Bethlehem, NY in 2022:| Bethlehem: | $114,768 |
| New York: | $89,408 |
Change in median household income between 2000 and 2022:| Bethlehem, New York: | +81.6% |
| State: | +85.5% |
Number of households with income < $10k:| Bethlehem: | 6.5% (8,838) |
| State: | 4.8% (225,550) |
Number of households with income $10k - 20k:| Bethlehem: | 6.1% (8,273) |
| State: | 6.1% (289,425) |
Number of households with income $20k - 30k:| Bethlehem: | 6.2% (8,427) |
| State: | 5.9% (280,254) |
Number of households with income $30k - 40k:| Bethlehem: | 5.3% (7,174) |
| State: | 6.1% (288,263) |
Number of households with income $40k - 50k:| Bethlehem: | 5.5% (7,550) |
| New York: | 5.9% (278,079) |
Number of households with income $50k - 60k:| Bethlehem: | 6.7% (9,193) |
| State: | 5.7% (267,554) |
Number of households with income $60k - 75k:| Bethlehem: | 8.4% (11,449) |
| State: | 8.4% (398,344) |
Number of households with income $75k - 100k:| Bethlehem: | 13.1% (17,841) |
| State: | 11.8% (554,841) |
Number of households with income $100k - 125k:| Bethlehem: | 11.6% (15,796) |
| State: | 10.0% (469,794) |
Number of households with income $125k - 150k:| Bethlehem: | 8.1% (11,003) |
| State: | 7.6% (360,467) |
Number of households with income $150k - 200k:| Bethlehem: | 11.1% (15,211) |
| State: | 10.1% (477,078) |
Number of households with income > $200k:| Bethlehem: | 11.6% (15,826) |
| State: | 17.6% (829,233) |
Aggregate household income in Bethlehem in 2022: $4,721,515,921
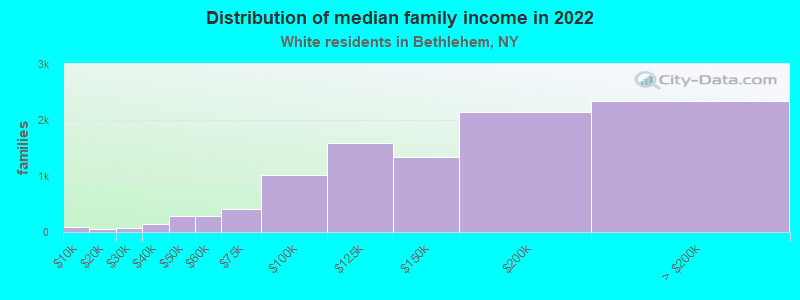
Median family income in Bethlehem in 2022:| Bethlehem: | $153,026 |
| New York: | $115,170 |
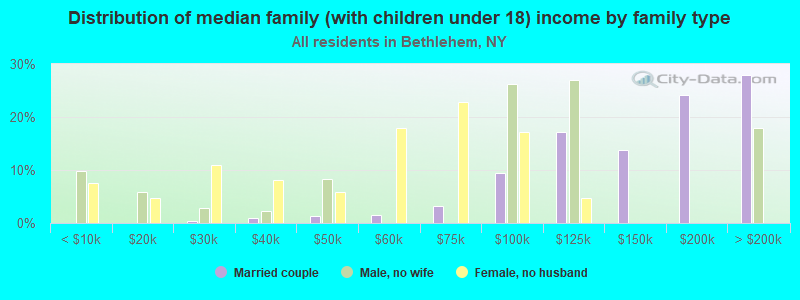
Number of families with income < $10k:| Bethlehem: | 0.9% (91) |
| State: | 2.5% (68,851) |
Number of families with income $10k - 20k:| Bethlehem: | 0.6% (56) |
| State: | 3.0% (83,127) |
Number of families with income $20k - 30k:| Bethlehem: | 0.8% (80) |
| State: | 3.5% (97,578) |
Number of families with income $30k - 40k:| Bethlehem: | 1.4% (139) |
| State: | 4.1% (114,108) |
Number of families with income $40k - 50k:| Bethlehem: | 3.0% (293) |
| State: | 4.7% (130,902) |
Number of families with income $50k - 60k:| Bethlehem: | 3.0% (291) |
| State: | 4.9% (135,118) |
Number of families with income $60k - 75k:| Bethlehem: | 4.1% (404) |
| New York: | 7.8% (216,254) |
Number of families with income $75k - 100k:| Bethlehem: | 10.4% (1,015) |
| State: | 12.4% (342,382) |
Number of families with income $100k - 125k:| Bethlehem: | 16.3% (1,594) |
| State: | 11.4% (314,917) |
Number of families with income $125k - 150k:| Bethlehem: | 13.7% (1,340) |
| State: | 9.4% (260,489) |
Number of families with income $150k - 200k:| Bethlehem: | 21.8% (2,134) |
| State: | 13.2% (365,586) |
Number of families with income > $200k:| Bethlehem: | 23.9% (2,342) |
| State: | 23.2% (642,319) |
Median non-family income in Bethlehem in 2022:| Bethlehem: | $67,144 |
| New York: | $54,783 |
Change in median non-family income between 2000 and 2022:| Bethlehem, New York: | +89.8% |
| State: | +87.9% |
Median per capita income in Bethlehem in 2022:| Bethlehem: | $62,927 |
| New York: | $57,640 |
Change in median per capita income between 2000 and 2022:| Bethlehem, New York: | +97.2% |
| New York: | +111.6% |
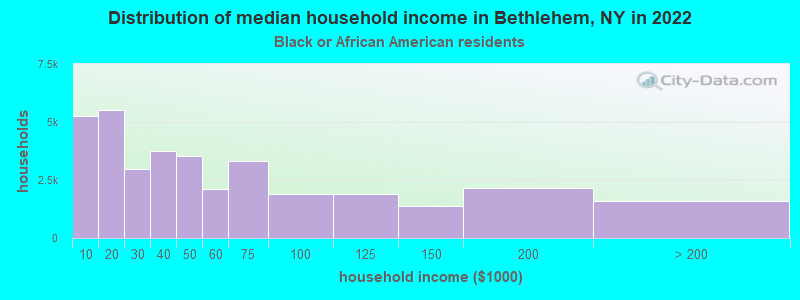
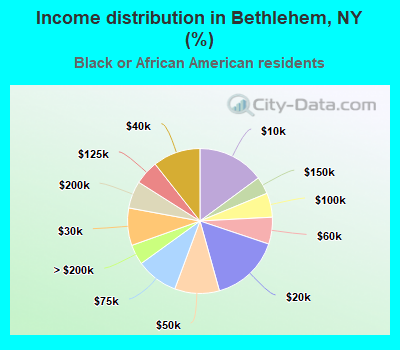
Income statistics for Black or African American residents
Median household income in Bethlehem, NY in 2022:| Bethlehem: | $95,616 |
| State: | $57,898 |
Change in median household income between 2000 and 2022:| Bethlehem, New York: | +87.9% |
| New York: | +84.6% |
Number of households with income < $10k:| Bethlehem: | 14.9% (5,279) |
| State: | 12.0% (128,500) |
Number of households with income $10k - 20k:| Bethlehem: | 15.5% (5,510) |
| State: | 10.0% (107,541) |
Number of households with income $20k - 30k:| Bethlehem: | 8.3% (2,959) |
| State: | 8.4% (90,192) |
Number of households with income $30k - 40k:| Bethlehem: | 10.6% (3,766) |
| State: | 7.4% (79,579) |
Number of households with income $40k - 50k:| Bethlehem: | 10.0% (3,538) |
| State: | 6.8% (72,491) |
Number of households with income $50k - 60k:| Bethlehem: | 6.0% (2,118) |
| State: | 6.7% (71,309) |
Number of households with income $60k - 75k:| Bethlehem: | 9.4% (3,323) |
| State: | 8.9% (95,050) |
Number of households with income $75k - 100k:| Bethlehem: | 5.4% (1,918) |
| State: | 11.5% (123,569) |
Number of households with income $100k - 125k:| Bethlehem: | 5.4% (1,914) |
| State: | 8.1% (86,632) |
Number of households with income $125k - 150k:| Bethlehem: | 3.9% (1,376) |
| New York: | 6.0% (64,788) |
Number of households with income $150k - 200k:| Bethlehem: | 6.1% (2,156) |
| State: | 7.2% (76,644) |
Number of households with income > $200k:| Bethlehem: | 4.5% (1,599) |
| State: | 7.0% (75,062) |
Aggregate household income in Bethlehem in 2022: $39,396,209
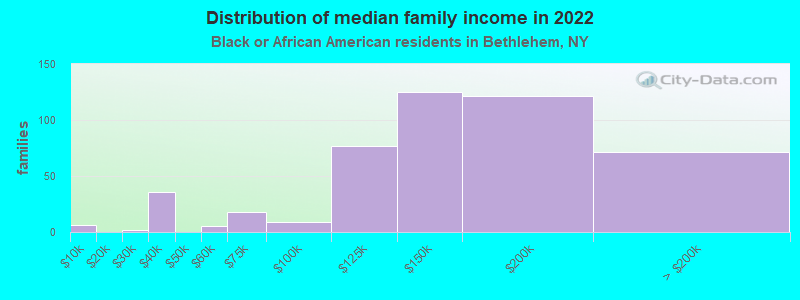
Median family income in Bethlehem in 2022:| Bethlehem: | $183,520 |
| State: | $72,528 |
Number of families with income < $10k:| Bethlehem: | 1.3% (6) |
| State: | 8.6% (54,100) |
Number of families with income $20k - 30k:| Bethlehem: | 0.5% (2) |
| State: | 7.0% (44,139) |
Number of families with income $30k - 40k:| Bethlehem: | 7.7% (36) |
| State: | 6.9% (43,353) |
Number of families with income $50k - 60k:| Bethlehem: | 1.1% (5) |
| State: | 6.3% (39,748) |
Number of families with income $60k - 75k:| Bethlehem: | 3.9% (18) |
| State: | 9.2% (57,626) |
Number of families with income $75k - 100k:| Bethlehem: | 1.9% (9) |
| State: | 12.6% (78,986) |
Number of families with income $100k - 125k:| Bethlehem: | 16.5% (77) |
| State: | 9.8% (61,670) |
Number of families with income $125k - 150k:| Bethlehem: | 26.5% (125) |
| State: | 7.5% (47,050) |
Number of families with income $150k - 200k:| Bethlehem: | 25.7% (121) |
| State: | 9.4% (59,260) |
Number of families with income > $200k:| Bethlehem: | 15.0% (71) |
| State: | 9.3% (58,575) |
Median non-family income in Bethlehem in 2022:| Bethlehem: | $39,935 |
| State: | $37,265 |
Change in median non-family income between 2000 and 2022:| Bethlehem, New York: | +58.7% |
| New York: | +81.7% |
Median per capita income in Bethlehem in 2022:| Bethlehem: | $41,627 |
| State: | $31,947 |
Change in median per capita income between 2000 and 2022:| Bethlehem, New York: | +141.3% |
| State: | +106.1% |
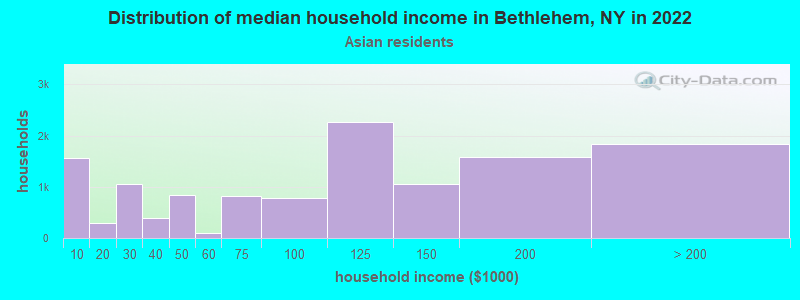
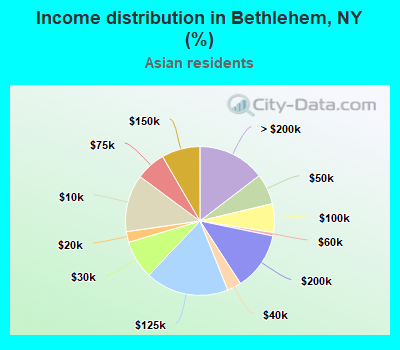
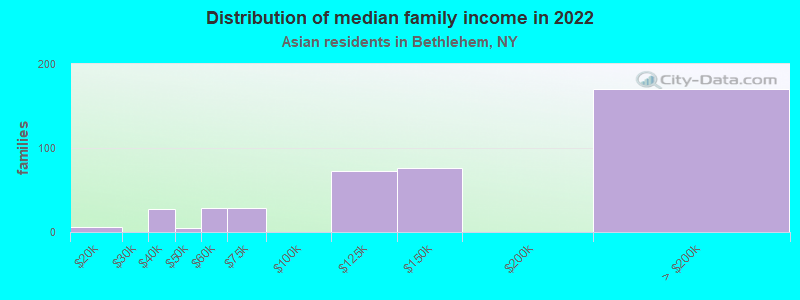
Income statistics for Asian residents
Median household income in Bethlehem, NY in 2022:| Bethlehem: | $146,267 |
| State: | $89,947 |
Change in median household income between 2000 and 2022:| Bethlehem, New York: | +104.0% |
| State: | +98.1% |
Number of households with income < $10k:| Bethlehem: | 12.4% (1,559) |
| State: | 6.9% (42,537) |
Number of households with income $10k - 20k:| Bethlehem: | 2.3% (293) |
| State: | 7.3% (44,745) |
Number of households with income $20k - 30k:| Bethlehem: | 8.4% (1,049) |
| State: | 6.2% (38,249) |
Number of households with income $30k - 40k:| Bethlehem: | 3.1% (388) |
| State: | 5.5% (33,993) |
Number of households with income $40k - 50k:| Bethlehem: | 6.7% (834) |
| State: | 4.8% (29,795) |
Number of households with income $50k - 60k:| Bethlehem: | 0.7% (89) |
| New York: | 5.2% (32,100) |
Number of households with income $60k - 75k:| Bethlehem: | 6.5% (813) |
| State: | 7.3% (44,615) |
Number of households with income $75k - 100k:| Bethlehem: | 6.3% (785) |
| State: | 10.8% (66,687) |
Number of households with income $100k - 125k:| Bethlehem: | 18.1% (2,266) |
| State: | 8.2% (50,233) |
Number of households with income $125k - 150k:| Bethlehem: | 8.4% (1,048) |
| New York: | 7.2% (44,299) |
Number of households with income $150k - 200k:| Bethlehem: | 12.6% (1,582) |
| State: | 10.4% (63,837) |
Number of households with income > $200k:| Bethlehem: | 14.6% (1,831) |
| State: | 20.1% (123,891) |
Aggregate household income in Bethlehem in 2022: $135,916,386
Median family income in Bethlehem in 2022:| Bethlehem: | $207,308 |
| State: | $98,136 |
Number of families with income $10k - 20k:| Bethlehem: | 1.3% (6) |
| New York: | 5.2% (22,725) |
Number of families with income $30k - 40k:| Bethlehem: | 6.6% (27) |
| State: | 6.2% (26,994) |
Number of families with income $40k - 50k:| Bethlehem: | 1.2% (5) |
| New York: | 5.2% (22,750) |
Number of families with income $50k - 60k:| Bethlehem: | 7.1% (29) |
| State: | 5.5% (24,015) |
Number of families with income $60k - 75k:| Bethlehem: | 6.8% (28) |
| State: | 7.6% (33,120) |
Number of families with income $100k - 125k:| Bethlehem: | 17.5% (73) |
| State: | 8.6% (37,796) |
Number of families with income $125k - 150k:| Bethlehem: | 18.4% (76) |
| State: | 7.3% (31,893) |
Number of families with income > $200k:| Bethlehem: | 41.0% (170) |
| New York: | 22.2% (97,322) |
Median non-family income in Bethlehem in 2022:| Bethlehem: | $129,471 |
| State: | $63,573 |
Change in median non-family income between 2000 and 2022:| Bethlehem, New York: | +104.3% |
| State: | +101.1% |
Median per capita income in Bethlehem in 2022:| Bethlehem: | $90,422 |
| New York: | $46,726 |
Change in median per capita income between 2000 and 2022:| Bethlehem, New York: | +113.0% |
| New York: | +126.6% |
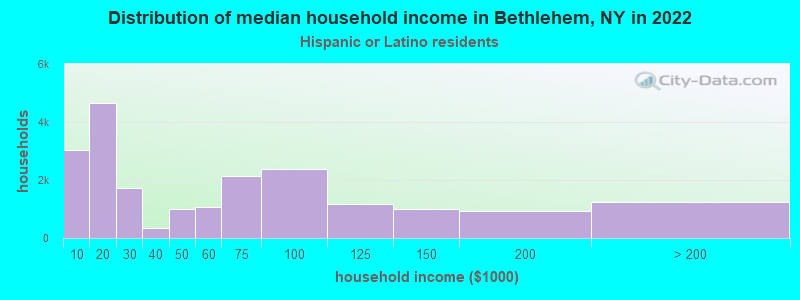
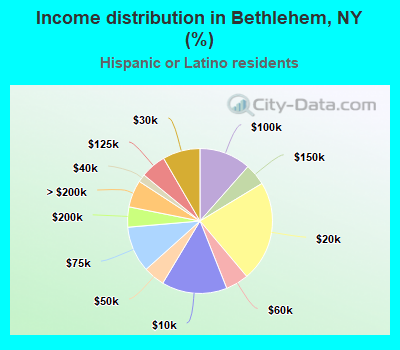
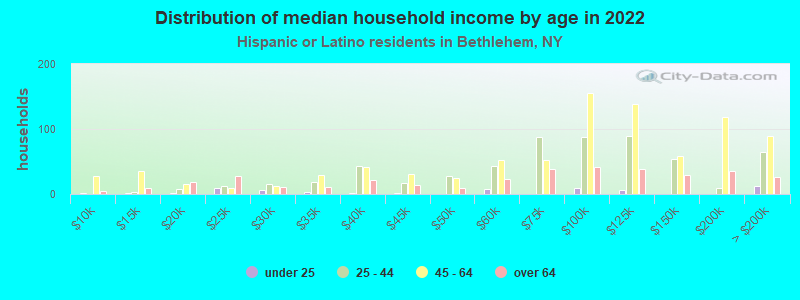
Income statistics for Hispanic or Latino residents
Median household income in Bethlehem, NY in 2022:| Bethlehem: | $154,853 |
| New York: | $60,468 |
Change in median household income between 2000 and 2022:| Bethlehem, New York: | +61.6% |
| State: | +98.3% |
Number of households with income < $10k:| Bethlehem: | 14.6% (3,027) |
| State: | 9.9% (127,185) |
Number of households with income $10k - 20k:| Bethlehem: | 22.5% (4,664) |
| New York: | 10.7% (136,699) |
Number of households with income $20k - 30k:| Bethlehem: | 8.4% (1,732) |
| State: | 8.1% (102,991) |
Number of households with income $30k - 40k:| Bethlehem: | 1.7% (362) |
| New York: | 7.8% (100,149) |
Number of households with income $40k - 50k:| Bethlehem: | 4.8% (989) |
| State: | 6.9% (87,760) |
Number of households with income $50k - 60k:| Bethlehem: | 5.1% (1,063) |
| New York: | 6.3% (80,968) |
Number of households with income $60k - 75k:| Bethlehem: | 10.3% (2,126) |
| State: | 8.7% (110,631) |
Number of households with income $75k - 100k:| Bethlehem: | 11.5% (2,383) |
| State: | 11.2% (142,787) |
Number of households with income $100k - 125k:| Bethlehem: | 5.7% (1,179) |
| State: | 8.2% (104,850) |
Number of households with income $125k - 150k:| Bethlehem: | 4.8% (1,003) |
| State: | 6.3% (80,274) |
Number of households with income $150k - 200k:| Bethlehem: | 4.5% (933) |
| State: | 7.4% (95,117) |
Number of households with income > $200k:| Bethlehem: | 6.1% (1,257) |
| State: | 8.6% (109,514) |
Aggregate household income in Bethlehem in 2022: $37,266,796
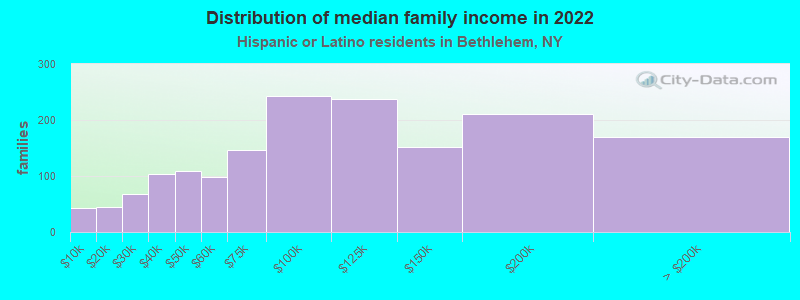
Median family income in Bethlehem in 2022:| Bethlehem: | $221,319 |
| State: | $68,770 |
Number of families with income < $10k:| Bethlehem: | 2.6% (42) |
| New York: | 6.9% (58,565) |
Number of families with income $10k - 20k:| Bethlehem: | 2.7% (44) |
| State: | 7.0% (59,058) |
Number of families with income $20k - 30k:| Bethlehem: | 4.1% (67) |
| State: | 8.0% (68,048) |
Number of families with income $30k - 40k:| Bethlehem: | 6.4% (104) |
| State: | 8.4% (70,668) |
Number of families with income $40k - 50k:| Bethlehem: | 6.7% (109) |
| State: | 7.4% (62,941) |
Number of families with income $50k - 60k:| Bethlehem: | 6.0% (98) |
| State: | 6.6% (55,592) |
Number of families with income $60k - 75k:| Bethlehem: | 9.1% (147) |
| State: | 9.3% (78,564) |
Number of families with income $75k - 100k:| Bethlehem: | 14.9% (242) |
| State: | 12.6% (106,685) |
Number of families with income $100k - 125k:| Bethlehem: | 14.6% (237) |
| State: | 9.4% (79,139) |
Number of families with income $125k - 150k:| Bethlehem: | 9.3% (151) |
| State: | 6.9% (58,255) |
Number of families with income $150k - 200k:| Bethlehem: | 12.9% (210) |
| State: | 8.3% (69,877) |
Number of families with income > $200k:| Bethlehem: | 10.5% (170) |
| State: | 9.3% (78,555) |
Median non-family income in Bethlehem in 2022:| Bethlehem: | $17,238 |
| State: | $34,000 |
Change in median non-family income between 2000 and 2022:| Bethlehem, New York: | +25.4% |
| New York: | +93.9% |
Median per capita income in Bethlehem in 2022:| Bethlehem: | $42,229 |
| New York: | $29,761 |
Change in median per capita income between 2000 and 2022:| Bethlehem, New York: | +102.5% |
| State: | +132.7% |
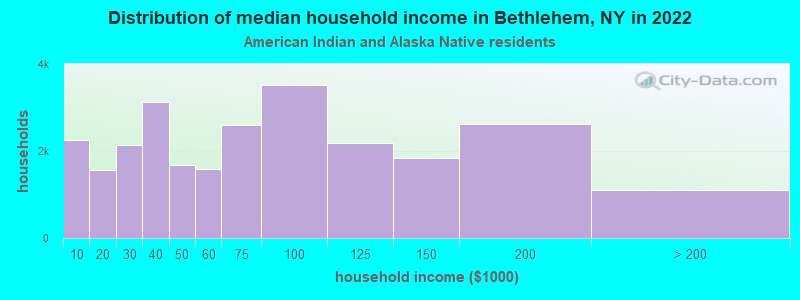
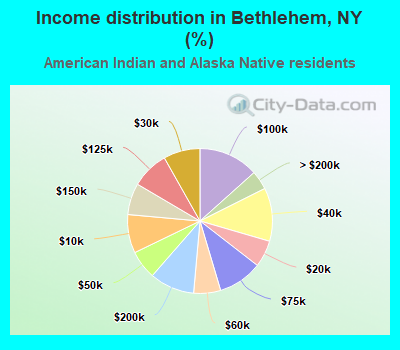
Income statistics for American Indian and Alaska Native residents
Median household income in Bethlehem, NY in 2022:| Bethlehem: | $72,225 |
| New York: | $63,208 |
Change in median household income between 2000 and 2022:| Bethlehem, New York: | +90.5% |
| State: | +110.1% |
Number of households with income < $10k:| Bethlehem: | 8.6% (2,264) |
| New York: | 8.6% (3,559) |
Number of households with income $10k - 20k:| Bethlehem: | 6.0% (1,572) |
| State: | 5.9% (2,455) |
Number of households with income $20k - 30k:| Bethlehem: | 8.2% (2,149) |
| State: | 8.2% (3,393) |
Number of households with income $30k - 40k:| Bethlehem: | 11.9% (3,129) |
| State: | 11.9% (4,918) |
Number of households with income $40k - 50k:| Bethlehem: | 6.4% (1,681) |
| State: | 6.5% (2,682) |
Number of households with income $50k - 60k:| Bethlehem: | 6.0% (1,582) |
| State: | 6.1% (2,516) |
Number of households with income $60k - 75k:| Bethlehem: | 9.9% (2,601) |
| State: | 10.0% (4,125) |
Number of households with income $75k - 100k:| Bethlehem: | 13.4% (3,517) |
| State: | 13.3% (5,517) |
Number of households with income $100k - 125k:| Bethlehem: | 8.4% (2,195) |
| New York: | 8.4% (3,463) |
Number of households with income $125k - 150k:| Bethlehem: | 7.0% (1,846) |
| State: | 7.0% (2,887) |
Number of households with income $150k - 200k:| Bethlehem: | 10.0% (2,631) |
| State: | 9.9% (4,106) |
Number of households with income > $200k:| Bethlehem: | 4.2% (1,111) |
| State: | 4.2% (1,744) |
Aggregate household income in Bethlehem in 2022: $3,489,368
Median per capita income in Bethlehem in 2022:| Bethlehem: | $26,100 |
| State: | $25,837 |
Change in median per capita income between 2000 and 2022:| Bethlehem, New York: | +75.0% |
| State: | +99.6% |
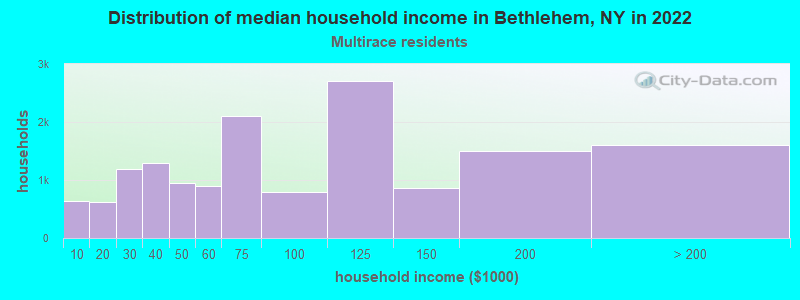
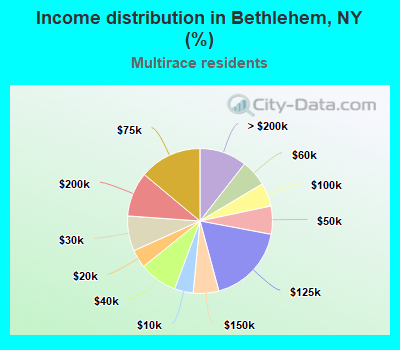
Income statistics for Multirace residents
Median household income in Bethlehem, NY in 2022:| Bethlehem: | $201,772 |
| State: | $73,557 |
Number of households with income < $10k:| Bethlehem: | 4.2% (637) |
| New York: | 8.9% (57,924) |
Number of households with income $10k - 20k:| Bethlehem: | 4.1% (618) |
| New York: | 8.7% (56,590) |
Number of households with income $20k - 30k:| Bethlehem: | 7.8% (1,186) |
| State: | 7.1% (46,287) |
Number of households with income $30k - 40k:| Bethlehem: | 8.5% (1,285) |
| State: | 6.9% (45,132) |
Number of households with income $40k - 50k:| Bethlehem: | 6.3% (948) |
| State: | 5.8% (37,946) |
Number of households with income $50k - 60k:| Bethlehem: | 5.9% (894) |
| State: | 5.6% (36,410) |
Number of households with income $60k - 75k:| Bethlehem: | 13.9% (2,109) |
| State: | 7.8% (50,819) |
Number of households with income $75k - 100k:| Bethlehem: | 5.2% (791) |
| New York: | 11.7% (76,024) |
Number of households with income $100k - 125k:| Bethlehem: | 17.8% (2,703) |
| State: | 9.3% (60,635) |
Number of households with income $125k - 150k:| Bethlehem: | 5.7% (864) |
| State: | 6.2% (40,533) |
Number of households with income $150k - 200k:| Bethlehem: | 10.0% (1,507) |
| State: | 8.6% (56,409) |
Number of households with income > $200k:| Bethlehem: | 10.6% (1,601) |
| State: | 13.4% (87,442) |
Aggregate household income in Bethlehem in 2022: $37,222,379
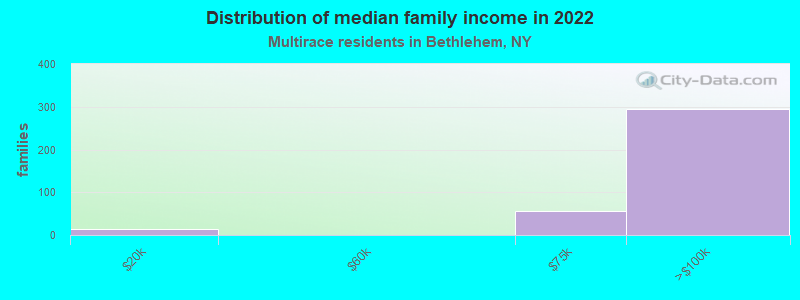
Median family income in Bethlehem in 2022:| Bethlehem: | $236,542 |
| State: | $85,788 |
Number of families with income $10k - 20k:| Bethlehem: | 3.5% (13) |
| New York: | 5.6% (22,512) |
Number of families with income $60k - 75k:| Bethlehem: | 15.4% (56) |
| New York: | 7.6% (30,653) |
Number of families with income $75k - 100k:| Bethlehem: | 81.1% (295) |
| New York: | 12.9% (51,995) |
Median non-family income in Bethlehem in 2022:| Bethlehem: | $100,033 |
| New York: | $46,403 |
Median per capita income in Bethlehem in 2022:| Bethlehem: | $39,009 |
| State: | $36,931 |
Change in median per capita income between 2000 and 2022:| Bethlehem, New York: | +125.9% |
| New York: | +158.8% |
Income statistics for other residents
Number of households with income < $10k:| Bethlehem: | 10.4% (8) |
| State: | 10.3% (69,252) |
Number of households with income $10k - 20k:| Bethlehem: | 10.4% (8) |
| New York: | 11.0% (73,890) |
Number of households with income $20k - 30k:| Bethlehem: | 7.8% (6) |
| State: | 8.8% (59,096) |
Number of households with income $30k - 40k:| Bethlehem: | 7.8% (6) |
| State: | 8.1% (54,418) |
Number of households with income $40k - 50k:| Bethlehem: | 6.5% (5) |
| New York: | 7.3% (49,042) |
Number of households with income $50k - 60k:| Bethlehem: | 5.2% (4) |
| State: | 6.5% (43,945) |
Number of households with income $60k - 75k:| Bethlehem: | 9.1% (7) |
| State: | 9.5% (64,087) |
Number of households with income $75k - 100k:| Bethlehem: | 11.7% (9) |
| State: | 10.9% (73,094) |
Number of households with income $100k - 125k:| Bethlehem: | 9.1% (7) |
| New York: | 7.9% (53,055) |
Number of households with income $125k - 150k:| Bethlehem: | 5.2% (4) |
| State: | 5.9% (39,446) |
Number of households with income $150k - 200k:| Bethlehem: | 9.1% (7) |
| New York: | 7.2% (48,653) |
Number of households with income > $200k:| Bethlehem: | 7.8% (6) |
| New York: | 6.6% (44,703) |
Aggregate household income in Bethlehem in 2022: $2,680,720
Median family income in Bethlehem in 2022:| Bethlehem: | $85,568 |
| New York: | $63,465 |
Median non-family income in Bethlehem in 2022:| Bethlehem: | $26,841 |
| State: | $26,983 |
Change in median non-family income between 2000 and 2022:| Bethlehem, New York: | +95.2% |
| New York: | +66.4% |
Median per capita income in Bethlehem in 2022:| Bethlehem: | $19,336 |
| New York: | $26,975 |
Change in median per capita income between 2000 and 2022:| Bethlehem, New York: | +140.4% |
| State: | +144.6% |