Auburn, Massachusetts (MA) income map, earnings map, and wages data
The median household income in Auburn, MA in 2022 was $93,247, which was about the same as the median annual income of $94,488 across the entire state of Massachusetts. Compared to the median income of $51,753 in 2000 this represents an increase of 44.5%. The per capita income in 2022 was $46,408, which means an increase of 48.7% compared to 2000 when it was $23,802.
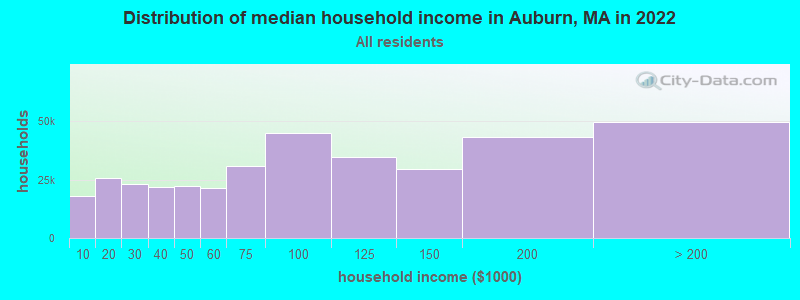
Income statistics for all residents
Median household income in Auburn, MA in 2022:| Auburn: | $93,247 |
| State: | $94,488 |
Change in median household income between 2000 and 2022:| Auburn, Massachusetts: | +80.2% |
| State: | +87.1% |
Number of households with income < $10k:| Auburn: | 4.9% (17,937) |
| State: | 5.2% (146,170) |
Number of households with income $10k - 20k:| Auburn: | 7.0% (25,592) |
| State: | 6.4% (180,001) |
Number of households with income $20k - 30k:| Auburn: | 6.4% (23,307) |
| State: | 5.6% (156,667) |
Number of households with income $30k - 40k:| Auburn: | 5.9% (21,694) |
| State: | 5.6% (157,168) |
Number of households with income $40k - 50k:| Auburn: | 6.1% (22,215) |
| Massachusetts: | 5.4% (151,455) |
Number of households with income $50k - 60k:| Auburn: | 5.8% (21,270) |
| Massachusetts: | 5.1% (142,726) |
Number of households with income $60k - 75k:| Auburn: | 8.4% (30,867) |
| State: | 7.6% (212,203) |
Number of households with income $75k - 100k:| Auburn: | 12.3% (44,894) |
| State: | 11.3% (317,064) |
Number of households with income $100k - 125k:| Auburn: | 9.5% (34,847) |
| State: | 9.7% (270,603) |
Number of households with income $125k - 150k:| Auburn: | 8.1% (29,777) |
| State: | 8.0% (223,140) |
Number of households with income $150k - 200k:| Auburn: | 11.9% (43,369) |
| State: | 11.0% (308,695) |
Number of households with income > $200k:| Auburn: | 13.6% (49,711) |
| Massachusetts: | 19.0% (531,884) |
Aggregate household income in Auburn in 2022: $6,727,871,491
Median family income in Auburn in 2022:| Auburn: | $111,882 |
| State: | $120,263 |
Median non-family income in Auburn in 2022:| Auburn: | $44,915 |
| State: | $55,979 |
Change in median non-family income between 2000 and 2022:| Auburn, Massachusetts: | +85.7% |
| State: | +88.0% |
Median per capita income in Auburn in 2022:| Auburn: | $46,409 |
| State: | $54,025 |
Change in median per capita income between 2000 and 2022:| Auburn, Massachusetts: | +95.0% |
| Massachusetts: | +108.2% |
Income statistics for White residents
Median household income in Auburn, MA in 2022:| Auburn: | $95,852 |
| Massachusetts: | $101,391 |
Change in median household income between 2000 and 2022:| Auburn, Massachusetts: | +85.1% |
| Massachusetts: | +93.3% |
Number of households with income < $10k:| Auburn: | 4.6% (12,803) |
| Massachusetts: | 4.4% (91,120) |
Number of households with income $10k - 20k:| Auburn: | 6.5% (18,307) |
| State: | 5.9% (122,055) |
Number of households with income $20k - 30k:| Auburn: | 6.1% (16,976) |
| Massachusetts: | 5.1% (105,311) |
Number of households with income $30k - 40k:| Auburn: | 5.5% (15,317) |
| State: | 5.3% (110,239) |
Number of households with income $40k - 50k:| Auburn: | 5.6% (15,683) |
| State: | 5.0% (104,636) |
Number of households with income $50k - 60k:| Auburn: | 5.4% (15,208) |
| Massachusetts: | 4.8% (99,486) |
Number of households with income $60k - 75k:| Auburn: | 8.4% (23,551) |
| State: | 7.5% (155,124) |
Number of households with income $75k - 100k:| Auburn: | 12.2% (34,226) |
| State: | 11.4% (236,252) |
Number of households with income $100k - 125k:| Auburn: | 10.1% (28,442) |
| State: | 9.9% (204,731) |
Number of households with income $125k - 150k:| Auburn: | 8.4% (23,456) |
| State: | 8.5% (175,324) |
Number of households with income $150k - 200k:| Auburn: | 12.5% (34,944) |
| Massachusetts: | 11.7% (242,980) |
Number of households with income > $200k:| Auburn: | 14.7% (41,331) |
| State: | 20.5% (425,966) |
Aggregate household income in Auburn in 2022: $5,462,431,887
Median family income in Auburn in 2022:| Auburn: | $117,462 |
| Massachusetts: | $133,153 |
Number of families with income < $10k:| Auburn: | 1.0% (34) |
| Massachusetts: | 2.0% (25,038) |
Number of families with income $10k - 20k:| Auburn: | 2.6% (93) |
| State: | 2.1% (26,403) |
Number of families with income $20k - 30k:| Auburn: | 3.2% (113) |
| State: | 2.6% (32,525) |
Number of families with income $30k - 40k:| Auburn: | 5.6% (201) |
| State: | 3.9% (48,079) |
Number of families with income $40k - 50k:| Auburn: | 4.9% (175) |
| State: | 3.8% (46,908) |
Number of families with income $50k - 60k:| Auburn: | 6.9% (247) |
| Massachusetts: | 3.8% (46,476) |
Number of families with income $60k - 75k:| Auburn: | 10.4% (375) |
| State: | 6.4% (79,040) |
Number of families with income $75k - 100k:| Auburn: | 13.4% (482) |
| Massachusetts: | 11.1% (137,395) |
Number of families with income $100k - 125k:| Auburn: | 15.5% (555) |
| State: | 11.1% (136,771) |
Number of families with income $125k - 150k:| Auburn: | 11.4% (411) |
| Massachusetts: | 10.0% (123,709) |
Number of families with income $150k - 200k:| Auburn: | 17.5% (627) |
| Massachusetts: | 14.7% (181,602) |
Number of families with income > $200k:| Auburn: | 7.7% (277) |
| State: | 28.5% (351,887) |
Median non-family income in Auburn in 2022:| Auburn: | $46,286 |
| Massachusetts: | $59,323 |
Change in median non-family income between 2000 and 2022:| Auburn, Massachusetts: | +92.0% |
| State: | +94.3% |
Median per capita income in Auburn in 2022:| Auburn: | $49,128 |
| State: | $60,804 |
Change in median per capita income between 2000 and 2022:| Auburn, Massachusetts: | +105.3% |
| State: | +118.7% |
Income statistics for Black or African American residents
Median household income in Auburn, MA in 2022:| Auburn: | $153,757 |
| State: | $63,189 |
Change in median household income between 2000 and 2022:| Auburn, Massachusetts: | +69.8% |
| State: | +87.4% |
Number of households with income < $10k:| Auburn: | 7.3% (2,917) |
| State: | 9.1% (15,797) |
Number of households with income $10k - 20k:| Auburn: | 11.9% (4,765) |
| Massachusetts: | 9.4% (16,267) |
Number of households with income $20k - 30k:| Auburn: | 9.8% (3,925) |
| Massachusetts: | 7.8% (13,520) |
Number of households with income $30k - 40k:| Auburn: | 3.3% (1,302) |
| State: | 8.3% (14,412) |
Number of households with income $40k - 50k:| Auburn: | 13.5% (5,400) |
| State: | 7.9% (13,790) |
Number of households with income $50k - 60k:| Auburn: | 5.8% (2,309) |
| Massachusetts: | 5.8% (10,041) |
Number of households with income $60k - 75k:| Auburn: | 10.7% (4,295) |
| State: | 8.5% (14,822) |
Number of households with income $75k - 100k:| Auburn: | 13.0% (5,215) |
| State: | 11.0% (19,122) |
Number of households with income $100k - 125k:| Auburn: | 7.5% (3,011) |
| State: | 8.4% (14,575) |
Number of households with income $125k - 150k:| Auburn: | 5.0% (1,989) |
| State: | 6.0% (10,429) |
Number of households with income $150k - 200k:| Auburn: | 7.3% (2,901) |
| State: | 7.2% (12,539) |
Number of households with income > $200k:| Auburn: | 4.9% (1,976) |
| Massachusetts: | 10.5% (18,185) |
Aggregate household income in Auburn in 2022: $12,093,309
Median family income in Auburn in 2022:| Auburn: | $148,572 |
| Massachusetts: | $79,815 |
Number of families with income $40k - 50k:| Auburn: | 19.8% (34) |
| State: | 7.9% (8,656) |
Number of families with income $50k - 60k:| Auburn: | 3.9% (7) |
| State: | 6.4% (6,986) |
Number of families with income $75k - 100k:| Auburn: | 14.2% (25) |
| State: | 11.5% (12,654) |
Number of families with income $100k - 125k:| Auburn: | 25.1% (43) |
| State: | 10.4% (11,452) |
Number of families with income $125k - 150k:| Auburn: | 37.1% (64) |
| State: | 7.5% (8,277) |
Median per capita income in Auburn in 2022:| Auburn: | $43,912 |
| State: | $33,524 |
Change in median per capita income between 2000 and 2022:| Auburn, Massachusetts: | +95.7% |
| Massachusetts: | +109.4% |
Income statistics for Asian residents
Median household income in Auburn, MA in 2022:| Auburn: | $115,436 |
| State: | $117,855 |
Change in median household income between 2000 and 2022:| Auburn, Massachusetts: | +149.6% |
| Massachusetts: | +129.9% |
Number of households with income < $10k:| Auburn: | 5.7% (732) |
| State: | 6.8% (11,982) |
Number of households with income $10k - 20k:| Auburn: | 5.8% (736) |
| State: | 4.8% (8,376) |
Number of households with income $20k - 30k:| Auburn: | 1.9% (244) |
| Massachusetts: | 3.7% (6,558) |
Number of households with income $30k - 40k:| Auburn: | 3.5% (453) |
| Massachusetts: | 3.3% (5,748) |
Number of households with income $40k - 50k:| Auburn: | 4.9% (629) |
| Massachusetts: | 4.1% (7,192) |
Number of households with income $50k - 60k:| Auburn: | 3.5% (447) |
| State: | 5.0% (8,734) |
Number of households with income $60k - 75k:| Auburn: | 4.3% (554) |
| Massachusetts: | 5.8% (10,203) |
Number of households with income $75k - 100k:| Auburn: | 6.1% (778) |
| State: | 8.6% (15,154) |
Number of households with income $100k - 125k:| Auburn: | 9.7% (1,244) |
| Massachusetts: | 10.8% (18,942) |
Number of households with income $125k - 150k:| Auburn: | 8.1% (1,031) |
| State: | 8.0% (14,037) |
Number of households with income $150k - 200k:| Auburn: | 21.1% (2,693) |
| Massachusetts: | 12.5% (21,856) |
Number of households with income > $200k:| Auburn: | 25.4% (3,241) |
| State: | 26.6% (46,694) |
Aggregate household income in Auburn in 2022: $7,276,498
Median family income in Auburn in 2022:| Auburn: | $130,109 |
| State: | $140,113 |
Number of families with income $40k - 50k:| Auburn: | 13.4% (5) |
| State: | 3.9% (4,621) |
Number of families with income > $200k:| Auburn: | 86.6% (34) |
| State: | 34.0% (39,856) |
Median non-family income in Auburn in 2022:| Auburn: | $30,170 |
| State: | $71,440 |
Median per capita income in Auburn in 2022:| Auburn: | $63,430 |
| Massachusetts: | $58,900 |
Income statistics for Hispanic or Latino residents
Median household income in Auburn, MA in 2022:| Auburn: | $160,481 |
| Massachusetts: | $61,523 |
Change in median household income between 2000 and 2022:| Auburn, Massachusetts: | +116.0% |
| State: | +125.4% |
Number of households with income < $10k:| Auburn: | 8.1% (8,213) |
| State: | 8.8% (25,307) |
Number of households with income $10k - 20k:| Auburn: | 10.5% (10,563) |
| State: | 10.0% (28,653) |
Number of households with income $20k - 30k:| Auburn: | 10.3% (10,446) |
| State: | 8.8% (25,189) |
Number of households with income $30k - 40k:| Auburn: | 9.5% (9,609) |
| State: | 7.2% (20,822) |
Number of households with income $40k - 50k:| Auburn: | 7.1% (7,187) |
| Massachusetts: | 7.2% (20,817) |
Number of households with income $50k - 60k:| Auburn: | 8.0% (8,070) |
| Massachusetts: | 6.5% (18,748) |
Number of households with income $60k - 75k:| Auburn: | 11.1% (11,183) |
| State: | 8.8% (25,390) |
Number of households with income $75k - 100k:| Auburn: | 14.1% (14,229) |
| Massachusetts: | 12.0% (34,488) |
Number of households with income $100k - 125k:| Auburn: | 5.7% (5,744) |
| State: | 8.6% (24,599) |
Number of households with income $125k - 150k:| Auburn: | 8.8% (8,921) |
| State: | 6.2% (17,743) |
Number of households with income $150k - 200k:| Auburn: | 3.6% (3,587) |
| Massachusetts: | 7.3% (21,017) |
Number of households with income > $200k:| Auburn: | 3.2% (3,216) |
| Massachusetts: | 8.6% (24,606) |
Aggregate household income in Auburn in 2022: $18,463,919
Median family income in Auburn in 2022:| Auburn: | $187,659 |
| Massachusetts: | $66,072 |
Number of families with income < $10k:| Auburn: | 3.3% (19) |
| Massachusetts: | 6.2% (12,456) |
Number of families with income $10k - 20k:| Auburn: | 4.4% (25) |
| State: | 6.0% (12,071) |
Number of families with income $20k - 30k:| Auburn: | 9.0% (51) |
| State: | 10.1% (20,376) |
Number of families with income $30k - 40k:| Auburn: | 11.4% (65) |
| Massachusetts: | 8.2% (16,470) |
Number of families with income $40k - 50k:| Auburn: | 11.4% (65) |
| State: | 7.4% (14,829) |
Number of families with income $50k - 60k:| Auburn: | 14.9% (84) |
| State: | 7.3% (14,643) |
Number of families with income $60k - 75k:| Auburn: | 11.3% (64) |
| State: | 10.6% (21,252) |
Number of families with income $75k - 100k:| Auburn: | 12.6% (72) |
| State: | 12.0% (24,088) |
Number of families with income $100k - 125k:| Auburn: | 6.0% (34) |
| Massachusetts: | 8.9% (17,954) |
Number of families with income $125k - 150k:| Auburn: | 10.8% (61) |
| Massachusetts: | 6.9% (13,837) |
Number of families with income $150k - 200k:| Auburn: | 3.5% (20) |
| State: | 7.3% (14,683) |
Number of families with income > $200k:| Auburn: | 1.4% (8) |
| Massachusetts: | 9.3% (18,741) |
Median non-family income in Auburn in 2022:| Auburn: | $56,310 |
| Massachusetts: | $37,563 |
Change in median non-family income between 2000 and 2022:| Auburn, Massachusetts: | +95.9% |
| Massachusetts: | +115.0% |
Median per capita income in Auburn in 2022:| Auburn: | $47,938 |
| State: | $28,993 |
Change in median per capita income between 2000 and 2022:| Auburn, Massachusetts: | +110.9% |
| Massachusetts: | +142.4% |
Income statistics for American Indian and Alaska Native residents
Median household income in Auburn, MA in 2022:| Auburn: | $126,601 |
| State: | $87,730 |
Number of households with income < $10k:| Auburn: | 6.6% (475) |
| Massachusetts: | 6.6% (451) |
Number of households with income $10k - 20k:| Auburn: | 7.0% (501) |
| State: | 7.0% (476) |
Number of households with income $20k - 30k:| Auburn: | 2.8% (202) |
| State: | 2.8% (192) |
Number of households with income $30k - 40k:| Auburn: | 3.2% (229) |
| Massachusetts: | 3.2% (218) |
Number of households with income $40k - 50k:| Auburn: | 2.9% (210) |
| State: | 2.9% (199) |
Number of households with income $50k - 60k:| Auburn: | 9.9% (713) |
| State: | 9.9% (677) |
Number of households with income $60k - 75k:| Auburn: | 11.5% (822) |
| State: | 11.5% (781) |
Number of households with income $75k - 100k:| Auburn: | 9.2% (662) |
| State: | 9.2% (629) |
Number of households with income $100k - 125k:| Auburn: | 6.0% (427) |
| State: | 6.0% (406) |
Number of households with income $125k - 150k:| Auburn: | 13.5% (970) |
| Massachusetts: | 13.5% (921) |
Number of households with income $150k - 200k:| Auburn: | 12.6% (904) |
| State: | 12.6% (859) |
Number of households with income > $200k:| Auburn: | 14.7% (1,056) |
| State: | 14.7% (1,003) |
Aggregate household income in Auburn in 2022: $2,473,428
Median family income in Auburn in 2022:| Auburn: | $117,684 |
| State: | $105,715 |
Number of families with income $10k - 20k:| Auburn: | 25.7% (5) |
| Massachusetts: | 11.4% (365) |
Number of families with income $60k - 75k:| Auburn: | 74.3% (15) |
| State: | 14.7% (471) |
Median per capita income in Auburn in 2022:| Auburn: | $17,713 |
| State: | $39,434 |
Change in median per capita income between 2000 and 2022:| Auburn, Massachusetts: | +80.0% |
| Massachusetts: | +148.2% |
Income statistics for Multirace residents
Median household income in Auburn, MA in 2022:| Auburn: | $167,419 |
| State: | $71,552 |
Change in median household income between 2000 and 2022:| Auburn, Massachusetts: | +84.7% |
| State: | +109.0% |
Number of households with income < $10k:| Auburn: | 7.4% (6,235) |
| Massachusetts: | 6.6% (15,127) |
Number of households with income $10k - 20k:| Auburn: | 10.3% (8,665) |
| Massachusetts: | 9.2% (21,158) |
Number of households with income $20k - 30k:| Auburn: | 10.2% (8,564) |
| State: | 7.8% (18,016) |
Number of households with income $30k - 40k:| Auburn: | 11.3% (9,481) |
| State: | 7.9% (18,260) |
Number of households with income $40k - 50k:| Auburn: | 6.2% (5,199) |
| State: | 5.6% (13,027) |
Number of households with income $50k - 60k:| Auburn: | 8.7% (7,322) |
| State: | 5.6% (12,909) |
Number of households with income $60k - 75k:| Auburn: | 8.2% (6,848) |
| State: | 9.0% (20,800) |
Number of households with income $75k - 100k:| Auburn: | 13.5% (11,318) |
| Massachusetts: | 12.1% (27,875) |
Number of households with income $100k - 125k:| Auburn: | 6.2% (5,178) |
| State: | 8.1% (18,754) |
Number of households with income $125k - 150k:| Auburn: | 6.4% (5,387) |
| State: | 6.8% (15,621) |
Number of households with income $150k - 200k:| Auburn: | 5.9% (4,971) |
| State: | 9.4% (21,618) |
Number of households with income > $200k:| Auburn: | 5.6% (4,674) |
| State: | 12.0% (27,592) |
Aggregate household income in Auburn in 2022: $8,391,392
Median family income in Auburn in 2022:| Auburn: | $163,990 |
| Massachusetts: | $78,380 |
Number of families with income $40k - 50k:| Auburn: | 11.7% (11) |
| State: | 5.3% (8,255) |
Number of families with income $75k - 100k:| Auburn: | 88.3% (82) |
| Massachusetts: | 12.1% (18,758) |
Median per capita income in Auburn in 2022:| Auburn: | $21,474 |
| State: | $34,029 |
Change in median per capita income between 2000 and 2022:| Auburn, Massachusetts: | +104.0% |
| Massachusetts: | +132.1% |
Income statistics for other residents
Number of households with income < $10k:| Auburn: | 0.0% (0) |
| State: | 8.4% (11,559) |
Number of households with income $10k - 20k:| Auburn: | 0.0% (0) |
| State: | 8.4% (11,499) |
Number of households with income $20k - 30k:| Auburn: | 6.7% (1) |
| State: | 9.5% (13,070) |
Number of households with income $30k - 40k:| Auburn: | 13.3% (2) |
| Massachusetts: | 6.0% (8,291) |
Number of households with income $40k - 50k:| Auburn: | 6.7% (1) |
| State: | 9.2% (12,611) |
Number of households with income $50k - 60k:| Auburn: | 13.3% (2) |
| State: | 7.9% (10,879) |
Number of households with income $60k - 75k:| Auburn: | 13.3% (2) |
| Massachusetts: | 7.5% (10,239) |
Number of households with income $75k - 100k:| Auburn: | 20.0% (3) |
| State: | 13.1% (18,032) |
Number of households with income $100k - 125k:| Auburn: | 6.7% (1) |
| Massachusetts: | 9.6% (13,141) |
Number of households with income $125k - 150k:| Auburn: | 6.7% (1) |
| State: | 5.0% (6,808) |
Number of households with income $150k - 200k:| Auburn: | 6.7% (1) |
| State: | 6.4% (8,843) |
Number of households with income > $200k:| Auburn: | 6.7% (1) |
| State: | 9.0% (12,396) |
Aggregate household income in Auburn in 2022: $1,430,443
Median non-family income in Auburn in 2022:| Auburn: | $114,018 |
| State: | $36,127 |
Median per capita income in Auburn in 2022:| Auburn: | $45,434 |
| State: | $30,797 |