Wyandotte, MI (Michigan) Houses and Residents
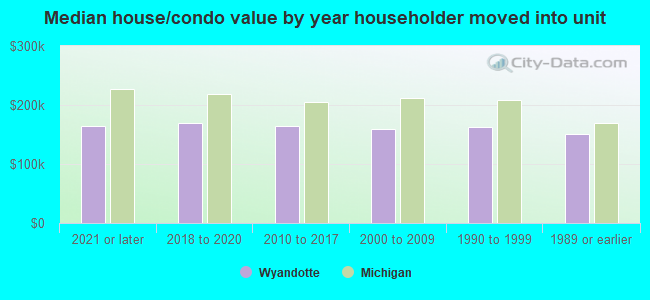
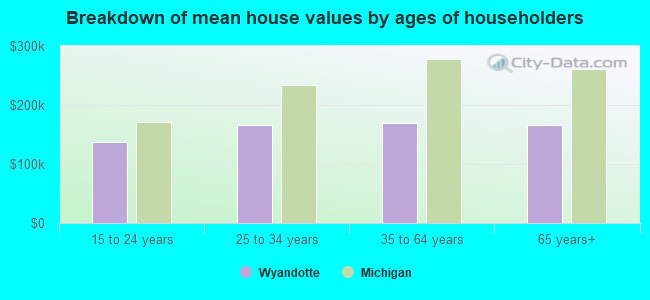
| Wyandotte: | $161,795 |
| Michigan: | $224,400 |
Mean price in 2022:
Detached houses: $154,226
Here: $154,226 State: $280,038 Townhouses or other attached units: $207,284
Here: $207,284 State: $239,520 In 2-unit structures: $172,467
Here: $172,467 State: $219,481 In 5-or-more-unit structures: $227,572
Here: $227,572 State: $192,733 Mobile homes: $26,997
Here: $26,997 State: $72,868
Total population: 25,151 (All urban)
Houses: 11,578 (10,835 occupied: 7,986 owner occupied, 2,911 renter occupied)
| % of renters here: | 27% |
| State: | 27% |
Housing density: 2,182 houses/condos per square mile
Median price asked for vacant for-sale houses and condos in 2022: $203,569.
Median contract rent in 2022: $816 (lower quartile is $584, upper quartile is $1,037)
Median rent asked for vacant for-rent units in 2022: $1,473
Median gross rent in Wyandotte, MI in 2022: $937
Housing units in Wyandotte with a mortgage: 5,094 (362 second mortgage, 0 home equity loan, 356 both second mortgage and home equity loan)
Houses without a mortgage: 43
Median household income for houses/condos with a mortgage: $84,216
Median household income for apartments without a mortgage: $53,255
Median monthly housing costs: $970
Compare current foreclosures in Wyandotte, MI:
| Photo | Address | Area | Beds / Baths | Price | Details |
|---|---|---|---|---|---|

|
#1
Vinewood St
Wyandotte, MI 48192
|
1,089 sq. feet
|
1 baths 3 beds |
show details | |

|
#2
6th St
Wyandotte, MI 48192
|
962 sq. feet
|
1 baths 3 beds |
show details | |

|
#3
Biddle Ave
Wyandotte, MI 48192
|
- sq. feet
|
1 baths 3 beds |
show details | |

|
#4
Lincoln St
Wyandotte, MI 48192
|
1,600 sq. feet
|
2 baths - beds |
show details | |

|
#5
2nd St
Wyandotte, MI 48192
|
- sq. feet
|
1 baths 3 beds |
show details | |

|
#6
Mulberry St # 36
Wyandotte, MI 48192
|
1,291 sq. feet
|
2 baths - beds |
show details | |

|
#7
6th St
Wyandotte, MI 48192
|
1,125 sq. feet
|
1 baths - beds |
show details | |

|
#8
23rd St
Wyandotte, MI 48192
|
1,152 sq. feet
|
1 baths - beds |
show details | |

|
#9
Kings Hwy
Wyandotte, MI 48192
|
1,056 sq. feet
|
1 baths - beds |
show details | |

|
#10
22nd St
Wyandotte, MI 48192
|
728 sq. feet
|
1 baths - beds |
show details |
| Photo | Address | Area | Beds / Baths | Price | Details |
|---|---|---|---|---|---|

|
#11
Poplar St
Wyandotte, MI 48192
|
1,152 sq. feet
|
2 baths - beds |
show details | |

|
#12
Ford Ave
Wyandotte, MI 48192
|
770 sq. feet
|
1 baths - beds |
show details | |

|
#13
Sycamore St Apt 204
Wyandotte, MI 48192
|
- sq. feet
|
- baths - beds |
show details | |

|
#14
5th St Apt 4
Wyandotte, MI 48192
|
- sq. feet
|
- baths - beds |
show details | |

|
#15
Superior Blvd
Wyandotte, MI 48192
|
- sq. feet
|
- baths - beds |
show details | |

|
#16
Forest St
Wyandotte, MI 48192
|
- sq. feet
|
2 baths - beds |
show details | |

|
#17
2nd St
Wyandotte, MI 48192
|
- sq. feet
|
2 baths - beds |
show details | |

|
#18
Van Alstyne St # 1
Wyandotte, MI 48192
|
- sq. feet
|
- baths - beds |
show details | |

|
#19
10th St Apt 2
Wyandotte, MI 48192
|
- sq. feet
|
- baths - beds |
show details | |

|
#20
16th St
Wyandotte, MI 48192
|
- sq. feet
|
- baths - beds |
show details |
| Photo | Address | Area | Beds / Baths | Price | Details |
|---|---|---|---|---|---|

|
#21
2nd St
Wyandotte, MI 48192
|
- sq. feet
|
- baths - beds |
show details | |

|
#22
23rd St
Wyandotte, MI 48192
|
- sq. feet
|
- baths - beds |
show details | |

|
#23
Maple St
Wyandotte, MI 48192
|
- sq. feet
|
- baths - beds |
show details | |

|
#24
Chestnut St Apt 3
Wyandotte, MI 48192
|
- sq. feet
|
- baths - beds |
show details | |

|
#25
Biddle Ave Apt 5
Wyandotte, MI 48192
|
- sq. feet
|
- baths - beds |
show details | |

|
#26
3rd St
Wyandotte, MI 48192
|
- sq. feet
|
- baths - beds |
show details | |

|
#27
11th St
Wyandotte, MI 48192
|
- sq. feet
|
1 baths - beds |
show details | |

|
#28
Hudson St
Wyandotte, MI 48192
|
- sq. feet
|
- baths - beds |
show details | |

|
#29
Vinewood St
Wyandotte, MI 48192
|
- sq. feet
|
- baths - beds |
show details | |

|
#30
Clinton St
Wyandotte, MI 48192
|
- sq. feet
|
- baths - beds |
show details |
| Photo | Address | Area | Beds / Baths | Price | Details |
|---|---|---|---|---|---|

|
#31
Superior Blvd
Wyandotte, MI 48192
|
- sq. feet
|
- baths - beds |
show details | |

|
#32
Highland St
Wyandotte, MI 48192
|
- sq. feet
|
- baths - beds |
show details | |

|
#33
Elm St Apt 2
Wyandotte, MI 48192
|
- sq. feet
|
- baths - beds |
show details | |

|
#34
Quarry St
Wyandotte, MI 48192
|
- sq. feet
|
- baths - beds |
show details | |

|
#35
Biddle Ave Apt 410
Wyandotte, MI 48192
|
- sq. feet
|
- baths - beds |
show details | |

|
#36
Perry Pl
Wyandotte, MI 48192
|
- sq. feet
|
- baths - beds |
show details | |

|
#37
18th St
Wyandotte, MI 48192
|
- sq. feet
|
- baths - beds |
show details | |

|
#38
10th St
Wyandotte, MI 48192
|
- sq. feet
|
- baths - beds |
show details | |

|
#39
21st St
Wyandotte, MI 48192
|
- sq. feet
|
- baths - beds |
show details | |

|
#40
Plum St
Wyandotte, MI 48192
|
- sq. feet
|
- baths - beds |
show details |
| Photo | Address | Area | Beds / Baths | Price | Details |
|---|---|---|---|---|---|

|
#41
Chestnut St
Wyandotte, MI 48192
|
- sq. feet
|
- baths - beds |
show details | |

|
#42
23rd St
Wyandotte, MI 48192
|
- sq. feet
|
- baths - beds |
show details | |

|
#43
Saint John St
Wyandotte, MI 48192
|
- sq. feet
|
- baths - beds |
show details | |

|
#44
Lindbergh St
Wyandotte, MI 48192
|
- sq. feet
|
- baths - beds |
show details | |

|
#45
Van Alstyne St
Wyandotte, MI 48192
|
- sq. feet
|
- baths - beds |
show details | |

|
#46
15th St
Wyandotte, MI 48192
|
- sq. feet
|
- baths - beds |
show details | |

|
#47
19th St
Wyandotte, MI 48192
|
- sq. feet
|
- baths - beds |
show details | |

|
#48
15th St
Wyandotte, MI 48192
|
- sq. feet
|
- baths - beds |
show details | |

|
#49
14th St
Wyandotte, MI 48192
|
- sq. feet
|
- baths - beds |
show details | |

|
Check over 1 million property listings on Foreclosure.com!
|
browse all offers | |||

Latest news about housing in Wyandotte, MI collected exclusively by city-data.com from local newspapers, TV, and radio stations

 | Renting a house vs. apartment in Downriver area (8 replies) |
| Rental Houses Near Wyandotte (2 replies) |
| Are Lincoln Park and Wyandotte Michigan safe places to live (8 replies) |
| Senior homesick for Downriver Michigan (19 replies) |
| Buying a home Downriver Fall 2014. wyandotte or southgate? (19 replies) |
| Home Sweet Home...? (15 replies) |

Median year apartment built: 1954
Household type by relationship:
Households: 24,513- Male householders: 4,969 (1,736 living alone), Female householders: 5,732 (2,153 living alone)
4,078 spouses (4,026 opposite-sex spouses), 1,078 unmarried partners, (957 opposite-sex unmarried partners), 6,308 children (5,965 natural, 90 adopted, 252 stepchildren), 535 grandchildren, 178 brothers or sisters, 220 parents, 81 foster children, 341 other relatives, 927 non-relatives
- In group quarters: 60
Size of family households: 3,080 2-persons, 1,408 3-persons, 851 4-persons, 481 5-persons, 164 6-persons, 61 7-or-more-persons.
Size of nonfamily households: 4,031 1-person, 711 2-persons, 68 3-persons, 15 4-persons, 62 5-persons.
2,374 married couples with children.
1,609 single-parent households (384 men, 1,225 women).
95.7% of residents of Wyandotte speak English at home.
1.6% of residents speak Spanish at home (62% speak English very well, 4% speak English well, 34% speak English not well).
1.5% of residents speak other Indo-European language at home (85% speak English very well, 12% speak English well, 3% speak English not well).
0.5% of residents speak Asian or Pacific Island language at home (73% speak English very well, 27% speak English well).
0.5% of residents speak other language at home (80% speak English very well, 20% speak English well).
Foreign born population: 744 (3.0%)
(54.4% of them are naturalized citizens)
| Here: | 5.9 |
| State: | 6.5 |
| Here: | 4.5 |
| State: | 4.3 |
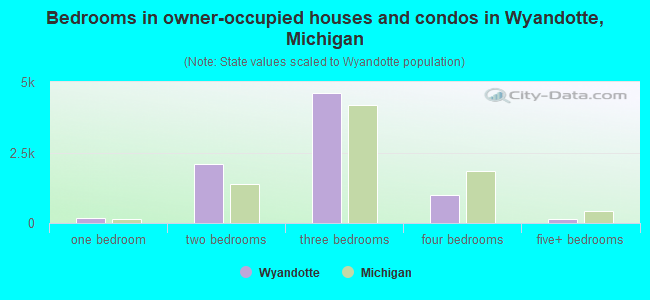
- Bedrooms in owner-occupied houses and condos in Wyandotte, Michigan
- 7no bedroom
- 1831 bedroom
- 2,0832 bedrooms
- 4,6033 bedrooms
- 9784 bedrooms
- 1335+ bedrooms
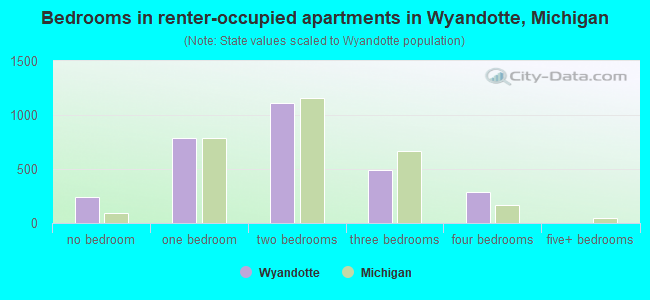
- Bedrooms in renter-occupied apartments in Wyandotte, Michigan
- 237no bedroom
- 7831 bedroom
- 1,1152 bedrooms
- 4893 bedrooms
- 2834 bedrooms
- 45+ bedrooms
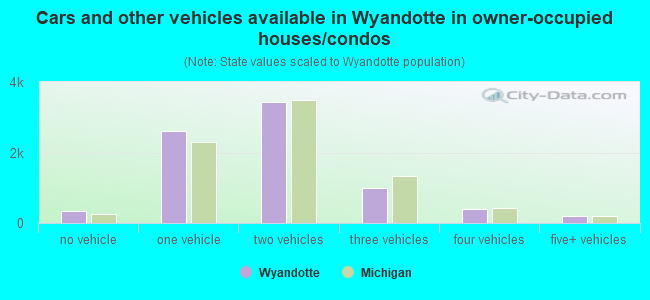
- Cars and other vehicles available in Wyandotte in owner-occupied houses/condos
- 349no vehicle
- 2,5971 vehicle
- 3,4302 vehicles
- 1,0063 vehicles
- 4074 vehicles
- 1985+ vehicles
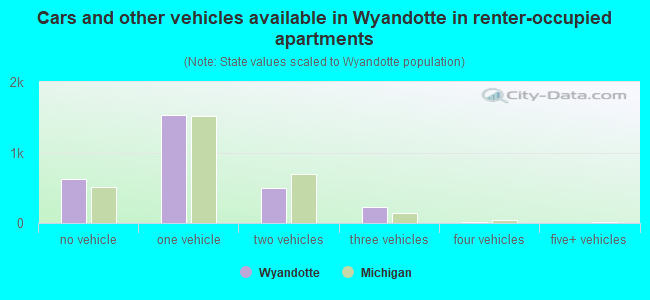
- Cars and other vehicles available in Wyandotte in renter-occupied apartments
- 629no vehicle
- 1,5381 vehicle
- 5012 vehicles
- 2303 vehicles
- 144 vehicles
- 05+ vehicles
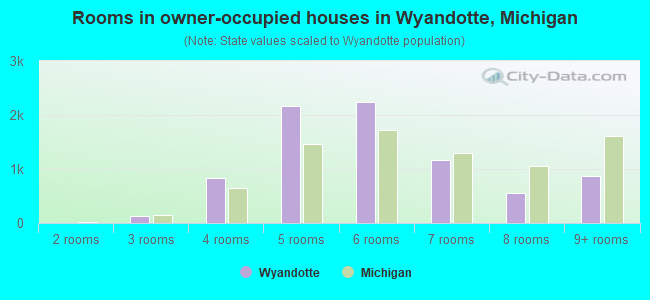
- Rooms in owner-occupied houses in Wyandotte, Michigan
- 01 room
- 02 rooms
- 1363 rooms
- 8314 rooms
- 2,1695 rooms
- 2,2506 rooms
- 1,1607 rooms
- 5648 rooms
- 8789+ rooms
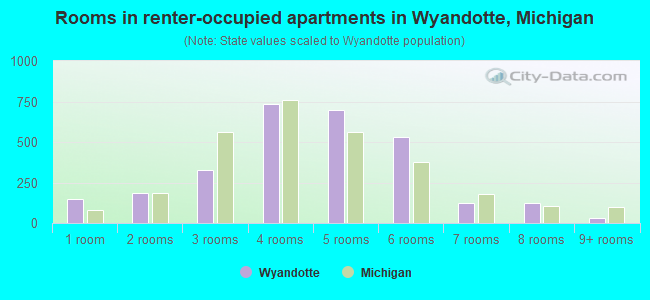
- Rooms in renter-occupied apartments in Wyandotte, Michigan
- 1511 room
- 1882 rooms
- 3303 rooms
- 7354 rooms
- 6995 rooms
- 5286 rooms
- 1267 rooms
- 1258 rooms
- 309+ rooms

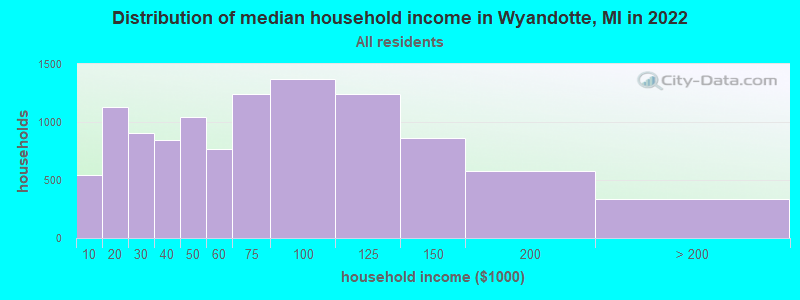
Wyandotte, MI household income distribution

- 546Less than $10,000
- 1,126$10,000 to $19,999
- 902$20,000 to $29,999
- 847$30,000 to $39,999
- 1,043$40,000 to $49,999
- 766$50,000 to $59,999
- 1,243$60,000 to $74,999
- 1,370$75,000 to $99,999
- 1,245$100,000 to $124,999
- 864$125,000 to $149,999
- 581$150,000 to $199,999
- 334$200,000 or more
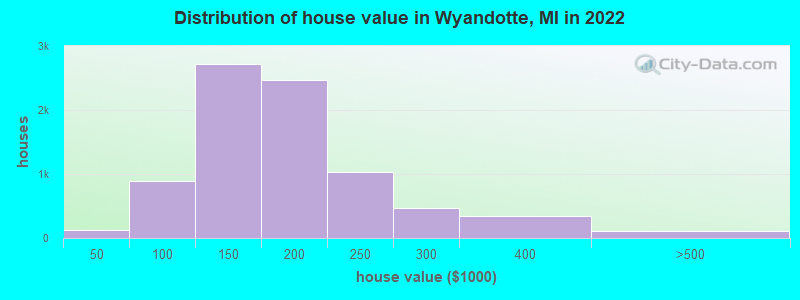
Home value of owner - occupied houses in 2022 in Wyandotte, MI
-
- 12Less than $10,000
- 32$10,000 to $14,999
- 55$15,000 to $19,999
- 7$20,000 to $24,999
- 17$25,000 to $29,999
- 90$50,000 to $59,999
- 80$60,000 to $69,999
- 139$70,000 to $79,999
- 268$80,000 to $89,999
- 310$90,000 to $99,999
- 1,470$100,000 to $124,999
- 1,243$125,000 to $149,999
- 1,600$150,000 to $174,999
- 868$175,000 to $199,999
- 1,025$200,000 to $249,999
- 467$250,000 to $299,999
- 342$300,000 to $399,999
- 72$400,000 to $499,999
- 14$500,000 to $749,999
- 1$750,000 to $999,999
- 19$1,500,000 to $1,999,999
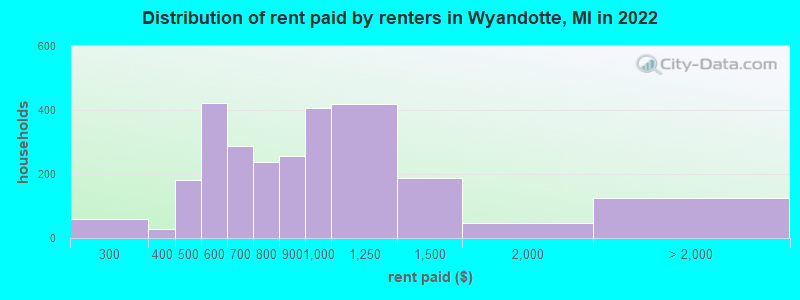
Rent paid by renters in 2022 in Wyandotte, MI
-
- 53$200 to $249
- 5$250 to $299
- 28$300 to $349
- 50$400 to $449
- 131$450 to $499
- 173$500 to $549
- 248$550 to $599
- 147$600 to $649
- 139$650 to $699
- 162$700 to $749
- 75$750 to $799
- 254$800 to $899
- 404$900 to $999
- 418$1,000 to $1,249
- 188$1,250 to $1,499
- 45$1,500 to $1,999
- 124No cash rent
Percentage of workers working in this county: 90.0%
Number of people working at home: 1,417 (12.0% of all workers)
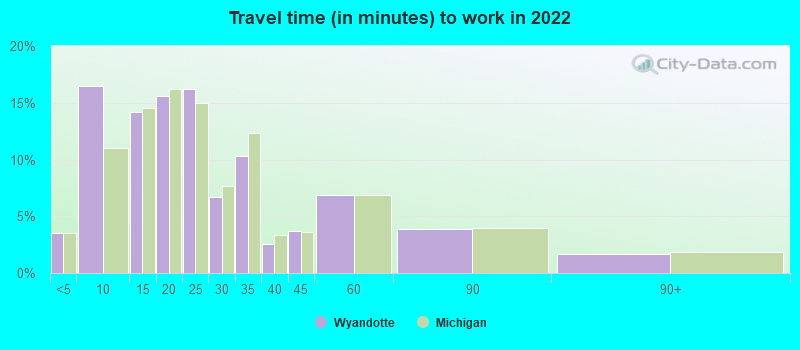
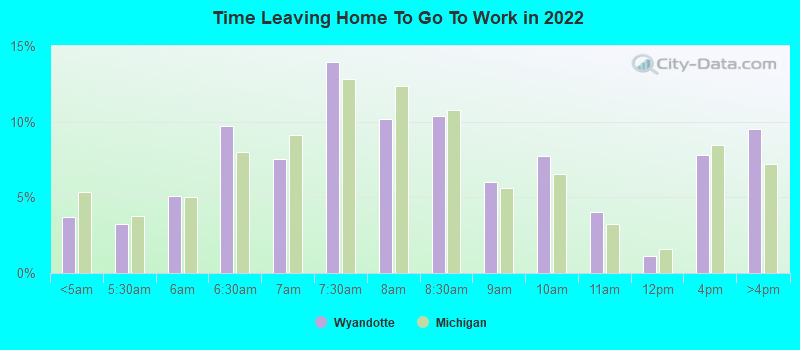
Travel time to work (commute)
- Less than 5 minutes: 445
- 5 to 9 minutes: 1,594
- 10 to 14 minutes: 1,378
- 15 to 19 minutes: 1,508
- 20 to 24 minutes: 1,502
- 25 to 29 minutes: 755
- 30 to 34 minutes: 1,110
- 35 to 39 minutes: 144
- 40 to 44 minutes: 434
- 45 to 59 minutes: 956
- 60 to 89 minutes: 403
- 90 or more minutes: 160
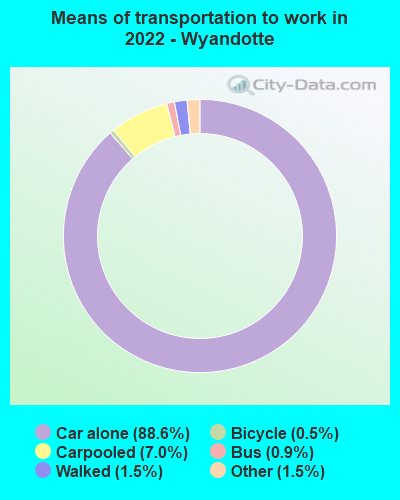
Means of transportation to work:
- Drove a car alone: 7,500 (76.2%)
- Carpooled: 588 (6.0%)
- Bus: 65 (0.7%)
- Taxi: 133 (1.4%)
- Bicycle: 51 (0.5%)
- Walked: 136 (1.4%)
- Worked at home: 1,417 (14.4%)
- Unemployment by race in 2022
- Unemployment rate for White non-Hispanic residents
- 3.9%Males
- 2.5%Females
- Unemployment rate for Black residents
- 7.3%Males
- Unemployment rate for two or more race residents
- 6.2%Males
- Unemployment rate for Hispanic or Latino residents
- 1.2%Males
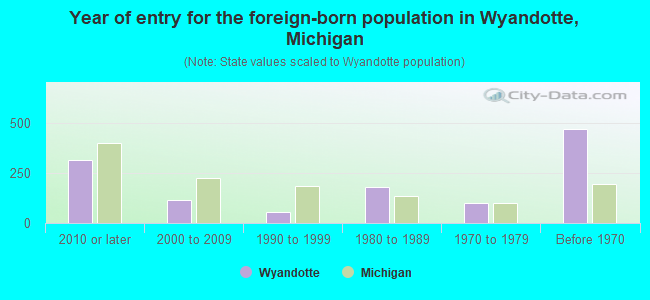
- Year of entry for the foreign-born population in Wyandotte, Michigan
- 3122010 or later
- 1172000 to 2009
- 571990 to 1999
- 1821980 to 1989
- 991970 to 1979
- 469Before 1970
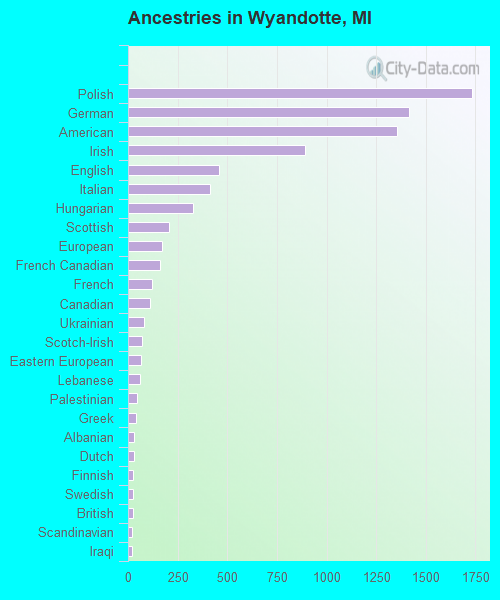
First ancestries reported:
- Polish: 1,732 (15.6%)
- German: 1,417 (12.8%)
- American: 1,355 (12.2%)
- Irish: 893 (8.0%)
- English: 459 (4.1%)
- Italian: 413 (3.7%)
- Hungarian: 328 (3.0%)
- Scottish: 206 (1.9%)
- European: 172 (1.5%)
- French Canadian: 163 (1.5%)
- French: 121 (1.1%)
- Canadian: 113 (1.0%)
- Ukrainian: 82 (0.7%)
- Scotch-Irish: 70 (0.6%)
- Eastern European: 65 (0.6%)
- Lebanese: 60 (0.5%)
- Palestinian: 45 (0.4%)
- Greek: 41 (0.4%)
- Albanian: 29 (0.3%)
- Dutch: 28 (0.3%)
- Finnish: 26 (0.2%)
- Swedish: 25 (0.2%)
- British: 23 (0.2%)
- Scandinavian: 20 (0.2%)
- Iraqi: 20 (0.2%)
- Russian: 18 (0.2%)
- Czechoslovakian: 13 (0.1%)
- Serbian: 13 (0.1%)
- Norwegian: 12 (0.1%)
- Celtic: 7 (0.06%)
- Macedonian: 7 (0.06%)
- Maltese: 7 (0.06%)
- Slovak: 6 (0.05%)
- Welsh: 5 (0.05%)
- Belgian: 3 (0.03%)
- Armenian: 2 (0.02%)
Most common places of birth for foreign-born residents (%):
| Wyandotte: | 23.6% (171) |
| Michigan: | 10.9% (75,965) |
| Wyandotte: | 21.8% (158) |
| Michigan: | 5.0% (35,052) |
| Wyandotte: | 6.1% (44) |
| Michigan: | 2.8% (19,112) |
| Wyandotte: | 5.8% (42) |
| Michigan: | 2.3% (16,126) |
| Wyandotte: | 5.1% (37) |
| Michigan: | 0.2% (1,159) |
| Wyandotte: | 4.0% (29) |
| Michigan: | 0.3% (2,076) |
| Wyandotte: | 3.9% (28) |
| Michigan: | 0.9% (6,424) |
| Wyandotte: | 3.6% (26) |
| Michigan: | 1.0% (6,829) |
| Wyandotte: | 3.2% (23) |
| Michigan: | 0.9% (6,326) |
| Wyandotte: | 2.9% (21) |
| Michigan: | 1.1% (7,792) |
| Wyandotte: | 2.3% (17) |
| Michigan: | 11.1% (77,240) |
| Wyandotte: | 2.1% (15) |
| Michigan: | 1.8% (12,679) |
| Wyandotte: | 1.8% (13) |
| Michigan: | 0.1% (861) |
| Wyandotte: | 1.5% (11) |
| Michigan: | 0.3% (1,965) |
Place of birth for U.S.-born residents:
- This state: 21,055
- Other state: 2,609
- Northeast: 355
- Midwest: 600
- South: 1,333
- West: 322
93.0% of Wyandotte residents lived in the same house 1 years ago.
Out of people who lived in different houses, 43.7% lived in this county.
Out of people who lived in different counties, 62.7% lived in Michigan.
| Wyandotte: | 93.0% |
| State average: | 88.4% |
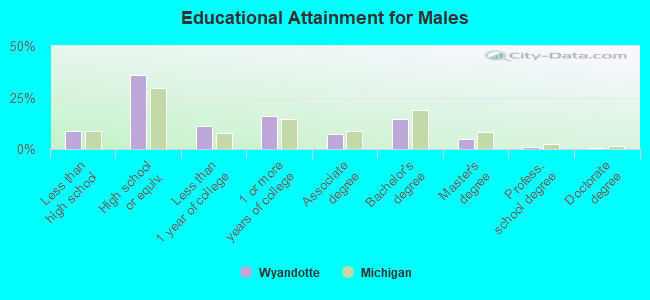
Education attainment for males 25 years and older:
- No schooling: 155
- Nursery to 4th grade: 26
- 5th and 6th grade: 0
- 7th and 8th grade: 13
- 9th grade: 44
- 10th grade: 198
- 11th grade: 139
- 12th grade, no diploma: 169
- High school graduate (or equivalency): 2,997
- Less than 1 year of college: 933
- Some college more than 1 year, no degree: 1,324
- Associate degree: 603
- Bachelor's degree: 1,194
- Master's degree: 415
- Professional school degree: 67
- Doctorate degree: 37
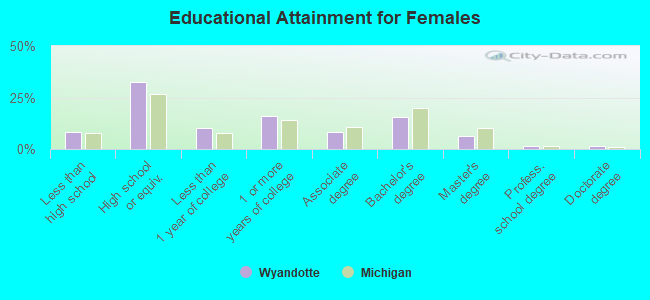
Education attainment for females 25 years and older:
- No schooling: 130
- Nursery to 4th grade: 13
- 5th and 6th grade: 13
- 7th and 8th grade: 21
- 9th grade: 110
- 10th grade: 202
- 11th grade: 224
- 12th grade, no diploma: 81
- High school graduate (or equivalency): 3,092
- Less than 1 year of college: 994
- Some college more than 1 year, no degree: 1,556
- Associate degree: 807
- Bachelor's degree: 1,481
- Master's degree: 601
- Professional school degree: 119
- Doctorate degree: 125


Housing units in structures:
- One, detached: 9,004
- One, attached: 362
- Two: 511
- 3 or 4: 663
- 5 to 9: 291
- 10 to 19: 137
- 20 to 49: 154
- 50 or more: 427
- Mobile homes: 25
Housing units lacking complete kitchen facilities in 2022: 1.0%
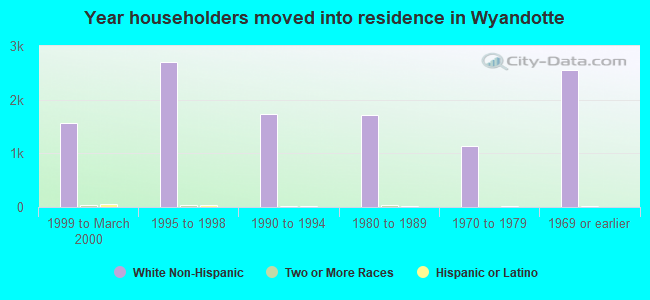
House/condo owner moved in on average 15 years ago
Renter moved in on average 3 years ago
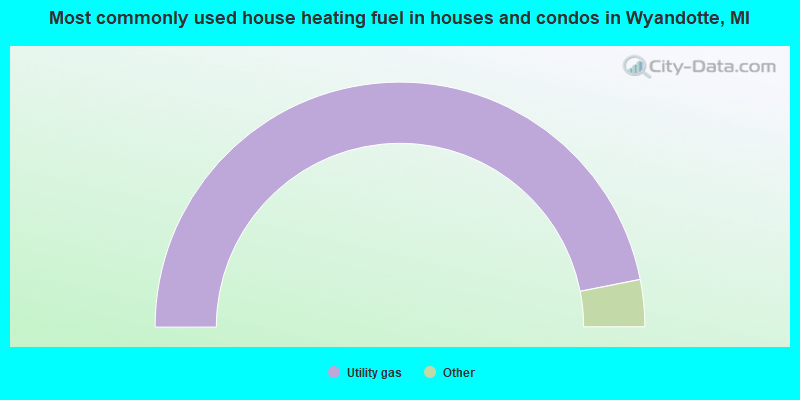
- 93.8%Utility gas
- 3.3%Electricity
- 1.6%Bottled, tank, or LP gas
- 0.5%Other fuel
- 0.4%Wood
- 0.2%Coal or coke
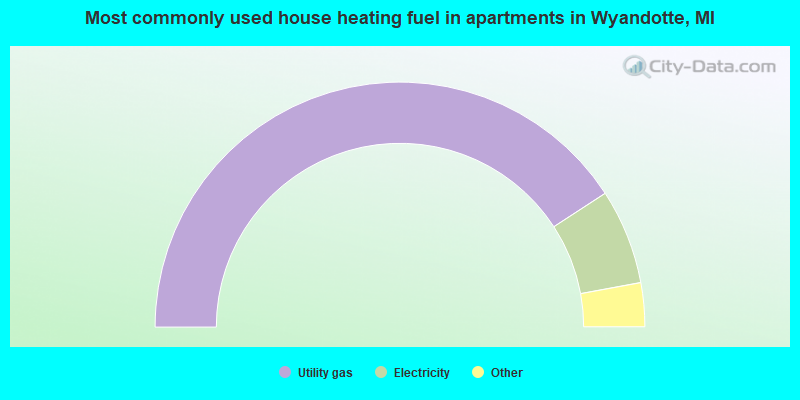
- 81.7%Utility gas
- 12.6%Electricity
- 1.8%Bottled, tank, or LP gas
- 1.7%Wood
- 1.2%No fuel used
- 1.1%Other fuel
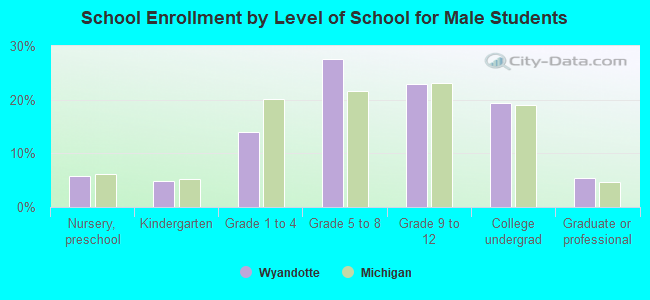
Private vs. public school enrollment:
| Here: | 4.9% |
| Michigan: | 12.4% |
| Here: | 8.6% |
| Michigan: | 9.8% |
| Here: | 9.9% |
| Michigan: | 14.9% |