Wyandanch, NY (New York) Houses and Residents
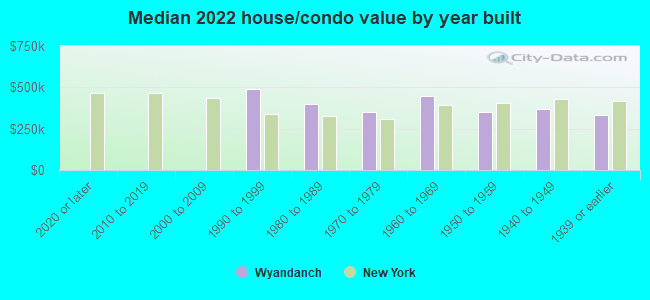
Estimated median house or condo value in 2022: $383,369 (it was $124,300 in 2000 )
Wyandanch:
$383,369New York:
$400,400
Lower value quartile - upper value quartile: $285,402 - $477,627Total population: 11,647 (Urban population: 10,579, Rural population: 0)
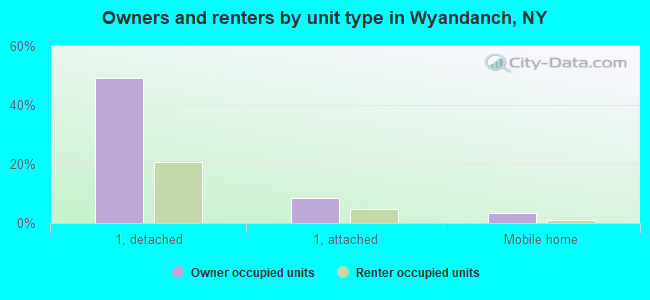
Houses: 4,072 (3,796 occupied: 2,482 owner occupied, 1,312 renter occupied )
% of renters here:
35%State:
46%
Housing density: 931 houses/condos per square mile
Median price asked for vacant for-sale houses and condos in 2022: $1,847,306.
Median contract rent in 2022: $1,895 (lower quartile is $1,326, upper quartile is over $2,000)
Median rent asked for vacant for-rent units in 2022: $2,144
Median gross rent in Wyandanch, NY in 2022: over $2,000
Housing units in Wyandanch with a mortgage: 1,247 (49 second mortgage, 0 home equity loan, 28 both second mortgage and home equity loan )Houses without a mortgage: 0
Median household income for houses/condos with a mortgage: $122,486
Median household income for apartments without a mortgage: $69,081
Median monthly housing costs: $1,833
Data:
Median house or condo value ($)
Median house or condo value ($ change since 2000)
Median house or condo value ($) - White
Median house or condo value ($) - Black or African American
Median house or condo value ($) - Asian
Median house or condo value ($) - Hispanic or Latino
Median house or condo value ($) - American Indian and Alaska Native
Median house or condo value ($) - Multirace
Median house or condo value ($) - Other Race
Median price asked for mobile homes ($)
Household density (households per square mile)
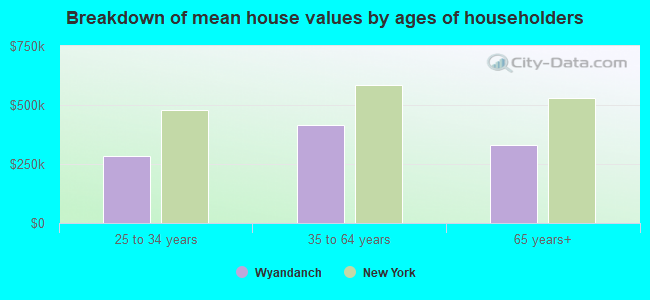
Mean house or condo value by units in structure - 1, detached ($)
Mean house or condo value by units in structure - 1, attached ($)
Mean house or condo value by units in structure - 2 ($)
Mean house or condo value by units in structure by units in structure - 3 or 4 ($)
Mean house or condo value by units in structure - 5 or more ($)
Mean house or condo value by units in structure - Boat, RV, van, etc. ($)
Mean house or condo value by units in structure - Mobile home ($)
Median contract rent ($)
Median contract rent - Lower quartile ($)
Median contract rent - Upper quartile ($)
Median gross rent ($)
Urban houses (%)
Rural houses (%)
Houses occupied (%)
Houses occupied (% change since 2000)
Houses owner occupied (%)
Houses owner occupied (% change since 2000)
Houses renter occupied (%)
Houses renter occupied (% change since 2000)
Vacant housing units - For rent (%)
Vacant housing units - For rent (% change since 2000)
Vacant housing units - For sale only (%)
Vacant housing units - For sale only (% change since 2000)
Vacant housing units - Rented or sold, not occupied (%)
Vacant housing units - Rented or sold, not occupied (% change since 2000)
Vacant housing units - For seasonal, recreational, or occasional use (%)
Vacant housing units - For seasonal, recreational, or occasional use (% change since 2000)
Vacant housing units - For migrant workers (%)
Vacant housing units - For migrant workers (% change since 2000)
Vacant housing units - Other vacant (%)
Vacant housing units - Other vacant (% change since 2000)
Median monthly housing costs ($)
Median household income for houses/condos with a mortgage ($)
Median household income for houses/condos without a mortgage ($)
Median household income ($)
Median household income ($) - White
Median household income ($) - Black or African American
Median household income ($) - Asian
Median household income ($) - Hispanic or Latino
Median household income ($) - American Indian and Alaska Native
Median household income ($) - Multirace
Median household income ($) - Other Race
Mortgage status - with mortgage (%)
Mortgage status - with second mortgage (%)
Mortgage status - with home equity loan (%)
Mortgage status - with both second mortgage and home equity loan (%)
Mortgage status - without a mortgage (%)
Median year house/condo built
Median year apartment built
Household type by relationship - Male householder living alone (%)
Household type by relationship - Male householder not living alone (%)
Household type by relationship - Female householder living alone (%)
Household type by relationship - Female householder not living alone (%)
Household type by relationship - Opposite-Sex spouse (%)
Household type by relationship - Same-Sex spouse (%)
Household type by relationship - Opposite-Sex unmarried partner (%)
Household type by relationship - Same-Sex unmarried partner (%)
Household type by relationship - In group quarters (%)
Size of family households - 2-person household (%)
Size of family households - 3-person household (%)
Size of family households - 4-person household (%)
Size of family households - 5-person household (%)
Size of family households - 6-person household (%)
Size of family households - 7-or-more-person household (%)
Size of nonfamily households - 1-person household (%)
Size of nonfamily households - 2-person household (%)
Size of nonfamily households - 3-person household (%)
Size of nonfamily households - 4-person household (%)
Size of nonfamily households - 5-person household (%)
Size of nonfamily households - 6-person household (%)
Size of nonfamily households - 7-or-moreperson household (%)
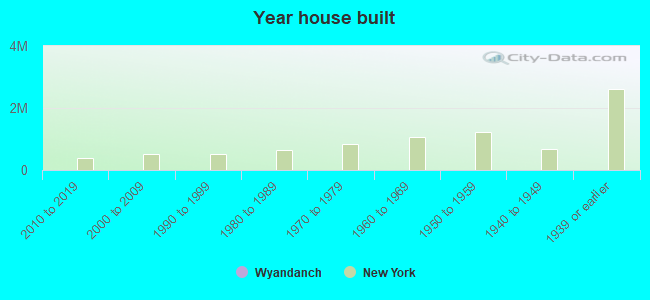
Year house built - Built 2010 or later (%)
Year house built - Built 2000 to 2009 (%)
Year house built - Built 1990 to 1999 (%)
Year house built - Built 1980 to 1989 (%)
Year house built - Built 1970 to 1979 (%)
Year house built - Built 1960 to 1969 (%)
Year house built - Built 1950 to 1959 (%)
Year house built - Built 1940 to 1949 (%)
Year house built - Built 1939 or earlier (%)
Median number of rooms in houses and condos
Median number of rooms in apartments
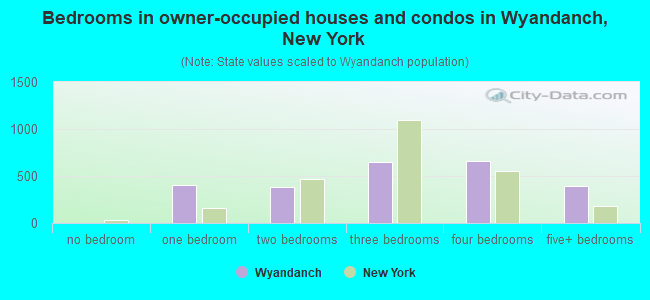
Median number of bedrooms in owner occupied houses
Mean number of bedrooms in owner occupied houses
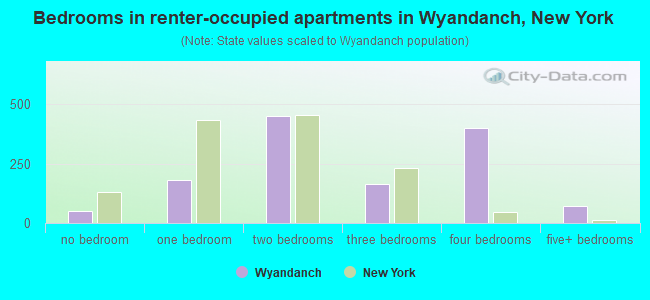
Median number of bedrooms in renter occupied houses
Mean number of bedrooms in renter occupied houses
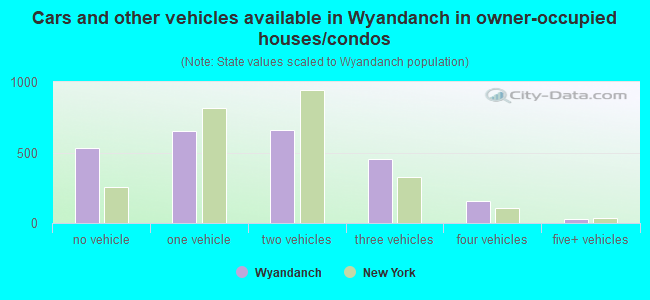
Median number of vehichles in owner occupied houses
Mean number of vehichles in owner occupied houses
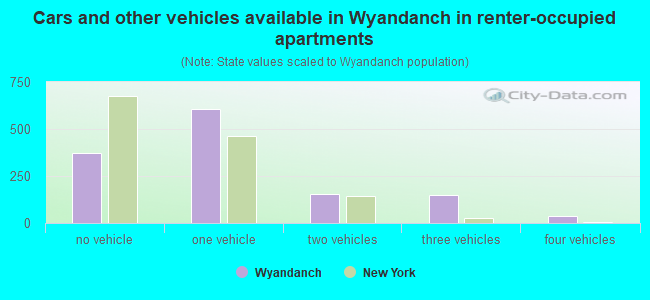
Median number of vehichles in renter occupied houses
Mean number of vehichles in renter occupied houses
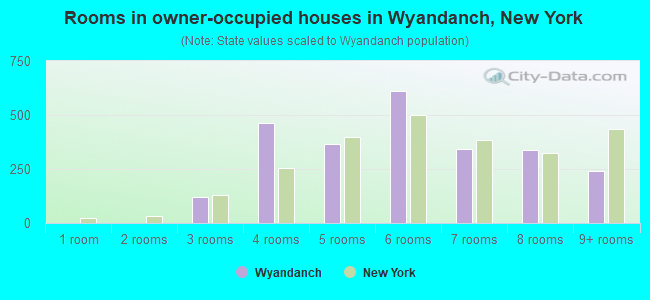
Rooms in owner-occupied houses - 1 room (%)
Rooms in owner-occupied houses - 2 rooms (%)
Rooms in owner-occupied houses - 3 rooms (%)
Rooms in owner-occupied houses - 4 rooms (%)
Rooms in owner-occupied houses - 5 rooms (%)
Rooms in owner-occupied houses - 6 rooms (%)
Rooms in owner-occupied houses - 7 rooms (%)
Rooms in owner-occupied houses - 8 rooms (%)
Rooms in owner-occupied houses - 9+ rooms (%)
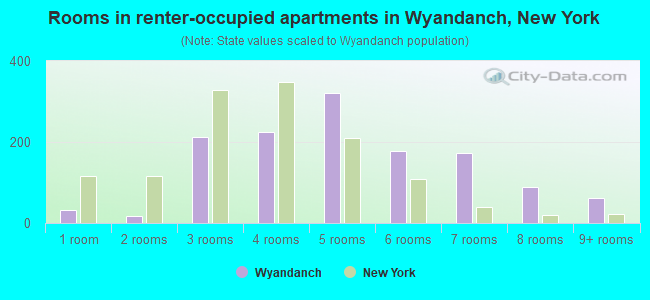
Rooms in renter-occupied houses - 1 room (%)
Rooms in renter-occupied houses - 2 rooms (%)
Rooms in renter-occupied houses - 3 rooms (%)
Rooms in renter-occupied houses - 4 rooms (%)
Rooms in renter-occupied houses - 5 rooms (%)
Rooms in renter-occupied houses - 6 rooms (%)
Rooms in renter-occupied houses - 7 rooms (%)
Rooms in renter-occupied houses - 8 rooms (%)
Rooms in renter-occupied houses - 9+ rooms (%)
Bedrooms in owner-occupied houses - no bedrooms (%)
Bedrooms in owner-occupied houses - 1 bedroom (%)
Bedrooms in owner-occupied houses - 2 bedrooms (%)
Bedrooms in owner-occupied houses - 3 bedrooms (%)
Bedrooms in owner-occupied houses - 4 bedrooms (%)
Bedrooms in owner-occupied houses - 5+ bedrooms (%)
Bedrooms in renter-occupied houses - no bedrooms (%)
Bedrooms in renter-occupied houses - 1 bedroom (%)
Bedrooms in renter-occupied houses - 2 bedrooms (%)
Bedrooms in renter-occupied houses - 3 bedrooms (%)
Bedrooms in renter-occupied houses - 4 bedrooms (%)
Bedrooms in renter-occupied houses - 5+ bedrooms (%)
Vehicles available in owner-occupied houses - no vehicle available (%)
Vehicles available in owner-occupied houses - 1 vehicle available(%)
Vehicles available in owner-occupied houses - 2 Vehicles available (%)
Vehicles available in owner-occupied houses - 3 Vehicles available (%)
Vehicles available in owner-occupied houses - 4 Vehicles available (%)
Vehicles available in owner-occupied houses - 5+ Vehicles available (%)
Vehicles available in renter-occupied houses - no vehicle available (%)
Vehicles available in renter-occupied houses - 1 vehicle available (%)
Vehicles available in renter-occupied houses - 2 Vehicles available (%)
Vehicles available in renter-occupied houses - 3 Vehicles available (%)
Vehicles available in renter-occupied houses - 4 Vehicles available (%)
Vehicles available in renter-occupied houses - 5+ Vehicles available (%)
Housing units in structures - 1, detached (%)
Housing units in structures - 1, attached (%)
Housing units in structures - 2 (%)
Housing units in structures - 3 or 4 (%)
Housing units in structures - 5 to 9 (%)
Housing units in structures - 10 to 19 (%)
Housing units in structures - 20 to 49 (%)
Housing units in structures - 50 or more (%)
Housing units in structures - Mobile home (%)
Housing units in structures - Boat, RV, van, etc. (%)
Housing units in structures - Owners - 1, detached (%)
Housing units in structures - Owners - 1, attached (%)
Housing units in structures - Owners - 2 (%)
Housing units in structures - Owners - 3 or 4 (%)
Housing units in structures - Owners - 5 to 9 (%)
Housing units in structures - Owners - 10 to 19 (%)
Housing units in structures - Owners - 20 to 49 (%)
Housing units in structures - Owners - 50 or more (%)
Housing units in structures - Owners - Mobile home (%)
Housing units in structures - Owners - Boat, RV, van, etc. (%)
Housing units in structures - Renters - 1, detached (%)
Housing units in structures - Renters - 1, attached (%)
Housing units in structures - Renters - 2 (%)
Housing units in structures - Renters - 3 or 4 (%)
Housing units in structures - Renters - 5 to 9 (%)
Housing units in structures - Renters - 10 to 19 (%)
Housing units in structures - Renters - 20 to 49 (%)
Housing units in structures - Renters - 50 or more (%)
Housing units in structures - Renters - Mobile home (%)
Housing units in structures - Renters - Boat, RV, van, etc. (%)
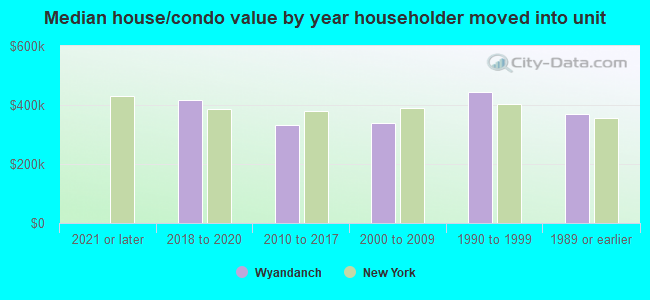
House/condo owner moved in on average (years ago)
Renter moved in on average (years ago)
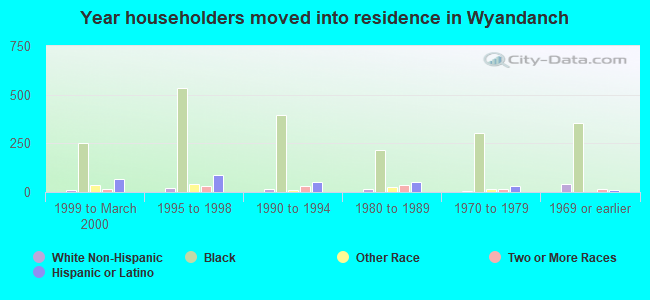
Year householder moved into unit - Moved in 1999 to March 2000 (%)
Year householder moved into unit - Moved in 1999 to March 2000 (%) - White
Year householder moved into unit - Moved in 1999 to March 2000 (%) - Black or African American
Year householder moved into unit - Moved in 1999 to March 2000 (%) - Asian
Year householder moved into unit - Moved in 1999 to March 2000 (%) - Hispanic or Latino
Year householder moved into unit - Moved in 1999 to March 2000 (%) - American Indian and Alaska Native
Year householder moved into unit - Moved in 1999 to March 2000 (%) - Multirace
Year householder moved into unit - Moved in 1999 to March 2000 (%) - Other Race
Year householder moved into unit - Moved in 1995 to 1998 (%)
Year householder moved into unit - Moved in 1995 to 1998 (%) - White
Year householder moved into unit - Moved in 1995 to 1998 (%) - Black or African American
Year householder moved into unit - Moved in 1995 to 1998 (%) - Asian
Year householder moved into unit - Moved in 1995 to 1998 (%) - Hispanic or Latino
Year householder moved into unit - Moved in 1995 to 1998 (%) - American Indian and Alaska Native
Year householder moved into unit - Moved in 1995 to 1998 (%) - Multirace
Year householder moved into unit - Moved in 1995 to 1998 (%) - Other Race
Year householder moved into unit - Moved in 1990 to 1994 (%)
Year householder moved into unit - Moved in 1990 to 1994 (%) - White
Year householder moved into unit - Moved in 1990 to 1994 (%) - Black or African American
Year householder moved into unit - Moved in 1990 to 1994 (%) - Asian
Year householder moved into unit - Moved in 1990 to 1994 (%) - Hispanic or Latino
Year householder moved into unit - Moved in 1990 to 1994 (%) - American Indian and Alaska Native
Year householder moved into unit - Moved in 1990 to 1994 (%) - Multirace
Year householder moved into unit - Moved in 1990 to 1994 (%) - Other Race
Year householder moved into unit - Moved in 1980 to 1989 (%)
Year householder moved into unit - Moved in 1980 to 1989 (%) - White
Year householder moved into unit - Moved in 1980 to 1989 (%) - Black or African American
Year householder moved into unit - Moved in 1980 to 1989 (%) - Asian
Year householder moved into unit - Moved in 1980 to 1989 (%) - Hispanic or Latino
Year householder moved into unit - Moved in 1980 to 1989 (%) - American Indian and Alaska Native
Year householder moved into unit - Moved in 1980 to 1989 (%) - Multirace
Year householder moved into unit - Moved in 1980 to 1989 (%) - Other Race
Year householder moved into unit - Moved in 1970 to 1979 (%)
Year householder moved into unit - Moved in 1970 to 1979 (%) - White
Year householder moved into unit - Moved in 1970 to 1979 (%) - Black or African American
Year householder moved into unit - Moved in 1970 to 1979 (%) - Asian
Year householder moved into unit - Moved in 1970 to 1979 (%) - Hispanic or Latino
Year householder moved into unit - Moved in 1970 to 1979 (%) - American Indian and Alaska Native
Year householder moved into unit - Moved in 1970 to 1979 (%) - Multirace
Year householder moved into unit - Moved in 1970 to 1979 (%) - Other Race
Year householder moved into unit - Moved in 1969 or earlier (%)
Year householder moved into unit - Moved in 1969 or earlier (%) - White
Year householder moved into unit - Moved in 1969 or earlier (%) - Black or African American
Year householder moved into unit - Moved in 1969 or earlier (%) - Asian
Year householder moved into unit - Moved in 1969 or earlier (%) - Hispanic or Latino
Year householder moved into unit - Moved in 1969 or earlier (%) - American Indian and Alaska Native
Year householder moved into unit - Moved in 1969 or earlier (%) - Multirace
Year householder moved into unit - Moved in 1969 or earlier (%) - Other Race
Housing units lacking complete plumbing facilities (%)
Housing units lacking complete kitchen facilities (%)
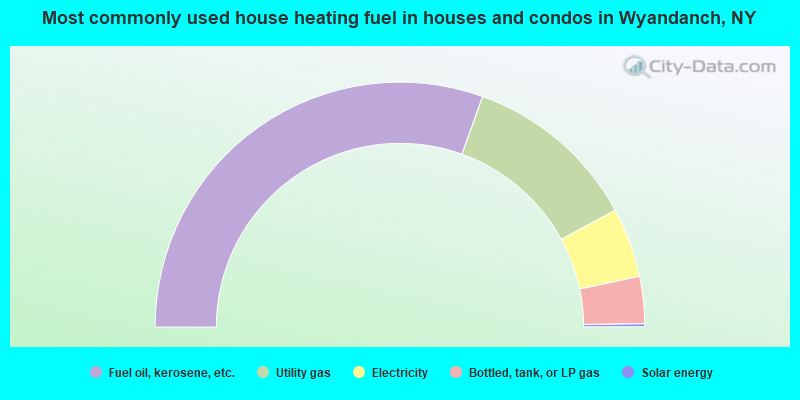
House heating fuel used in houses and condos - Utility gas (%)
House heating fuel used in houses and condos - Bottled, tank, or LP gas (%)
House heating fuel used in houses and condos - Electricity (%)
House heating fuel used in houses and condos - Fuel oil, kerosene, etc. (%)
House heating fuel used in houses and condos - Coal or coke (%)
House heating fuel used in houses and condos - Wood (%)
House heating fuel used in houses and condos - Solar energy (%)
House heating fuel used in houses and condos - Other fuel (%)
House heating fuel used in houses and condos - No fuel used (%)
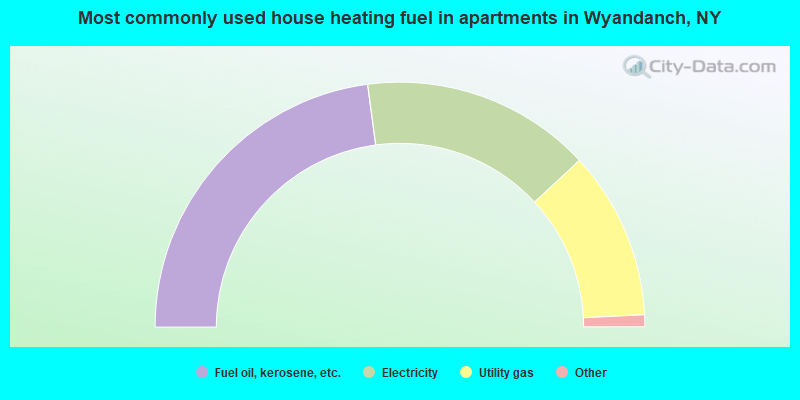
House heating fuel used in apartments - Utility gas (%)
House heating fuel used in apartments - Bottled, tank, or LP gas (%)
House heating fuel used in apartments - Electricity (%)
House heating fuel used in apartments - Fuel oil, kerosene, etc. (%)
House heating fuel used in apartments - Coal or coke (%)
House heating fuel used in apartments - Wood (%)
House heating fuel used in apartments - Solar energy (%)
House heating fuel used in apartments - Other fuel (%)
House heating fuel used in apartments - No fuel used (%)
Latest news about housing in Wyandanch, NY collected exclusively by city-data.com from local newspapers, TV, and radio stations
Apartments rentals along LIRR (Farmingdale, Wyandanch, Huntington) (4 replies)Multi-Family Housing Coming Near You Soon! (504 replies)Are there any parts of LI where you can score a big home for a cheap sticker price like you can in some southern states? (628 replies)Student enrollment on Long Island falls 7% in decade (33 replies)Homes in Bohemia, Oakdale, Sayville, Bayport, Islip, Bay Shore, Patchogue, Bellport, Medford, Mastic, Ridge, Kings Park (12 replies)Wyandanch Street View House Hunting Game (11 replies)
Median year house/condo built: 1977Median year apartment built: 1993Household type by relationship:
Households: 13,609
Male householders: 2,208 (623 living alone ), Female householders: 1,579 (374 living alone )1,125 spouses (1,125 opposite-sex spouses ), 302 unmarried partners , (234 opposite-sex unmarried partners ), 4,774 children (4,369 natural , 287 adopted , 117 stepchildren ), 721 grandchildren , 356 brothers or sisters , 334 parents , 0 foster children , 767 other relatives , 1,390 non-relatives In group quarters: 50
Size of family households: 542 2-persons , 564 3-persons , 459 4-persons , 391 5-persons , 133 6-persons , 393 7-or-more-persons .
Size of nonfamily households: 1,005 1-person , 157 2-persons , 74 3-persons , 41 6-persons .
836 married couples with children. single-parent households (575 men , 1,163 women ).
61.3% of residents of Wyandanch speak English at home. of residents speak Spanish at home (55% speak English very well , 19% speak English well , 23% speak English not well , 4% don't speak English at all ).of residents speak other Indo-European language at home (65% speak English very well , 20% speak English well , 8% speak English not well , 7% don't speak English at all ).of residents speak other language at home (83% speak English very well , 17% speak English well ).
Foreign born population: 3,978 (29.2%)of them are naturalized citizens )
Median number of rooms in houses and condos:
Median number of rooms in apartments
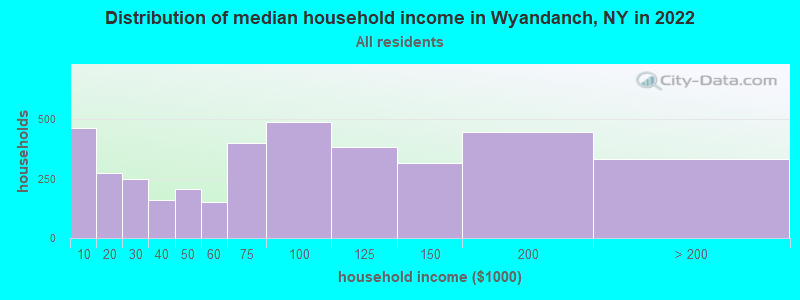
Wyandanch, NY household income distribution 462 Less than $10,000272 $10,000 to $19,999250 $20,000 to $29,999161 $30,000 to $39,999205 $40,000 to $49,999150 $50,000 to $59,999402 $60,000 to $74,999489 $75,000 to $99,999385 $100,000 to $124,999315 $125,000 to $149,999445 $150,000 to $199,999332 $200,000 or more
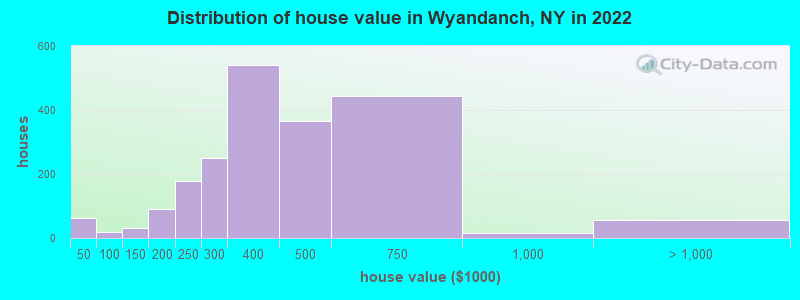
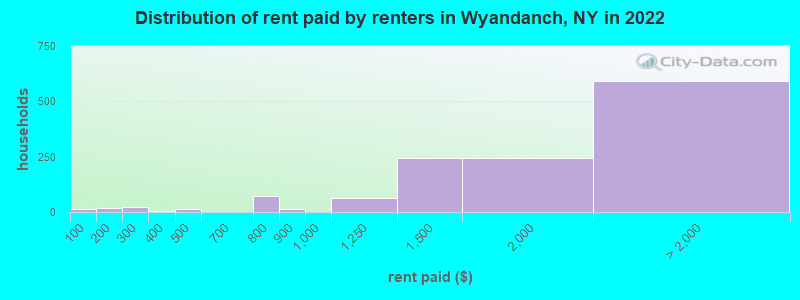
Home value of owner - occupied houses in 2022 in Wyandanch, NY 18 $25,000 to $29,99922 $35,000 to $39,99920 $40,000 to $49,99931 $125,000 to $149,99992 $150,000 to $174,999178 $200,000 to $249,999249 $250,000 to $299,999540 $300,000 to $399,999364 $400,000 to $499,999443 $500,000 to $749,99915 $750,000 to $999,99956 $1,000,000 to $1,499,999Rent paid by renters in 2022 in Wyandanch, NY 14 Less than $10016 $100 to $14920 $250 to $2994 $300 to $34914 $400 to $44970 $750 to $79913 $800 to $89965 $1,000 to $1,249245 $1,250 to $1,499245 $1,500 to $1,999418 $2,000 to $2,49939 $2,500 to $2,99950 $3,000 to $3,49923 $3,500 or more59 No cash rent
Percentage of workers working in this county: 77.2%Number of people working at home: 162 (2.5% of all workers )
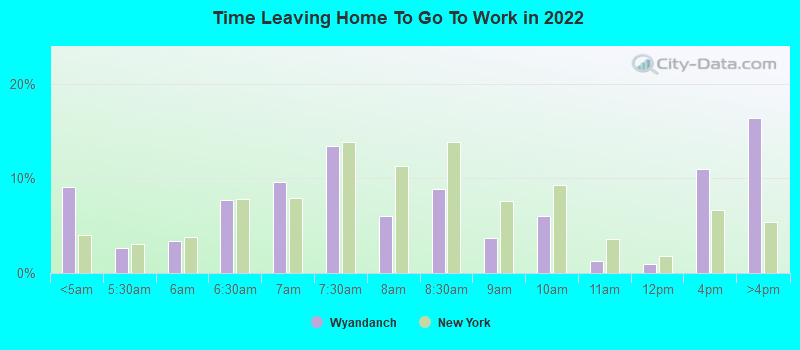
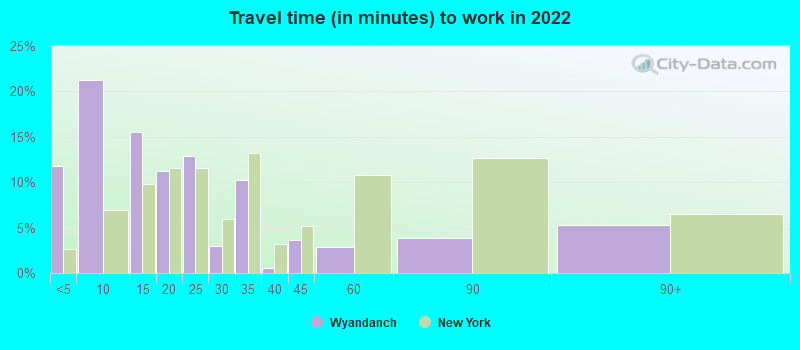
Travel time to work (commute)
Less than 5 minutes: 2375 to 9 minutes: 89410 to 14 minutes: 1,07115 to 19 minutes: 73620 to 24 minutes: 99225 to 29 minutes: 31030 to 34 minutes: 55035 to 39 minutes: 3740 to 44 minutes: 13845 to 59 minutes: 59660 to 89 minutes: 40390 or more minutes: 274
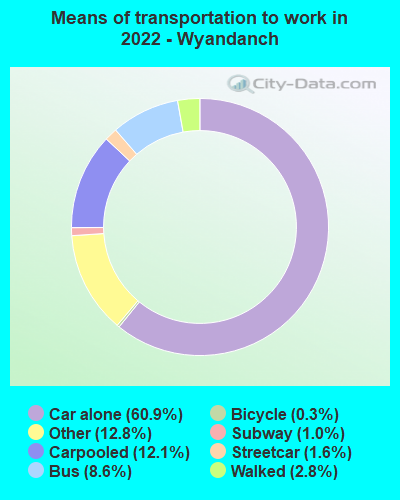
Means of transportation to work:
Drove a car alone: 1,176 (54.2%)Carpooled: 268 (12.4%)Bus : 151 (7.0%)Subway or elevated rail : 33 (1.5%)Long-distance train or commuter rail : 19 (0.9%)Taxi: 307 (14.2%)Bicycle: 3 (0.1%)Walked: 58 (2.7%)Worked at home: 162 (7.5%)
Unemployment by race in 2022
Unemployment rate for Black residents 5.4% Males5.0% FemalesUnemployment rate for two or more race residents 10.6% Males7.5% FemalesUnemployment rate for Hispanic or Latino residents 1.5% Males2.5% Females
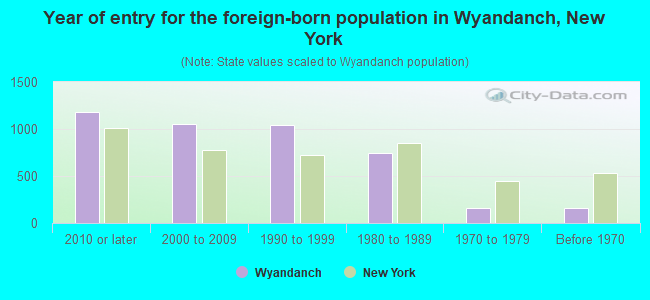
Year of entry for the foreign-born population in Wyandanch, New York
1,185 2010 or later 1,049 2000 to 2009 1,039 1990 to 1999 748 1980 to 1989 164 1970 to 1979 163 Before 1970
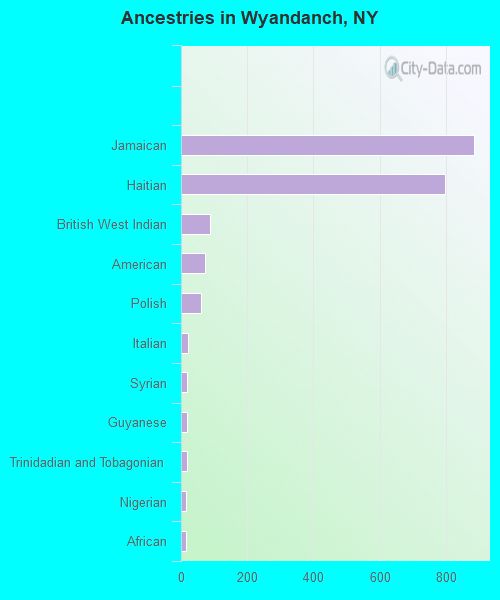
First ancestries reported:
Jamaican: 886 (11.7%)
Haitian: 797 (10.5%)
British West Indian: 87 (1.1%)
American: 72 (0.9%)
Polish: 60 (0.8%)
Italian: 21 (0.3%)
Syrian: 19 (0.3%)
Guyanese: 19 (0.3%)
Trinidadian and Tobagonian: 17 (0.2%)
Nigerian: 15 (0.2%)
African: 15 (0.2%) Most common places of birth for foreign-born residents (%): El Salvador Wyandanch:
28.9% (1,061)New York:
2.4% (108,067)
Haiti Wyandanch:
17.9% (657)New York:
2.8% (126,936)
Jamaica Wyandanch:
16.6% (611)New York:
5.0% (227,557)
Dominican Republic Wyandanch:
11.8% (434)New York:
11.1% (501,040)
Honduras Wyandanch:
4.6% (170)New York:
1.2% (55,571)
Peru Wyandanch:
3.2% (118)New York:
1.2% (54,759)
Guyana Wyandanch:
2.2% (81)New York:
3.8% (172,129)
Trinidad and Tobago Wyandanch:
2.0% (72)New York:
2.0% (91,428)
Other Caribbean Wyandanch:
1.9% (71)New York:
0.4% (18,080)
Poland Wyandanch:
1.7% (61)New York:
1.4% (65,102)
Place of birth for U.S.-born residents:
This state: 7,968Other state: 1,192Northeast: 399Midwest: 127South: 488West: 141 94.8% of Wyandanch residents lived in the same house 1 years ago.
Out of people who lived in different houses, 43.9% lived in this county.
Out of people who lived in different counties, 29.9% lived in New York.
Wyandanch:
94.8%State average:
89.6%
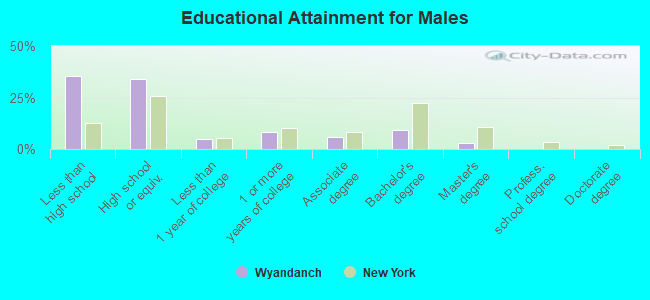
Education attainment for males 25 years and older:
No schooling: 1,035Nursery to 4th grade: 1715th and 6th grade: 07th and 8th grade: 499th grade: 3410th grade: 5911th grade: 2912th grade, no diploma: 273High school graduate (or equivalency): 1,589Less than 1 year of college: 231Some college more than 1 year, no degree: 379Associate degree: 272Bachelor's degree: 434Master's degree: 127Professional school degree: 0Doctorate degree: 0
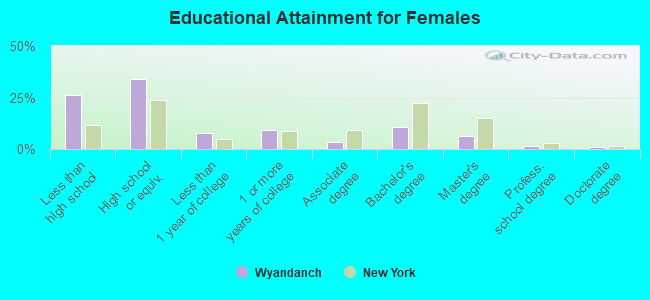
Education attainment for females 25 years and older:
No schooling: 318Nursery to 4th grade: 05th and 6th grade: 637th and 8th grade: 639th grade: 7110th grade: 911th grade: 14812th grade, no diploma: 323High school graduate (or equivalency): 1,295Less than 1 year of college: 303Some college more than 1 year, no degree: 342Associate degree: 136Bachelor's degree: 400Master's degree: 233Professional school degree: 63Doctorate degree: 38
Housing units in structures:
One, detached: 2,933One, attached: 554Two: 1083 or 4: 1010 to 19: 720 to 49: 2350 or more: 233Mobile homes: 202Median worth of mobile homes: $327,995
Housing units lacking complete plumbing facilities in 2022: 2.2%Housing units lacking complete kitchen facilities in 2022: 3.9%House/condo owner moved in on average 24 years ago
Renter moved in on average 7 years ago
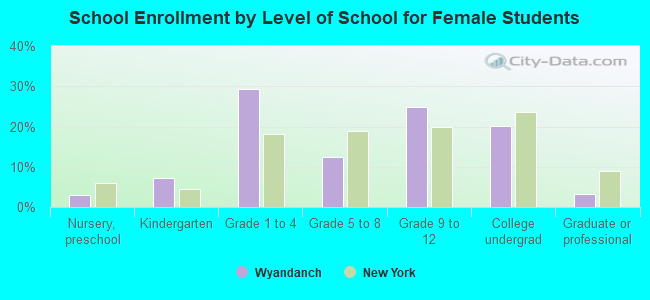
Private vs. public school enrollment:
Students in private schools in grades 1 to 8 (elementary and middle school): 44 Students in private schools in grades 9 to 12 (high school): 24 Students in private undergraduate colleges: 146