Westchester, FL (Florida) Houses and Residents
Estimated median house or condo value in 2022: $516,668 (it was $143,600 in 2000 )
Westchester:
$516,668Florida:
$354,100
Lower value quartile - upper value quartile: $411,184 - $654,944Total population: 29,862 (All urban)
Houses: 18,478 (17,752 occupied: 12,260 owner occupied, 5,728 renter occupied )
% of renters here:
32%State:
33%
Housing density: 4,603 houses/condos per square mile
Median price asked for vacant for-sale houses and condos in 2022: $557,236.
Median contract rent in 2022: $1,548 (lower quartile is $1,306, upper quartile is $1,950)
Median rent asked for vacant for-rent units in 2022: $2,668
Median gross rent in Westchester, FL in 2022: $1,665
Housing units in Westchester with a mortgage: 6,434 (395 second mortgage, 43 home equity loan, 257 both second mortgage and home equity loan )Houses without a mortgage: 143
Median household income for houses/condos with a mortgage: $108,014
Median household income for apartments without a mortgage: $56,502
Median monthly housing costs: $1,540
Data:
Median house or condo value ($)
Median house or condo value ($ change since 2000)
Median house or condo value ($) - White
Median house or condo value ($) - Black or African American
Median house or condo value ($) - Asian
Median house or condo value ($) - Hispanic or Latino
Median house or condo value ($) - American Indian and Alaska Native
Median house or condo value ($) - Multirace
Median house or condo value ($) - Other Race
Median price asked for mobile homes ($)
Household density (households per square mile)
Mean house or condo value by units in structure - 1, detached ($)
Mean house or condo value by units in structure - 1, attached ($)
Mean house or condo value by units in structure - 2 ($)
Mean house or condo value by units in structure by units in structure - 3 or 4 ($)
Mean house or condo value by units in structure - 5 or more ($)
Mean house or condo value by units in structure - Boat, RV, van, etc. ($)
Mean house or condo value by units in structure - Mobile home ($)
Median contract rent ($)
Median contract rent - Lower quartile ($)
Median contract rent - Upper quartile ($)
Median gross rent ($)
Urban houses (%)
Rural houses (%)
Houses occupied (%)
Houses occupied (% change since 2000)
Houses owner occupied (%)
Houses owner occupied (% change since 2000)
Houses renter occupied (%)
Houses renter occupied (% change since 2000)
Vacant housing units - For rent (%)
Vacant housing units - For rent (% change since 2000)
Vacant housing units - For sale only (%)
Vacant housing units - For sale only (% change since 2000)
Vacant housing units - Rented or sold, not occupied (%)
Vacant housing units - Rented or sold, not occupied (% change since 2000)
Vacant housing units - For seasonal, recreational, or occasional use (%)
Vacant housing units - For seasonal, recreational, or occasional use (% change since 2000)
Vacant housing units - For migrant workers (%)
Vacant housing units - For migrant workers (% change since 2000)
Vacant housing units - Other vacant (%)
Vacant housing units - Other vacant (% change since 2000)
Median monthly housing costs ($)
Median household income for houses/condos with a mortgage ($)
Median household income for houses/condos without a mortgage ($)
Median household income ($)
Median household income ($) - White
Median household income ($) - Black or African American
Median household income ($) - Asian
Median household income ($) - Hispanic or Latino
Median household income ($) - American Indian and Alaska Native
Median household income ($) - Multirace
Median household income ($) - Other Race
Mortgage status - with mortgage (%)
Mortgage status - with second mortgage (%)
Mortgage status - with home equity loan (%)
Mortgage status - with both second mortgage and home equity loan (%)
Mortgage status - without a mortgage (%)
Median year house/condo built
Median year apartment built
Household type by relationship - Male householder living alone (%)
Household type by relationship - Male householder not living alone (%)
Household type by relationship - Female householder living alone (%)
Household type by relationship - Female householder not living alone (%)
Household type by relationship - Opposite-Sex spouse (%)
Household type by relationship - Same-Sex spouse (%)
Household type by relationship - Opposite-Sex unmarried partner (%)
Household type by relationship - Same-Sex unmarried partner (%)
Household type by relationship - In group quarters (%)
Size of family households - 2-person household (%)
Size of family households - 3-person household (%)
Size of family households - 4-person household (%)
Size of family households - 5-person household (%)
Size of family households - 6-person household (%)
Size of family households - 7-or-more-person household (%)
Size of nonfamily households - 1-person household (%)
Size of nonfamily households - 2-person household (%)
Size of nonfamily households - 3-person household (%)
Size of nonfamily households - 4-person household (%)
Size of nonfamily households - 5-person household (%)
Size of nonfamily households - 6-person household (%)
Size of nonfamily households - 7-or-moreperson household (%)
Year house built - Built 2010 or later (%)
Year house built - Built 2000 to 2009 (%)
Year house built - Built 1990 to 1999 (%)
Year house built - Built 1980 to 1989 (%)
Year house built - Built 1970 to 1979 (%)
Year house built - Built 1960 to 1969 (%)
Year house built - Built 1950 to 1959 (%)
Year house built - Built 1940 to 1949 (%)
Year house built - Built 1939 or earlier (%)
Median number of rooms in houses and condos
Median number of rooms in apartments
Median number of bedrooms in owner occupied houses
Mean number of bedrooms in owner occupied houses
Median number of bedrooms in renter occupied houses
Mean number of bedrooms in renter occupied houses
Median number of vehichles in owner occupied houses
Mean number of vehichles in owner occupied houses
Median number of vehichles in renter occupied houses
Mean number of vehichles in renter occupied houses
Rooms in owner-occupied houses - 1 room (%)
Rooms in owner-occupied houses - 2 rooms (%)
Rooms in owner-occupied houses - 3 rooms (%)
Rooms in owner-occupied houses - 4 rooms (%)
Rooms in owner-occupied houses - 5 rooms (%)
Rooms in owner-occupied houses - 6 rooms (%)
Rooms in owner-occupied houses - 7 rooms (%)
Rooms in owner-occupied houses - 8 rooms (%)
Rooms in owner-occupied houses - 9+ rooms (%)
Rooms in renter-occupied houses - 1 room (%)
Rooms in renter-occupied houses - 2 rooms (%)
Rooms in renter-occupied houses - 3 rooms (%)
Rooms in renter-occupied houses - 4 rooms (%)
Rooms in renter-occupied houses - 5 rooms (%)
Rooms in renter-occupied houses - 6 rooms (%)
Rooms in renter-occupied houses - 7 rooms (%)
Rooms in renter-occupied houses - 8 rooms (%)
Rooms in renter-occupied houses - 9+ rooms (%)
Bedrooms in owner-occupied houses - no bedrooms (%)
Bedrooms in owner-occupied houses - 1 bedroom (%)
Bedrooms in owner-occupied houses - 2 bedrooms (%)
Bedrooms in owner-occupied houses - 3 bedrooms (%)
Bedrooms in owner-occupied houses - 4 bedrooms (%)
Bedrooms in owner-occupied houses - 5+ bedrooms (%)
Bedrooms in renter-occupied houses - no bedrooms (%)
Bedrooms in renter-occupied houses - 1 bedroom (%)
Bedrooms in renter-occupied houses - 2 bedrooms (%)
Bedrooms in renter-occupied houses - 3 bedrooms (%)
Bedrooms in renter-occupied houses - 4 bedrooms (%)
Bedrooms in renter-occupied houses - 5+ bedrooms (%)
Vehicles available in owner-occupied houses - no vehicle available (%)
Vehicles available in owner-occupied houses - 1 vehicle available(%)
Vehicles available in owner-occupied houses - 2 Vehicles available (%)
Vehicles available in owner-occupied houses - 3 Vehicles available (%)
Vehicles available in owner-occupied houses - 4 Vehicles available (%)
Vehicles available in owner-occupied houses - 5+ Vehicles available (%)
Vehicles available in renter-occupied houses - no vehicle available (%)
Vehicles available in renter-occupied houses - 1 vehicle available (%)
Vehicles available in renter-occupied houses - 2 Vehicles available (%)
Vehicles available in renter-occupied houses - 3 Vehicles available (%)
Vehicles available in renter-occupied houses - 4 Vehicles available (%)
Vehicles available in renter-occupied houses - 5+ Vehicles available (%)
Housing units in structures - 1, detached (%)
Housing units in structures - 1, attached (%)
Housing units in structures - 2 (%)
Housing units in structures - 3 or 4 (%)
Housing units in structures - 5 to 9 (%)
Housing units in structures - 10 to 19 (%)
Housing units in structures - 20 to 49 (%)
Housing units in structures - 50 or more (%)
Housing units in structures - Mobile home (%)
Housing units in structures - Boat, RV, van, etc. (%)
Housing units in structures - Owners - 1, detached (%)
Housing units in structures - Owners - 1, attached (%)
Housing units in structures - Owners - 2 (%)
Housing units in structures - Owners - 3 or 4 (%)
Housing units in structures - Owners - 5 to 9 (%)
Housing units in structures - Owners - 10 to 19 (%)
Housing units in structures - Owners - 20 to 49 (%)
Housing units in structures - Owners - 50 or more (%)
Housing units in structures - Owners - Mobile home (%)
Housing units in structures - Owners - Boat, RV, van, etc. (%)
Housing units in structures - Renters - 1, detached (%)
Housing units in structures - Renters - 1, attached (%)
Housing units in structures - Renters - 2 (%)
Housing units in structures - Renters - 3 or 4 (%)
Housing units in structures - Renters - 5 to 9 (%)
Housing units in structures - Renters - 10 to 19 (%)
Housing units in structures - Renters - 20 to 49 (%)
Housing units in structures - Renters - 50 or more (%)
Housing units in structures - Renters - Mobile home (%)
Housing units in structures - Renters - Boat, RV, van, etc. (%)
House/condo owner moved in on average (years ago)
Renter moved in on average (years ago)
Year householder moved into unit - Moved in 1999 to March 2000 (%)
Year householder moved into unit - Moved in 1999 to March 2000 (%) - White
Year householder moved into unit - Moved in 1999 to March 2000 (%) - Black or African American
Year householder moved into unit - Moved in 1999 to March 2000 (%) - Asian
Year householder moved into unit - Moved in 1999 to March 2000 (%) - Hispanic or Latino
Year householder moved into unit - Moved in 1999 to March 2000 (%) - American Indian and Alaska Native
Year householder moved into unit - Moved in 1999 to March 2000 (%) - Multirace
Year householder moved into unit - Moved in 1999 to March 2000 (%) - Other Race
Year householder moved into unit - Moved in 1995 to 1998 (%)
Year householder moved into unit - Moved in 1995 to 1998 (%) - White
Year householder moved into unit - Moved in 1995 to 1998 (%) - Black or African American
Year householder moved into unit - Moved in 1995 to 1998 (%) - Asian
Year householder moved into unit - Moved in 1995 to 1998 (%) - Hispanic or Latino
Year householder moved into unit - Moved in 1995 to 1998 (%) - American Indian and Alaska Native
Year householder moved into unit - Moved in 1995 to 1998 (%) - Multirace
Year householder moved into unit - Moved in 1995 to 1998 (%) - Other Race
Year householder moved into unit - Moved in 1990 to 1994 (%)
Year householder moved into unit - Moved in 1990 to 1994 (%) - White
Year householder moved into unit - Moved in 1990 to 1994 (%) - Black or African American
Year householder moved into unit - Moved in 1990 to 1994 (%) - Asian
Year householder moved into unit - Moved in 1990 to 1994 (%) - Hispanic or Latino
Year householder moved into unit - Moved in 1990 to 1994 (%) - American Indian and Alaska Native
Year householder moved into unit - Moved in 1990 to 1994 (%) - Multirace
Year householder moved into unit - Moved in 1990 to 1994 (%) - Other Race
Year householder moved into unit - Moved in 1980 to 1989 (%)
Year householder moved into unit - Moved in 1980 to 1989 (%) - White
Year householder moved into unit - Moved in 1980 to 1989 (%) - Black or African American
Year householder moved into unit - Moved in 1980 to 1989 (%) - Asian
Year householder moved into unit - Moved in 1980 to 1989 (%) - Hispanic or Latino
Year householder moved into unit - Moved in 1980 to 1989 (%) - American Indian and Alaska Native
Year householder moved into unit - Moved in 1980 to 1989 (%) - Multirace
Year householder moved into unit - Moved in 1980 to 1989 (%) - Other Race
Year householder moved into unit - Moved in 1970 to 1979 (%)
Year householder moved into unit - Moved in 1970 to 1979 (%) - White
Year householder moved into unit - Moved in 1970 to 1979 (%) - Black or African American
Year householder moved into unit - Moved in 1970 to 1979 (%) - Asian
Year householder moved into unit - Moved in 1970 to 1979 (%) - Hispanic or Latino
Year householder moved into unit - Moved in 1970 to 1979 (%) - American Indian and Alaska Native
Year householder moved into unit - Moved in 1970 to 1979 (%) - Multirace
Year householder moved into unit - Moved in 1970 to 1979 (%) - Other Race
Year householder moved into unit - Moved in 1969 or earlier (%)
Year householder moved into unit - Moved in 1969 or earlier (%) - White
Year householder moved into unit - Moved in 1969 or earlier (%) - Black or African American
Year householder moved into unit - Moved in 1969 or earlier (%) - Asian
Year householder moved into unit - Moved in 1969 or earlier (%) - Hispanic or Latino
Year householder moved into unit - Moved in 1969 or earlier (%) - American Indian and Alaska Native
Year householder moved into unit - Moved in 1969 or earlier (%) - Multirace
Year householder moved into unit - Moved in 1969 or earlier (%) - Other Race
Housing units lacking complete plumbing facilities (%)
Housing units lacking complete kitchen facilities (%)
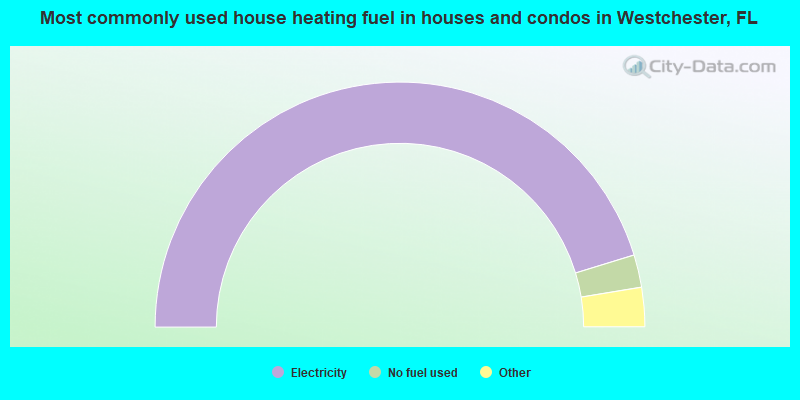
House heating fuel used in houses and condos - Utility gas (%)
House heating fuel used in houses and condos - Bottled, tank, or LP gas (%)
House heating fuel used in houses and condos - Electricity (%)
House heating fuel used in houses and condos - Fuel oil, kerosene, etc. (%)
House heating fuel used in houses and condos - Coal or coke (%)
House heating fuel used in houses and condos - Wood (%)
House heating fuel used in houses and condos - Solar energy (%)
House heating fuel used in houses and condos - Other fuel (%)
House heating fuel used in houses and condos - No fuel used (%)
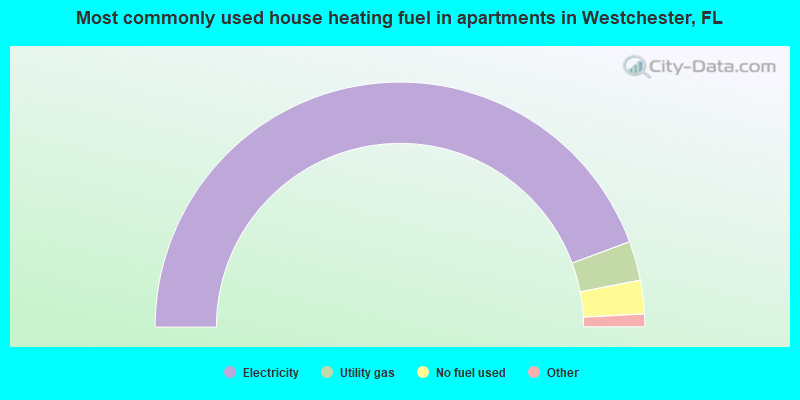
House heating fuel used in apartments - Utility gas (%)
House heating fuel used in apartments - Bottled, tank, or LP gas (%)
House heating fuel used in apartments - Electricity (%)
House heating fuel used in apartments - Fuel oil, kerosene, etc. (%)
House heating fuel used in apartments - Coal or coke (%)
House heating fuel used in apartments - Wood (%)
House heating fuel used in apartments - Solar energy (%)
House heating fuel used in apartments - Other fuel (%)
House heating fuel used in apartments - No fuel used (%)
Latest news about housing in Westchester, FL collected exclusively by city-data.com from local newspapers, TV, and radio stations
Median year house/condo built: 1970Median year apartment built: 1974Household type by relationship:
Households: 53,476
Male householders: 7,964 (1,173 living alone ), Female householders: 9,367 (2,251 living alone )8,480 spouses (8,454 opposite-sex spouses ), 1,066 unmarried partners , (981 opposite-sex unmarried partners ), 13,225 children (12,468 natural , 102 adopted , 654 stepchildren ), 1,191 grandchildren , 887 brothers or sisters , 2,599 parents , 0 foster children , 2,964 other relatives , 1,797 non-relatives In group quarters: 3,933
Size of family households: 5,016 2-persons , 3,739 3-persons , 2,521 4-persons , 1,390 5-persons , 414 6-persons , 230 7-or-more-persons .
Size of nonfamily households: 3,671 1-person , 746 2-persons , 53 3-persons , 67 4-persons , 5 5-persons , 14 6-persons .
3,944 married couples with children. single-parent households (583 men , 1,356 women ).
12.7% of residents of Westchester speak English at home. of residents speak Spanish at home (51% speak English very well , 20% speak English well , 18% speak English not well , 11% don't speak English at all ).of residents speak other Indo-European language at home (93% speak English very well , 5% speak English well , 1% speak English not well ).of residents speak Asian or Pacific Island language at home (31% speak English very well , 35% speak English well , 34% speak English not well ).of residents speak other language at home (90% speak English very well , 10% speak English not well ).
Foreign born population: 33,284 (62.2%)of them are naturalized citizens )
Median number of rooms in houses and condos:
Median number of rooms in apartments
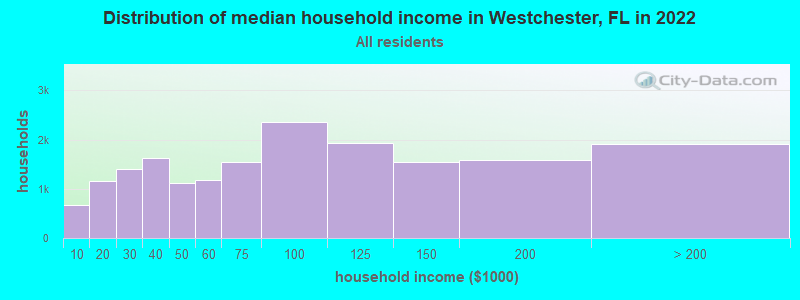
Westchester, FL household income distribution 673 Less than $10,0001,165 $10,000 to $19,9991,404 $20,000 to $29,9991,632 $30,000 to $39,9991,108 $40,000 to $49,9991,182 $50,000 to $59,9991,544 $60,000 to $74,9992,357 $75,000 to $99,9991,938 $100,000 to $124,9991,536 $125,000 to $149,9991,579 $150,000 to $199,9991,902 $200,000 or more
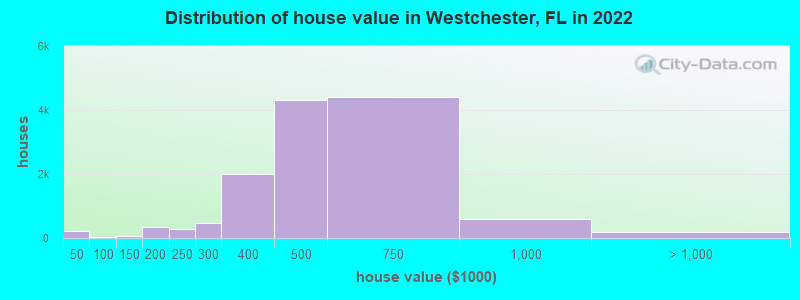
Home value of owner - occupied houses in 2022 in Westchester, FL 80 Less than $10,0007 $20,000 to $24,999145 $30,000 to $34,99919 $50,000 to $59,99910 $80,000 to $89,99949 $100,000 to $124,99921 $125,000 to $149,999273 $150,000 to $174,99981 $175,000 to $199,999273 $200,000 to $249,999468 $250,000 to $299,9991,986 $300,000 to $399,9994,297 $400,000 to $499,9994,399 $500,000 to $749,999578 $750,000 to $999,999181 $1,000,000 to $1,499,9998 $2,000,000 or moreRent paid by renters in 2022 in Westchester, FL 35 Less than $10015 $100 to $149112 $200 to $24952 $250 to $29959 $300 to $34941 $500 to $54921 $650 to $69936 $700 to $7499 $750 to $79987 $800 to $89996 $900 to $999649 $1,000 to $1,2491,437 $1,250 to $1,4991,712 $1,500 to $1,999690 $2,000 to $2,499281 $2,500 to $2,99990 $3,000 to $3,499245 No cash rent
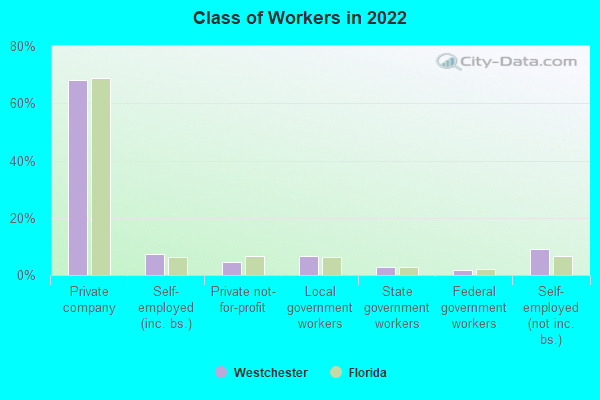
Percentage of workers working in this county: 96.3%Number of people working at home: 2,767 (10.0% of all workers )
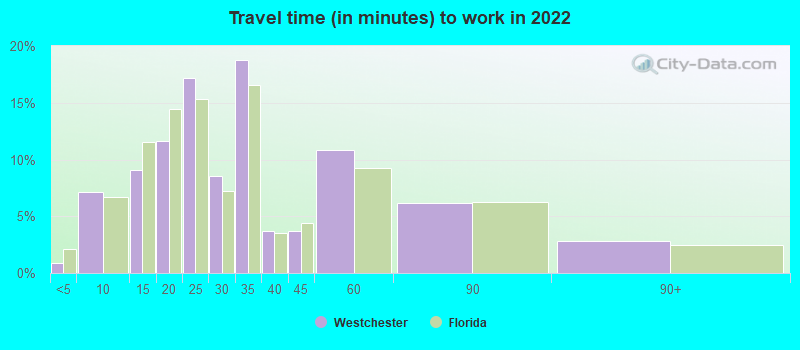
Travel time to work (commute)
Less than 5 minutes: 3225 to 9 minutes: 1,49510 to 14 minutes: 1,88215 to 19 minutes: 2,91620 to 24 minutes: 4,16325 to 29 minutes: 1,32030 to 34 minutes: 5,39735 to 39 minutes: 84640 to 44 minutes: 1,15445 to 59 minutes: 2,91960 to 89 minutes: 1,40890 or more minutes: 505
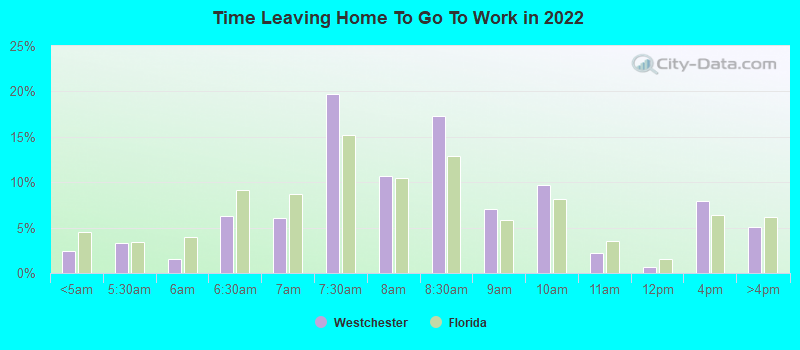
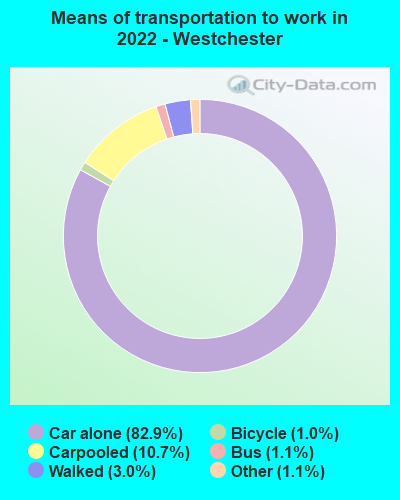
Means of transportation to work:
Drove a car alone: 14,974 (69.9%)Carpooled: 2,173 (10.2%)Bus : 191 (0.9%)Subway or elevated rail : 21 (0.1%)Light rail, streetcar or trolley : 10 (0.0%)Taxi: 258 (1.2%)Bicycle: 237 (1.1%)Walked: 621 (2.9%)Worked at home: 2,767 (12.9%)
Unemployment by race in 2022
Unemployment rate for White non-Hispanic residents 5.4% Males4.3% FemalesUnemployment rate for Black residents 16.0% Males8.5% FemalesUnemployment rate for Asian residents 7.3% FemalesUnemployment rate for other race residents 3.3% Males1.2% FemalesUnemployment rate for two or more race residents 3.3% Males2.3% FemalesUnemployment rate for Hispanic or Latino residents 3.0% Males2.9% Females
Year of entry for the foreign-born population in Westchester, Florida
10,898 2010 or later 6,602 2000 to 2009 3,813 1990 to 1999 4,446 1980 to 1989 2,482 1970 to 1979 8,273 Before 1970
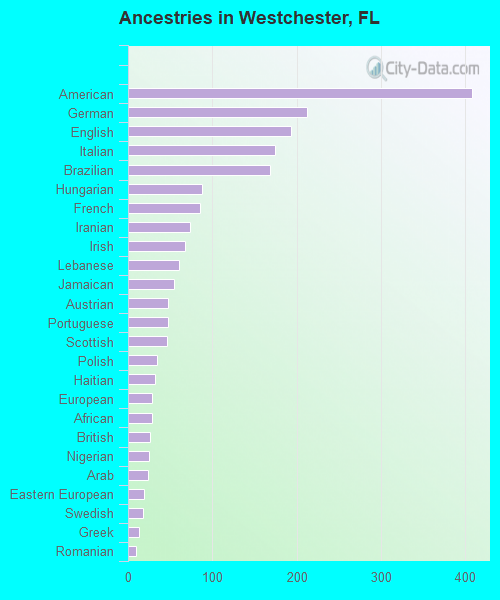
First ancestries reported:
American: 408 (1.1%)
German: 213 (0.6%)
English: 194 (0.5%)
Italian: 175 (0.5%)
Brazilian: 169 (0.5%)
Hungarian: 88 (0.2%)
French: 86 (0.2%)
Iranian: 74 (0.2%)
Irish: 68 (0.2%)
Lebanese: 61 (0.2%)
Jamaican: 54 (0.1%)
Austrian: 48 (0.1%)
Portuguese: 47 (0.1%)
Scottish: 46 (0.1%)
Polish: 34 (0.09%)
Haitian: 32 (0.09%)
European: 28 (0.08%)
African: 28 (0.08%)
British: 26 (0.07%)
Nigerian: 25 (0.07%)
Arab: 24 (0.06%)
Eastern European: 19 (0.05%)
Swedish: 18 (0.05%)
Greek: 13 (0.04%)
Romanian: 10 (0.03%)
Scotch-Irish: 9 (0.02%)
Russian: 7 (0.02%)
Bahamian: 3 (0.01%)
Dutch: 2 (0.01%) Most common places of birth for foreign-born residents (%): Cuba Westchester:
74.0% (24,624)Florida:
22.0% (1,006,576)
Venezuela Westchester:
3.9% (1,306)Florida:
5.7% (262,042)
Colombia Westchester:
2.6% (870)Florida:
6.5% (298,669)
Nicaragua Westchester:
2.3% (775)Florida:
2.3% (105,066)
Peru Westchester:
2.2% (723)Florida:
2.1% (96,693)
Mexico Westchester:
1.9% (622)Florida:
5.6% (257,152)
Place of birth for U.S.-born residents:
This state: 14,422Other state: 4,464Northeast: 2,334Midwest: 751South: 884West: 508 89.1% of Westchester residents lived in the same house 1 years ago.
Out of people who lived in different houses, 37.9% lived in this county.
Out of people who lived in different counties, 60.1% lived in Florida.
Westchester:
89.1%State average:
86.3%
Education attainment for males 25 years and older:
No schooling: 668Nursery to 4th grade: 955th and 6th grade: 3437th and 8th grade: 1379th grade: 33710th grade: 9011th grade: 13912th grade, no diploma: 1,321High school graduate (or equivalency): 5,809Less than 1 year of college: 737Some college more than 1 year, no degree: 1,478Associate degree: 1,700Bachelor's degree: 3,448Master's degree: 1,291Professional school degree: 491Doctorate degree: 356
Education attainment for females 25 years and older:
No schooling: 583Nursery to 4th grade: 1515th and 6th grade: 4097th and 8th grade: 2169th grade: 25010th grade: 19911th grade: 6512th grade, no diploma: 1,602High school graduate (or equivalency): 5,176Less than 1 year of college: 937Some college more than 1 year, no degree: 1,659Associate degree: 2,842Bachelor's degree: 4,223Master's degree: 1,634Professional school degree: 482Doctorate degree: 302
Housing units in structures:
One, detached: 12,324One, attached: 1,663Two: 6423 or 4: 915 to 9: 20910 to 19: 1,02920 to 49: 1,31650 or more: 1,022Mobile homes: 172Boats, RVs, vans, etc.: 5Housing units lacking complete plumbing facilities in 2022: 1.2%Housing units lacking complete kitchen facilities in 2022: 0.6%House/condo owner moved in on average 19 years ago
Renter moved in on average 3 years ago
Private vs. public school enrollment:
Students in private schools in grades 1 to 8 (elementary and middle school): 422 Students in private schools in grades 9 to 12 (high school): 212 Students in private undergraduate colleges: 1,700