West Yarmouth, MA (Massachusetts) Houses and Residents
| West Yarmouth: | $506,161 |
| Massachusetts: | $534,700 |
Mean price in 2022:
Detached houses: $666,462
Here: $666,462 State: $651,570 Townhouses or other attached units: $298,627
Here: $298,627 State: $617,749 In 3-to-4-unit structures: $494,354
Here: $494,354 State: $601,912 In 5-or-more-unit structures: $256,473
Here: $256,473 State: $555,768
Total population: 6,012 (All urban)
Houses: 5,088 (2,821 occupied: 2,259 owner occupied, 746 renter occupied)
| % of renters here: | 25% |
| State: | 38% |
Housing density: 759 houses/condos per square mile
Median price asked for vacant for-sale houses and condos in 2022: $452,031.
Median contract rent in 2022: $1,387 (lower quartile is $892, upper quartile is $1,877)
Median rent asked for vacant for-rent units in 2022: $9,129
Median gross rent in West Yarmouth, MA in 2022: $1,584
Housing units in West Yarmouth with a mortgage: 1,267 (154 second mortgage, 0 home equity loan, 107 both second mortgage and home equity loan)
Houses without a mortgage: 39
Median household income for houses/condos with a mortgage: $95,015
Median household income for apartments without a mortgage: $43,701
Median monthly housing costs: $1,435
Compare current foreclosures near West Yarmouth, MA:
| Photo | Address | Area | Beds / Baths | Price | Details |
|---|---|---|---|---|---|

|
#1
New Hampshire Ave
West Yarmouth, MA 02673
|
5,234 sq. feet
|
10 baths 9 beds |
show details | |

|
#2
Orchid Ln
West Yarmouth, MA 02673
|
888 sq. feet
|
1 baths 2 beds |
show details | |

|
#3
Lake Rd E
West Yarmouth, MA 02673
|
1,048 sq. feet
|
1 baths 2 beds |
show details | |

|
#4
Forest Rd
West Yarmouth, MA 02673
|
1,200 sq. feet
|
1 baths 3 beds |
show details | |

|
#5
Vacation Ln
West Yarmouth, MA 02673
|
1,288 sq. feet
|
1 baths 3 beds |
show details | |

|
#6
Trowbridge Path
West Yarmouth, MA 02673
|
1,200 sq. feet
|
2 baths 3 beds |
show details | |

|
#7
Canvasback Ln
West Yarmouth, MA 02673
|
1,462 sq. feet
|
2 baths 3 beds |
show details | |

|
#8
Chickadee Ln
West Yarmouth, MA 02673
|
1,526 sq. feet
|
2 baths 2 beds |
show details | |

|
#9
Joshua Baker Rd
West Yarmouth, MA 02673
|
1,230 sq. feet
|
1 baths 3 beds |
show details | |

|
#10
Highland St
West Yarmouth, MA 02673
|
1,740 sq. feet
|
2 baths 3 beds |
show details |
| Photo | Address | Area | Beds / Baths | Price | Details |
|---|---|---|---|---|---|

|
#11
Camp St
West Yarmouth, MA 02673
|
832 sq. feet
|
1 baths 2 beds |
show details | |

|
#12
Circuit Rd N
West Yarmouth, MA 02673
|
832 sq. feet
|
1 baths 2 beds |
show details | |

|
#13
Lumberjack Trl
West Yarmouth, MA 02673
|
1,287 sq. feet
|
2 baths 3 beds |
show details | |

|
#14
Grant Rd
West Yarmouth, MA 02673
|
1,468 sq. feet
|
1 baths 3 beds |
show details | |

|
#15
Chamberlain Ct
West Yarmouth, MA 02673
|
944 sq. feet
|
- baths - beds |
show details | |

|
#16
Orchard Ln
West Yarmouth, MA 02673
|
- sq. feet
|
- baths - beds |
show details | |

|
#17
Appleby Rd
West Yarmouth, MA 02673
|
- sq. feet
|
- baths - beds |
show details | |

|
#18
Sullivan Rd
West Yarmouth, MA 02673
|
- sq. feet
|
- baths - beds |
show details | |

|
#19
Buck Island Rd Apt
West Yarmouth, MA 02673
|
- sq. feet
|
- baths - beds |
show details | |

|
#20
Alison Ln
West Yarmouth, MA 02673
|
- sq. feet
|
- baths - beds |
show details |
| Photo | Address | Area | Beds / Baths | Price | Details |
|---|---|---|---|---|---|

|
#21
Lake Rd W
West Yarmouth, MA 02673
|
- sq. feet
|
- baths - beds |
show details | |

|
#22
Main St
Barnstable, MA 02630
|
1,686 sq. feet
|
3 baths 3 beds |
show details | |

|
#23
Alexander Booker Rd
East Falmouth, MA 02536
|
1,152 sq. feet
|
1 baths 2 beds |
show details | |

|
#24
Plum Hollow Rd
East Falmouth, MA 02536
|
1,531 sq. feet
|
2 baths 3 beds |
show details | |

|
#25
Old Sailors Way
South Dennis, MA 02660
|
1,963 sq. feet
|
2 baths 4 beds |
show details | |

|
#26
Viking Dr
South Dennis, MA 02660
|
1,951 sq. feet
|
2 baths 4 beds |
show details | |

|
#27
Quaker Meeting House Rd
East Sandwich, MA 02537
|
2,924 sq. feet
|
3 baths 4 beds |
show details | |

|
#28
Samoset Rd
Mashpee, MA 02649
|
2,332 sq. feet
|
3 baths 4 beds |
show details | |

|
#29
Lower County Rd
Dennis Port, MA 02639
|
2,519 sq. feet
|
5 baths 3 beds |
show details | |

|
#30
Old Stage Rd
Centerville, MA 02632
|
1,344 sq. feet
|
2 baths 3 beds |
show details |
| Photo | Address | Area | Beds / Baths | Price | Details |
|---|---|---|---|---|---|

|
#31
Bay St
Osterville, MA 02655
|
3,128 sq. feet
|
3 baths 4 beds |
show details | |

|
#32
Dana Rd
Forestdale, MA 02644
|
1,692 sq. feet
|
3 baths 3 beds |
show details | |

|
#33
Jasper Moore Trl
Harwich, MA 02645
|
1,666 sq. feet
|
3 baths 3 beds |
show details | |

|
#34
Bradford Rd
South Dennis, MA 02660
|
1,758 sq. feet
|
2 baths 3 beds |
show details | |

|
#35
Artisan Way
Forestdale, MA 02644
|
1,056 sq. feet
|
1 baths 3 beds |
show details | |

|
#36
Pleasant Bay Ct
Harwich, MA 02645
|
2,341 sq. feet
|
3 baths 3 beds |
show details | |

|
#37
Willimantic Dr
Marstons Mills, MA 02648
|
1,267 sq. feet
|
2 baths 3 beds |
show details | |

|
#38
Main St
West Barnstable, MA 02668
|
2,003 sq. feet
|
2 baths 4 beds |
show details | |

|
#39
Wolf Hill Rd
East Sandwich, MA 02537
|
3,150 sq. feet
|
3 baths 4 beds |
show details | |

|
#40
Main St
Brewster, MA 02631
|
1,881 sq. feet
|
2 baths 5 beds |
show details |
| Photo | Address | Area | Beds / Baths | Price | Details |
|---|---|---|---|---|---|

|
#41
Fish House Rd
East Sandwich, MA 02537
|
2,900 sq. feet
|
3 baths 4 beds |
show details | |

|
#42
Riverview Ave # D
Mashpee, MA 02649
|
1,507 sq. feet
|
2 baths 3 beds |
show details | |

|
#43
Lincoln Road Ext
Hyannis, MA 02601
|
864 sq. feet
|
1 baths 2 beds |
show details | |

|
#44
Quaker Run Rd
Mashpee, MA 02649
|
3,010 sq. feet
|
3 baths 4 beds |
show details | |

|
#45
Scituate Rd
Mashpee, MA 02649
|
960 sq. feet
|
1 baths 2 beds |
show details | |

|
#46
Edgewater Dr E
East Falmouth, MA 02536
|
4,295 sq. feet
|
5 baths 3 beds |
show details | |

|
#47
Bittersweet Ln
South Dennis, MA 02660
|
2,184 sq. feet
|
2 baths 3 beds |
show details | |

|
#48
Edgewater Dr E
East Falmouth, MA 02536
|
884 sq. feet
|
1 baths 3 beds |
show details | |

|
#49
Wagon Ln
Hyannis, MA 02601
|
1,308 sq. feet
|
2 baths 3 beds |
show details | |

|
Check over 1 million property listings on Foreclosure.com!
|
browse all offers | |||


 | Shooting in Broad Daylight Main Street Hyannis (36 replies) |
| Why are houses so inexpensive in Hyannis? (35 replies) |
| What is West Yarmouth Like? (10 replies) |
| Winter House Cleaning on Cape Cod? (1 reply) |
| Need advice about moving to CAPE COD or SOUTH SHORE area (18 replies) |
| Centerville, Osterville, Barnstable info please... CAPE COD or NOT (7 replies) |

Median year apartment built: 1970
Household type by relationship:
Households: 6,178- Male householders: 1,070 (357 living alone), Female householders: 1,768 (772 living alone)
1,135 spouses (1,129 opposite-sex spouses), 124 unmarried partners, (106 opposite-sex unmarried partners), 1,631 children (1,516 natural, 28 adopted, 86 stepchildren), 25 grandchildren, 85 brothers or sisters, 43 parents, 0 foster children, 37 other relatives, 160 non-relatives
- In group quarters: 95
Size of family households: 821 2-persons, 423 3-persons, 229 4-persons, 118 5-persons, 32 6-persons, 10 7-or-more-persons.
Size of nonfamily households: 1,209 1-person, 100 2-persons, 29 3-persons.
720 married couples with children.
337 single-parent households (81 men, 256 women).
81.3% of residents of West Yarmouth speak English at home.
3.0% of residents speak Spanish at home (90% speak English very well, 6% speak English well, 4% speak English not well).
14.9% of residents speak other Indo-European language at home (71% speak English very well, 17% speak English well, 9% speak English not well, 3% don't speak English at all).
0.6% of residents speak Asian or Pacific Island language at home (61% speak English very well, 39% speak English well).
0.7% of residents speak other language at home (100% speak English very well).
Foreign born population: 1,052 (17.0%)
(45.1% of them are naturalized citizens)
| Here: | 5.6 |
| State: | 6.5 |
| Here: | 4.3 |
| State: | 4.0 |

- Bedrooms in owner-occupied houses and condos in West Yarmouth, Massachusetts
- 11no bedroom
- 541 bedroom
- 8552 bedrooms
- 9773 bedrooms
- 2874 bedrooms
- 765+ bedrooms

- Bedrooms in renter-occupied apartments in West Yarmouth, Massachusetts
- 31no bedroom
- 1721 bedroom
- 3392 bedrooms
- 2053 bedrooms
- 04 bedrooms
- 05+ bedrooms

- Cars and other vehicles available in West Yarmouth in owner-occupied houses/condos
- 36no vehicle
- 6951 vehicle
- 9782 vehicles
- 4703 vehicles
- 804 vehicles
- 05+ vehicles

- Cars and other vehicles available in West Yarmouth in renter-occupied apartments
- 145no vehicle
- 4271 vehicle
- 1082 vehicles
- 663 vehicles
- 04 vehicles
- 05+ vehicles

- Rooms in owner-occupied houses in West Yarmouth, Massachusetts
- 111 room
- 02 rooms
- 03 rooms
- 6384 rooms
- 4455 rooms
- 3986 rooms
- 4027 rooms
- 1778 rooms
- 1899+ rooms

- Rooms in renter-occupied apartments in West Yarmouth, Massachusetts
- 311 room
- 422 rooms
- 1423 rooms
- 2084 rooms
- 2435 rooms
- 426 rooms
- 07 rooms
- 398 rooms
- 09+ rooms


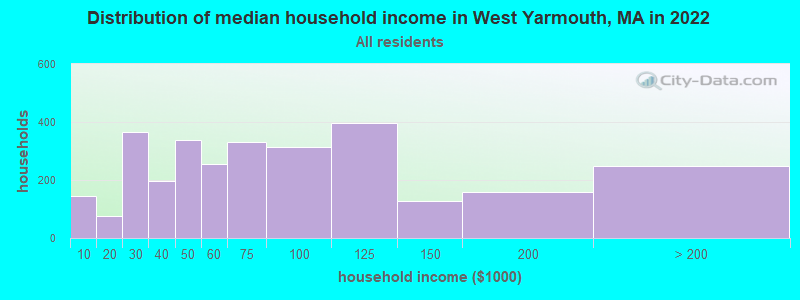
West Yarmouth, MA household income distribution

- 144Less than $10,000
- 75$10,000 to $19,999
- 367$20,000 to $29,999
- 197$30,000 to $39,999
- 338$40,000 to $49,999
- 256$50,000 to $59,999
- 332$60,000 to $74,999
- 314$75,000 to $99,999
- 396$100,000 to $124,999
- 128$125,000 to $149,999
- 160$150,000 to $199,999
- 249$200,000 or more
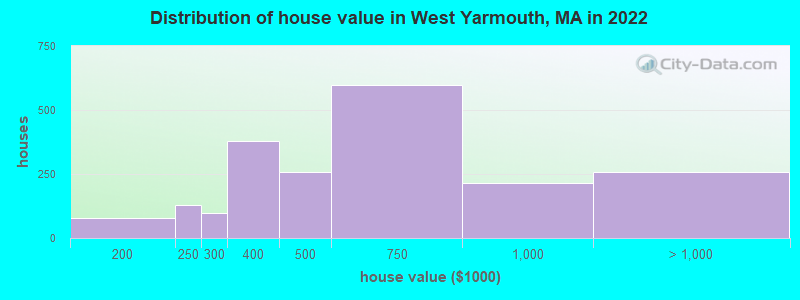
Home value of owner - occupied houses in 2022 in West Yarmouth, MA
-
- 22$150,000 to $174,999
- 55$175,000 to $199,999
- 126$200,000 to $249,999
- 96$250,000 to $299,999
- 378$300,000 to $399,999
- 256$400,000 to $499,999
- 596$500,000 to $749,999
- 215$750,000 to $999,999
- 104$1,000,000 to $1,499,999
- 48$1,500,000 to $1,999,999
- 106$2,000,000 or more
Rent paid by renters in 2022 in West Yarmouth, MA
-
- 47Less than $100
- 35$250 to $299
- 16$450 to $499
- 8$750 to $799
- 45$800 to $899
- 14$900 to $999
- 88$1,000 to $1,249
- 87$1,250 to $1,499
- 79$1,500 to $1,999
- 74$2,000 to $2,499
- 110$3,500 or more
- 68No cash rent


Percentage of workers working in this county: 87.8%
Number of people working at home: 47 (1.8% of all workers)
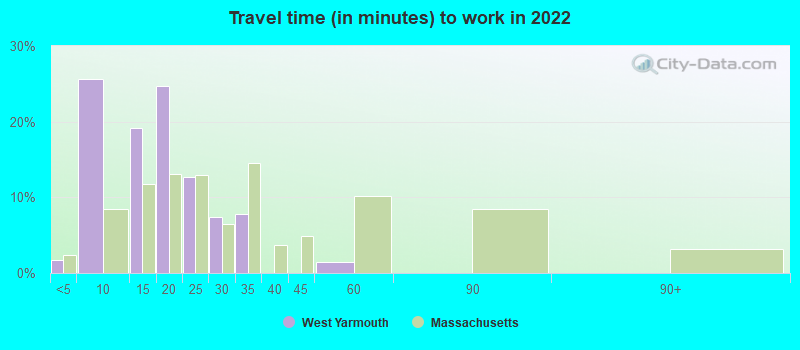
Travel time to work (commute)
- Less than 5 minutes: 37
- 5 to 9 minutes: 382
- 10 to 14 minutes: 471
- 15 to 19 minutes: 565
- 20 to 24 minutes: 415
- 25 to 29 minutes: 51
- 30 to 34 minutes: 309
- 35 to 39 minutes: 40
- 40 to 44 minutes: 10
- 45 to 59 minutes: 29
- 60 to 89 minutes: 123
- 90 or more minutes: 34
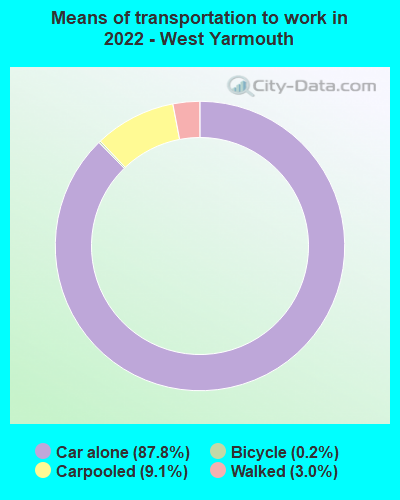
Means of transportation to work:
- Drove a car alone: 1,032 (82.6%)
- Carpooled: 105 (8.4%)
- Bicycle: 2 (0.2%)
- Walked: 25 (2.0%)
- Worked at home: 47 (3.8%)

- Unemployment by race in 2022
- Unemployment rate for White non-Hispanic residents
- 4.5%Males
- 6.1%Females
- Unemployment rate for Black residents
- 13.9%Males
- Unemployment rate for Asian residents
- 13.0%Females
- Unemployment rate for Hispanic or Latino residents
- 25.3%Females

- Year of entry for the foreign-born population in West Yarmouth, Massachusetts
- 3822010 or later
- 3122000 to 2009
- 2621990 to 1999
- 571980 to 1989
- 81970 to 1979
- 155Before 1970

First ancestries reported:
- Irish: 734 (24.5%)
- Italian: 374 (12.5%)
- Brazilian: 326 (10.9%)
- English: 178 (5.9%)
- Haitian: 144 (4.8%)
- American: 121 (4.0%)
- Jamaican: 69 (2.3%)
- Polish: 45 (1.5%)
- French: 40 (1.3%)
- Russian: 33 (1.1%)
- Scottish: 32 (1.1%)
- Scotch-Irish: 30 (1.0%)
- German: 29 (1.0%)
- Swedish: 25 (0.8%)
- Czechoslovakian: 20 (0.7%)
- French Canadian: 20 (0.7%)
- Lithuanian: 18 (0.6%)
- Dutch: 15 (0.5%)
- European: 15 (0.5%)
- Canadian: 13 (0.4%)
- Czech: 13 (0.4%)
- Celtic: 10 (0.3%)
- Eastern European: 10 (0.3%)
- Armenian: 9 (0.3%)
- Portuguese: 9 (0.3%)
- Slovak: 6 (0.2%)
- Slavic: 5 (0.2%)
- Welsh: 3 (0.1%)
Most common places of birth for foreign-born residents (%):
| West Yarmouth: | 27.9% (311) |
| Massachusetts: | 7.6% (92,959) |
| West Yarmouth: | 13.4% (149) |
| Massachusetts: | 4.9% (60,432) |
| West Yarmouth: | 7.6% (85) |
| Massachusetts: | 6.8% (82,934) |
| West Yarmouth: | 7.4% (82) |
| Massachusetts: | 1.1% (13,446) |
| West Yarmouth: | 5.6% (62) |
| Massachusetts: | 1.7% (21,468) |
| West Yarmouth: | 5.3% (59) |
| Massachusetts: | 0.4% (5,265) |
| West Yarmouth: | 4.0% (44) |
| Massachusetts: | 0.3% (3,270) |
| West Yarmouth: | 3.8% (42) |
| Massachusetts: | 0.2% (2,809) |
| West Yarmouth: | 3.5% (39) |
| Massachusetts: | 1.4% (16,886) |
| West Yarmouth: | 3.0% (33) |
| Massachusetts: | 1.5% (18,278) |
| West Yarmouth: | 2.7% (30) |
| Massachusetts: | 1.0% (11,727) |
| West Yarmouth: | 2.1% (23) |
| Massachusetts: | 1.0% (12,709) |
| West Yarmouth: | 2.1% (23) |
| Massachusetts: | 0.1% (1,036) |
Place of birth for U.S.-born residents:
- This state: 3,926
- Other state: 1,159
- Northeast: 690
- Midwest: 109
- South: 73
- West: 256
89.8% of West Yarmouth residents lived in the same house 1 years ago.
Out of people who lived in different houses, 35.9% lived in this county.
Out of people who lived in different counties, 76.2% lived in Massachusetts.
| West Yarmouth: | 89.8% |
| State average: | 87.7% |
Education attainment for males 25 years and older:
- No schooling: 129
- Nursery to 4th grade: 0
- 5th and 6th grade: 24
- 7th and 8th grade: 26
- 9th grade: 0
- 10th grade: 0
- 11th grade: 11
- 12th grade, no diploma: 74
- High school graduate (or equivalency): 507
- Less than 1 year of college: 116
- Some college more than 1 year, no degree: 358
- Associate degree: 169
- Bachelor's degree: 556
- Master's degree: 163
- Professional school degree: 32
- Doctorate degree: 30

Education attainment for females 25 years and older:
- No schooling: 0
- Nursery to 4th grade: 8
- 5th and 6th grade: 6
- 7th and 8th grade: 0
- 9th grade: 17
- 10th grade: 10
- 11th grade: 33
- 12th grade, no diploma: 8
- High school graduate (or equivalency): 435
- Less than 1 year of college: 125
- Some college more than 1 year, no degree: 488
- Associate degree: 265
- Bachelor's degree: 504
- Master's degree: 625
- Professional school degree: 68
- Doctorate degree: 14


Housing units in structures:
- One, detached: 3,832
- One, attached: 395
- Two: 166
- 3 or 4: 73
- 5 to 9: 284
- 10 to 19: 47
- 20 to 49: 168
- 50 or more: 105
- Boats, RVs, vans, etc.: 15
Housing units lacking complete kitchen facilities in 2022: 2.0%
House/condo owner moved in on average 14 years ago
Renter moved in on average 1 years ago

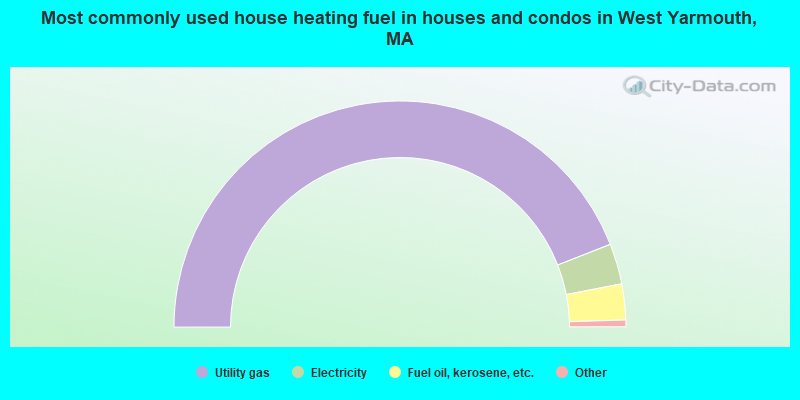
- 88.1%Utility gas
- 5.8%Electricity
- 5.1%Fuel oil, kerosene, etc.
- 0.5%Bottled, tank, or LP gas
- 0.5%Wood
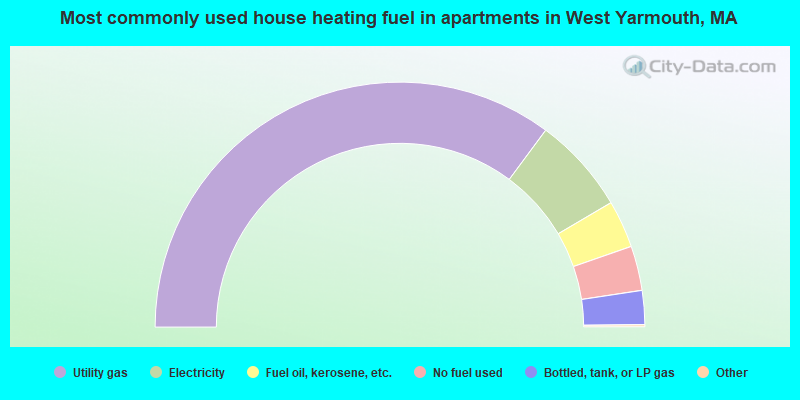
- 70.5%Utility gas
- 12.8%Electricity
- 6.3%Fuel oil, kerosene, etc.
- 5.9%No fuel used
- 4.5%Bottled, tank, or LP gas
Private vs. public school enrollment:
| Here: | 4.0% |
| Massachusetts: | 10.3% |
| Here: | 0.0% |
| Massachusetts: | 12.3% |
| Here: | 55.8% |
| Massachusetts: | 51.2% |


