West Long Branch, NJ (New Jersey) Houses and Residents
Estimated median house or condo value in 2022: $679,320 (it was $203,000 in 2000 )
West Long Branch:
$679,320New Jersey:
$428,900
Lower value quartile - upper value quartile: $496,846 - $836,443Mean price in 2022: Detached houses: $693,111 Here:
$693,111State:
$537,591
Townhouses or other attached units: $397,610 Here:
$397,610State:
$381,113
In 2-unit structures: $361,342 Here:
$361,342State:
$444,476
Total population: 8,352 (Urban population: 8,258, Rural population: 0)
Houses: 3,050 (2,761 occupied: 2,053 owner occupied, 755 renter occupied )
% of renters here:
27%State:
35%
Housing density: 1,056 houses/condos per square mile
Median price asked for vacant for-sale houses and condos in 2022 in this county: $430,351.
Median contract rent in 2022: $1,810 (lower quartile is $1,486, upper quartile is over $2,000)
Median rent asked for vacant for-rent units in 2022: $4,075
Median gross rent in West Long Branch, NJ in 2022: $1,836
Housing units in West Long Branch with a mortgage: 1,374 (157 second mortgage, 11 home equity loan, 130 both second mortgage and home equity loan )Houses without a mortgage: 45
Median household income for houses/condos with a mortgage: $164,862
Median household income for apartments without a mortgage: $94,032
Median monthly housing costs: $2,130
Data:
Median house or condo value ($)
Median house or condo value ($ change since 2000)
Median house or condo value ($) - White
Median house or condo value ($) - Black or African American
Median house or condo value ($) - Asian
Median house or condo value ($) - Hispanic or Latino
Median house or condo value ($) - American Indian and Alaska Native
Median house or condo value ($) - Multirace
Median house or condo value ($) - Other Race
Median price asked for mobile homes ($)
Household density (households per square mile)
Mean house or condo value by units in structure - 1, detached ($)
Mean house or condo value by units in structure - 1, attached ($)
Mean house or condo value by units in structure - 2 ($)
Mean house or condo value by units in structure by units in structure - 3 or 4 ($)
Mean house or condo value by units in structure - 5 or more ($)
Mean house or condo value by units in structure - Boat, RV, van, etc. ($)
Mean house or condo value by units in structure - Mobile home ($)
Median contract rent ($)
Median contract rent - Lower quartile ($)
Median contract rent - Upper quartile ($)
Median gross rent ($)
Urban houses (%)
Rural houses (%)
Houses occupied (%)
Houses occupied (% change since 2000)
Houses owner occupied (%)
Houses owner occupied (% change since 2000)
Houses renter occupied (%)
Houses renter occupied (% change since 2000)
Vacant housing units - For rent (%)
Vacant housing units - For rent (% change since 2000)
Vacant housing units - For sale only (%)
Vacant housing units - For sale only (% change since 2000)
Vacant housing units - Rented or sold, not occupied (%)
Vacant housing units - Rented or sold, not occupied (% change since 2000)
Vacant housing units - For seasonal, recreational, or occasional use (%)
Vacant housing units - For seasonal, recreational, or occasional use (% change since 2000)
Vacant housing units - For migrant workers (%)
Vacant housing units - For migrant workers (% change since 2000)
Vacant housing units - Other vacant (%)
Vacant housing units - Other vacant (% change since 2000)
Median monthly housing costs ($)
Median household income for houses/condos with a mortgage ($)
Median household income for houses/condos without a mortgage ($)
Median household income ($)
Median household income ($) - White
Median household income ($) - Black or African American
Median household income ($) - Asian
Median household income ($) - Hispanic or Latino
Median household income ($) - American Indian and Alaska Native
Median household income ($) - Multirace
Median household income ($) - Other Race
Mortgage status - with mortgage (%)
Mortgage status - with second mortgage (%)
Mortgage status - with home equity loan (%)
Mortgage status - with both second mortgage and home equity loan (%)
Mortgage status - without a mortgage (%)
Median year house/condo built
Median year apartment built
Household type by relationship - Male householder living alone (%)
Household type by relationship - Male householder not living alone (%)
Household type by relationship - Female householder living alone (%)
Household type by relationship - Female householder not living alone (%)
Household type by relationship - Opposite-Sex spouse (%)
Household type by relationship - Same-Sex spouse (%)
Household type by relationship - Opposite-Sex unmarried partner (%)
Household type by relationship - Same-Sex unmarried partner (%)
Household type by relationship - In group quarters (%)
Size of family households - 2-person household (%)
Size of family households - 3-person household (%)
Size of family households - 4-person household (%)
Size of family households - 5-person household (%)
Size of family households - 6-person household (%)
Size of family households - 7-or-more-person household (%)
Size of nonfamily households - 1-person household (%)
Size of nonfamily households - 2-person household (%)
Size of nonfamily households - 3-person household (%)
Size of nonfamily households - 4-person household (%)
Size of nonfamily households - 5-person household (%)
Size of nonfamily households - 6-person household (%)
Size of nonfamily households - 7-or-moreperson household (%)
Year house built - Built 2010 or later (%)
Year house built - Built 2000 to 2009 (%)
Year house built - Built 1990 to 1999 (%)
Year house built - Built 1980 to 1989 (%)
Year house built - Built 1970 to 1979 (%)
Year house built - Built 1960 to 1969 (%)
Year house built - Built 1950 to 1959 (%)
Year house built - Built 1940 to 1949 (%)
Year house built - Built 1939 or earlier (%)
Median number of rooms in houses and condos
Median number of rooms in apartments
Median number of bedrooms in owner occupied houses
Mean number of bedrooms in owner occupied houses
Median number of bedrooms in renter occupied houses
Mean number of bedrooms in renter occupied houses
Median number of vehichles in owner occupied houses
Mean number of vehichles in owner occupied houses
Median number of vehichles in renter occupied houses
Mean number of vehichles in renter occupied houses
Rooms in owner-occupied houses - 1 room (%)
Rooms in owner-occupied houses - 2 rooms (%)
Rooms in owner-occupied houses - 3 rooms (%)
Rooms in owner-occupied houses - 4 rooms (%)
Rooms in owner-occupied houses - 5 rooms (%)
Rooms in owner-occupied houses - 6 rooms (%)
Rooms in owner-occupied houses - 7 rooms (%)
Rooms in owner-occupied houses - 8 rooms (%)
Rooms in owner-occupied houses - 9+ rooms (%)
Rooms in renter-occupied houses - 1 room (%)
Rooms in renter-occupied houses - 2 rooms (%)
Rooms in renter-occupied houses - 3 rooms (%)
Rooms in renter-occupied houses - 4 rooms (%)
Rooms in renter-occupied houses - 5 rooms (%)
Rooms in renter-occupied houses - 6 rooms (%)
Rooms in renter-occupied houses - 7 rooms (%)
Rooms in renter-occupied houses - 8 rooms (%)
Rooms in renter-occupied houses - 9+ rooms (%)
Bedrooms in owner-occupied houses - no bedrooms (%)
Bedrooms in owner-occupied houses - 1 bedroom (%)
Bedrooms in owner-occupied houses - 2 bedrooms (%)
Bedrooms in owner-occupied houses - 3 bedrooms (%)
Bedrooms in owner-occupied houses - 4 bedrooms (%)
Bedrooms in owner-occupied houses - 5+ bedrooms (%)
Bedrooms in renter-occupied houses - no bedrooms (%)
Bedrooms in renter-occupied houses - 1 bedroom (%)
Bedrooms in renter-occupied houses - 2 bedrooms (%)
Bedrooms in renter-occupied houses - 3 bedrooms (%)
Bedrooms in renter-occupied houses - 4 bedrooms (%)
Bedrooms in renter-occupied houses - 5+ bedrooms (%)
Vehicles available in owner-occupied houses - no vehicle available (%)
Vehicles available in owner-occupied houses - 1 vehicle available(%)
Vehicles available in owner-occupied houses - 2 Vehicles available (%)
Vehicles available in owner-occupied houses - 3 Vehicles available (%)
Vehicles available in owner-occupied houses - 4 Vehicles available (%)
Vehicles available in owner-occupied houses - 5+ Vehicles available (%)
Vehicles available in renter-occupied houses - no vehicle available (%)
Vehicles available in renter-occupied houses - 1 vehicle available (%)
Vehicles available in renter-occupied houses - 2 Vehicles available (%)
Vehicles available in renter-occupied houses - 3 Vehicles available (%)
Vehicles available in renter-occupied houses - 4 Vehicles available (%)
Vehicles available in renter-occupied houses - 5+ Vehicles available (%)
Housing units in structures - 1, detached (%)
Housing units in structures - 1, attached (%)
Housing units in structures - 2 (%)
Housing units in structures - 3 or 4 (%)
Housing units in structures - 5 to 9 (%)
Housing units in structures - 10 to 19 (%)
Housing units in structures - 20 to 49 (%)
Housing units in structures - 50 or more (%)
Housing units in structures - Mobile home (%)
Housing units in structures - Boat, RV, van, etc. (%)
Housing units in structures - Owners - 1, detached (%)
Housing units in structures - Owners - 1, attached (%)
Housing units in structures - Owners - 2 (%)
Housing units in structures - Owners - 3 or 4 (%)
Housing units in structures - Owners - 5 to 9 (%)
Housing units in structures - Owners - 10 to 19 (%)
Housing units in structures - Owners - 20 to 49 (%)
Housing units in structures - Owners - 50 or more (%)
Housing units in structures - Owners - Mobile home (%)
Housing units in structures - Owners - Boat, RV, van, etc. (%)
Housing units in structures - Renters - 1, detached (%)
Housing units in structures - Renters - 1, attached (%)
Housing units in structures - Renters - 2 (%)
Housing units in structures - Renters - 3 or 4 (%)
Housing units in structures - Renters - 5 to 9 (%)
Housing units in structures - Renters - 10 to 19 (%)
Housing units in structures - Renters - 20 to 49 (%)
Housing units in structures - Renters - 50 or more (%)
Housing units in structures - Renters - Mobile home (%)
Housing units in structures - Renters - Boat, RV, van, etc. (%)
House/condo owner moved in on average (years ago)
Renter moved in on average (years ago)
Year householder moved into unit - Moved in 1999 to March 2000 (%)
Year householder moved into unit - Moved in 1999 to March 2000 (%) - White
Year householder moved into unit - Moved in 1999 to March 2000 (%) - Black or African American
Year householder moved into unit - Moved in 1999 to March 2000 (%) - Asian
Year householder moved into unit - Moved in 1999 to March 2000 (%) - Hispanic or Latino
Year householder moved into unit - Moved in 1999 to March 2000 (%) - American Indian and Alaska Native
Year householder moved into unit - Moved in 1999 to March 2000 (%) - Multirace
Year householder moved into unit - Moved in 1999 to March 2000 (%) - Other Race
Year householder moved into unit - Moved in 1995 to 1998 (%)
Year householder moved into unit - Moved in 1995 to 1998 (%) - White
Year householder moved into unit - Moved in 1995 to 1998 (%) - Black or African American
Year householder moved into unit - Moved in 1995 to 1998 (%) - Asian
Year householder moved into unit - Moved in 1995 to 1998 (%) - Hispanic or Latino
Year householder moved into unit - Moved in 1995 to 1998 (%) - American Indian and Alaska Native
Year householder moved into unit - Moved in 1995 to 1998 (%) - Multirace
Year householder moved into unit - Moved in 1995 to 1998 (%) - Other Race
Year householder moved into unit - Moved in 1990 to 1994 (%)
Year householder moved into unit - Moved in 1990 to 1994 (%) - White
Year householder moved into unit - Moved in 1990 to 1994 (%) - Black or African American
Year householder moved into unit - Moved in 1990 to 1994 (%) - Asian
Year householder moved into unit - Moved in 1990 to 1994 (%) - Hispanic or Latino
Year householder moved into unit - Moved in 1990 to 1994 (%) - American Indian and Alaska Native
Year householder moved into unit - Moved in 1990 to 1994 (%) - Multirace
Year householder moved into unit - Moved in 1990 to 1994 (%) - Other Race
Year householder moved into unit - Moved in 1980 to 1989 (%)
Year householder moved into unit - Moved in 1980 to 1989 (%) - White
Year householder moved into unit - Moved in 1980 to 1989 (%) - Black or African American
Year householder moved into unit - Moved in 1980 to 1989 (%) - Asian
Year householder moved into unit - Moved in 1980 to 1989 (%) - Hispanic or Latino
Year householder moved into unit - Moved in 1980 to 1989 (%) - American Indian and Alaska Native
Year householder moved into unit - Moved in 1980 to 1989 (%) - Multirace
Year householder moved into unit - Moved in 1980 to 1989 (%) - Other Race
Year householder moved into unit - Moved in 1970 to 1979 (%)
Year householder moved into unit - Moved in 1970 to 1979 (%) - White
Year householder moved into unit - Moved in 1970 to 1979 (%) - Black or African American
Year householder moved into unit - Moved in 1970 to 1979 (%) - Asian
Year householder moved into unit - Moved in 1970 to 1979 (%) - Hispanic or Latino
Year householder moved into unit - Moved in 1970 to 1979 (%) - American Indian and Alaska Native
Year householder moved into unit - Moved in 1970 to 1979 (%) - Multirace
Year householder moved into unit - Moved in 1970 to 1979 (%) - Other Race
Year householder moved into unit - Moved in 1969 or earlier (%)
Year householder moved into unit - Moved in 1969 or earlier (%) - White
Year householder moved into unit - Moved in 1969 or earlier (%) - Black or African American
Year householder moved into unit - Moved in 1969 or earlier (%) - Asian
Year householder moved into unit - Moved in 1969 or earlier (%) - Hispanic or Latino
Year householder moved into unit - Moved in 1969 or earlier (%) - American Indian and Alaska Native
Year householder moved into unit - Moved in 1969 or earlier (%) - Multirace
Year householder moved into unit - Moved in 1969 or earlier (%) - Other Race
Housing units lacking complete plumbing facilities (%)
Housing units lacking complete kitchen facilities (%)
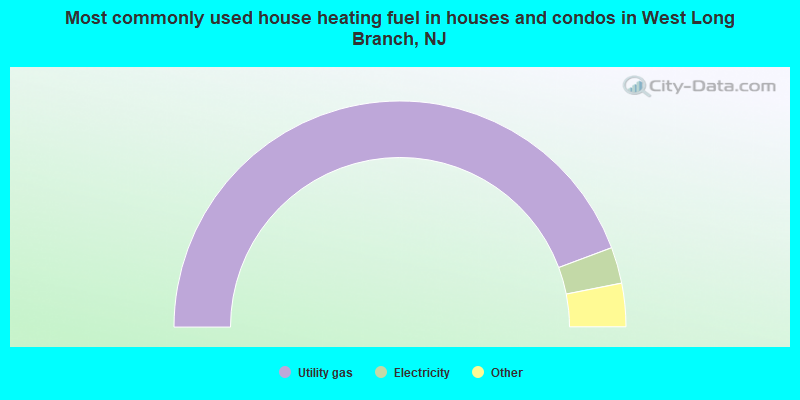
House heating fuel used in houses and condos - Utility gas (%)
House heating fuel used in houses and condos - Bottled, tank, or LP gas (%)
House heating fuel used in houses and condos - Electricity (%)
House heating fuel used in houses and condos - Fuel oil, kerosene, etc. (%)
House heating fuel used in houses and condos - Coal or coke (%)
House heating fuel used in houses and condos - Wood (%)
House heating fuel used in houses and condos - Solar energy (%)
House heating fuel used in houses and condos - Other fuel (%)
House heating fuel used in houses and condos - No fuel used (%)
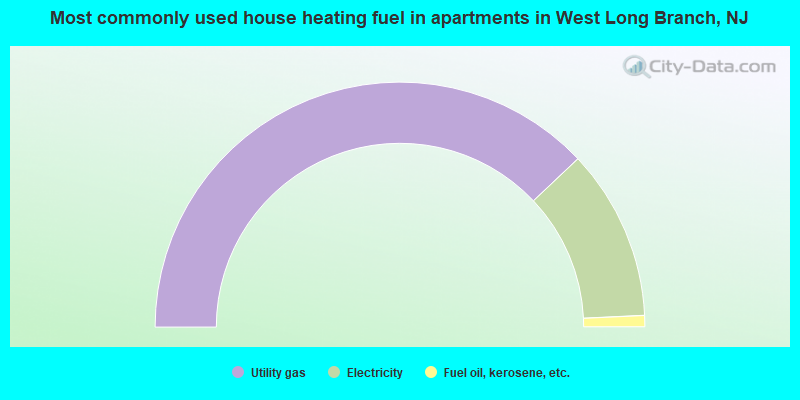
House heating fuel used in apartments - Utility gas (%)
House heating fuel used in apartments - Bottled, tank, or LP gas (%)
House heating fuel used in apartments - Electricity (%)
House heating fuel used in apartments - Fuel oil, kerosene, etc. (%)
House heating fuel used in apartments - Coal or coke (%)
House heating fuel used in apartments - Wood (%)
House heating fuel used in apartments - Solar energy (%)
House heating fuel used in apartments - Other fuel (%)
House heating fuel used in apartments - No fuel used (%)
Median year house/condo built: 1959Median year apartment built: 1975Household type by relationship:
Households: 8,560
Male householders: 1,218 (206 living alone ), Female householders: 1,532 (491 living alone )1,666 spouses (1,648 opposite-sex spouses ), 99 unmarried partners , (99 opposite-sex unmarried partners ), 2,390 children (2,359 natural , 14 adopted , 17 stepchildren ), 151 grandchildren , 8 brothers or sisters , 40 parents , 11 foster children , 48 other relatives , 26 non-relatives In group quarters: 1,368
Size of family households: 745 2-persons , 545 3-persons , 383 4-persons , 302 5-persons , 52 6-persons , 8 7-or-more-persons .
Size of nonfamily households: 696 1-person , 101 2-persons .
1,339 married couples with children. single-parent households (19 men , 129 women ).
90.4% of residents of West Long Branch speak English at home. of residents speak Spanish at home (64% speak English very well , 16% speak English well , 18% speak English not well , 2% don't speak English at all ).of residents speak other Indo-European language at home (87% speak English very well , 5% speak English well , 5% speak English not well , 3% don't speak English at all ).of residents speak Asian or Pacific Island language at home (100% speak English very well ).of residents speak other language at home (98% speak English very well , 2% speak English well ).
Foreign born population: 450 (5.3%)of them are naturalized citizens )
Median number of rooms in houses and condos:
Median number of rooms in apartments
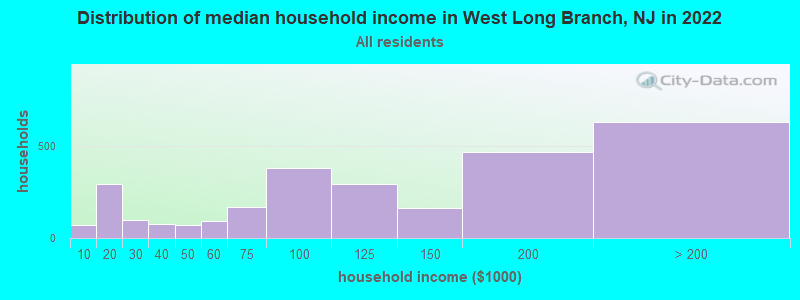
West Long Branch, NJ household income distribution 69 Less than $10,000293 $10,000 to $19,99996 $20,000 to $29,99976 $30,000 to $39,99973 $40,000 to $49,99994 $50,000 to $59,999168 $60,000 to $74,999378 $75,000 to $99,999295 $100,000 to $124,999161 $125,000 to $149,999466 $150,000 to $199,999629 $200,000 or more
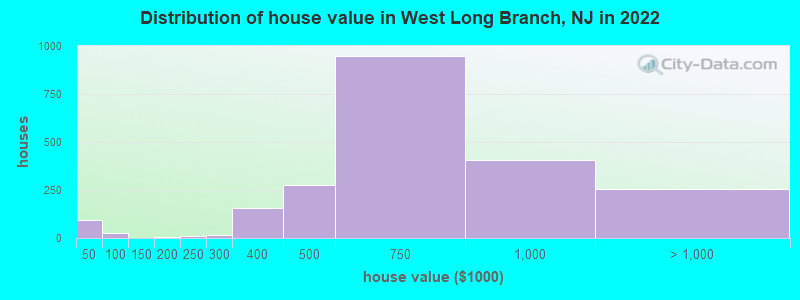
Home value of owner - occupied houses in 2022 in West Long Branch, NJ 89 Less than $10,0006 $25,000 to $29,99913 $50,000 to $59,99913 $60,000 to $69,9995 $150,000 to $174,99913 $200,000 to $249,99915 $250,000 to $299,999154 $300,000 to $399,999275 $400,000 to $499,999946 $500,000 to $749,999408 $750,000 to $999,999128 $1,000,000 to $1,499,999115 $1,500,000 to $1,999,99912 $2,000,000 or moreRent paid by renters in 2022 in West Long Branch, NJ 8 $100 to $14913 $200 to $24911 $350 to $39921 $450 to $49911 $550 to $59912 $900 to $9999 $1,000 to $1,24959 $1,250 to $1,499237 $1,500 to $1,999164 $2,000 to $2,49938 $2,500 to $2,99944 $3,000 to $3,49930 $3,500 or more42 No cash rent
Percentage of workers working in this county: 77.2%Number of people working at home: 1,149 (29.7% of all workers )
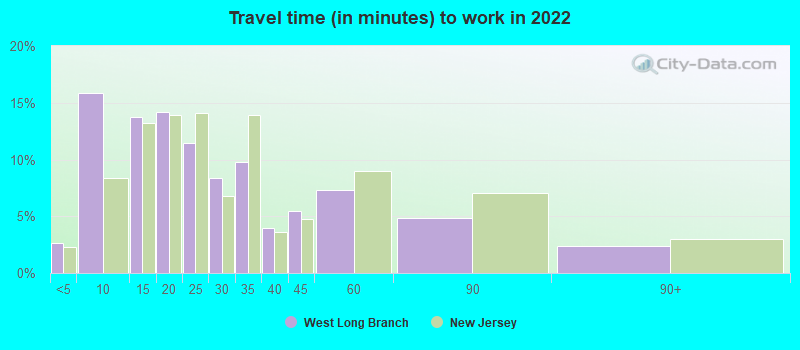
Travel time to work (commute)
Less than 5 minutes: 1265 to 9 minutes: 60510 to 14 minutes: 61315 to 19 minutes: 28520 to 24 minutes: 23325 to 29 minutes: 10630 to 34 minutes: 22235 to 39 minutes: 3440 to 44 minutes: 5945 to 59 minutes: 15660 to 89 minutes: 26390 or more minutes: 187
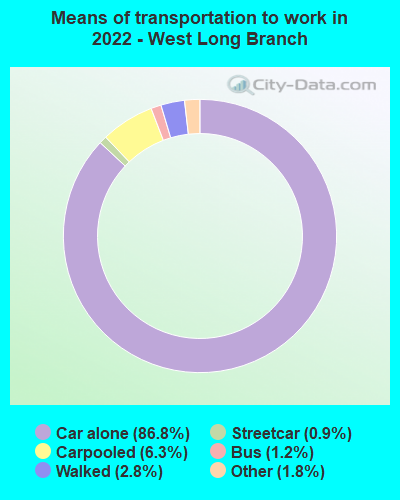
Means of transportation to work:
Drove a car alone: 3,234 (64.5%)Carpooled: 281 (5.6%)Bus : 75 (1.5%)Subway or elevated rail : 32 (0.6%)Taxi: 101 (2.0%)Walked: 159 (3.2%)Worked at home: 1,149 (22.9%)
Unemployment by race in 2022
Unemployment rate for White non-Hispanic residents 7.5% Males2.2% FemalesUnemployment rate for Black residents 8.8% MalesUnemployment rate for two or more race residents 22.6% MalesUnemployment rate for Hispanic or Latino residents 1.5% Males
Year of entry for the foreign-born population in West Long Branch, New Jersey
79 2010 or later 133 2000 to 2009 92 1990 to 1999 121 1980 to 1989 45 1970 to 1979 336 Before 1970
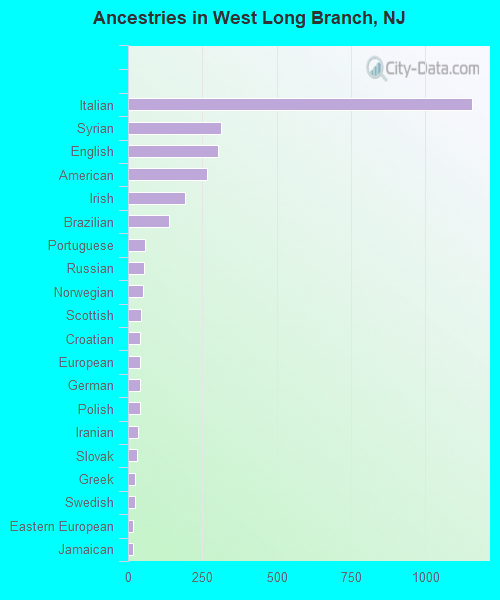
First ancestries reported:
Italian: 1,157 (31.9%)
Syrian: 312 (8.6%)
English: 303 (8.4%)
American: 266 (7.3%)
Irish: 191 (5.3%)
Brazilian: 137 (3.8%)
Portuguese: 58 (1.6%)
Russian: 53 (1.5%)
Norwegian: 49 (1.4%)
Scottish: 45 (1.2%)
Croatian: 42 (1.2%)
European: 41 (1.1%)
German: 40 (1.1%)
Polish: 39 (1.1%)
Iranian: 35 (1.0%)
Slovak: 30 (0.8%)
Greek: 23 (0.6%)
Swedish: 22 (0.6%)
Eastern European: 18 (0.5%)
Jamaican: 16 (0.4%)
Ukrainian: 9 (0.2%) Most common places of birth for foreign-born residents (%): Brazil West Long Branch:
35.0% (157)New Jersey:
2.1% (46,020)
Norway West Long Branch:
10.0% (45)New Jersey:
0.0% (801)
Italy West Long Branch:
10.0% (45)New Jersey:
1.5% (33,198)
Czechoslovakia (includes Czech Republic and Slovakia) West Long Branch:
7.8% (35)New Jersey:
0.2% (3,968)
Croatia West Long Branch:
6.5% (29)New Jersey:
0.1% (2,623)
Jamaica West Long Branch:
3.6% (16)New Jersey:
2.2% (47,365)
Ireland West Long Branch:
2.9% (13)New Jersey:
0.4% (8,146)
England West Long Branch:
2.2% (10)New Jersey:
0.5% (10,886)
Portugal West Long Branch:
2.2% (10)New Jersey:
1.3% (28,871)
Canada West Long Branch:
2.2% (10)New Jersey:
0.9% (18,317)
Uruguay West Long Branch:
2.0% (9)New Jersey:
0.3% (6,972)
Germany West Long Branch:
1.8% (8)New Jersey:
0.8% (17,217)
Egypt West Long Branch:
1.8% (8)New Jersey:
1.6% (33,678)
Greece West Long Branch:
1.6% (7)New Jersey:
0.3% (7,501)
Korea West Long Branch:
1.6% (7)New Jersey:
3.3% (70,512)
Place of birth for U.S.-born residents:
This state: 5,743Other state: 2,232Northeast: 1,638Midwest: 237South: 338West: 16 86.5% of West Long Branch residents lived in the same house 1 years ago.
Out of people who lived in different houses, 25.9% lived in this county.
Out of people who lived in different counties, 68.3% lived in New Jersey.
West Long Branch:
86.5%State average:
90.4%
Education attainment for males 25 years and older:
No schooling: 9Nursery to 4th grade: 05th and 6th grade: 07th and 8th grade: 09th grade: 010th grade: 011th grade: 5912th grade, no diploma: 24High school graduate (or equivalency): 581Less than 1 year of college: 231Some college more than 1 year, no degree: 258Associate degree: 125Bachelor's degree: 506Master's degree: 252Professional school degree: 113Doctorate degree: 20
Education attainment for females 25 years and older:
No schooling: 36Nursery to 4th grade: 115th and 6th grade: 07th and 8th grade: 99th grade: 17510th grade: 1711th grade: 4812th grade, no diploma: 22High school graduate (or equivalency): 456Less than 1 year of college: 116Some college more than 1 year, no degree: 291Associate degree: 136Bachelor's degree: 1,035Master's degree: 414Professional school degree: 19Doctorate degree: 15
Housing units in structures:
One, detached: 2,304One, attached: 140Two: 513 or 4: 12310 to 19: 9220 to 49: 12150 or more: 216Housing units lacking complete plumbing facilities in 2022: 0.4%Housing units lacking complete kitchen facilities in 2022: 1.4%House/condo owner moved in on average 19 years ago
Renter moved in on average 8 years ago
Private vs. public school enrollment:
Students in private schools in grades 1 to 8 (elementary and middle school): 115 Here:
26.5%New Jersey:
12.3%
Students in private schools in grades 9 to 12 (high school): 95 Here:
22.1%New Jersey:
13.1%
Students in private undergraduate colleges: 1,000 Here:
91.1%New Jersey:
33.2%