West Fargo, ND (North Dakota) Houses and Residents
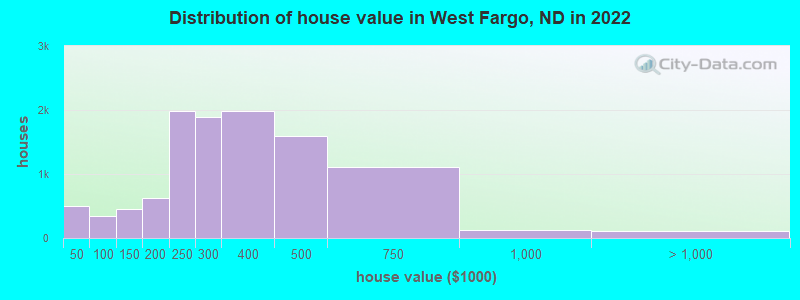
Estimated median house or condo value in 2022: $290,863 (it was $92,800 in 2000 )
West Fargo:
$290,863North Dakota:
$243,100
Lower value quartile - upper value quartile: $218,322 - $410,176Total population: 31,771 (Urban population: 14,560, Rural population: 72 (all nonfarm) )
Houses: 16,425 (15,633 occupied: 10,355 owner occupied, 5,386 renter occupied )
% of renters here:
34%State:
35%
Housing density: 2,253 houses/condos per square mile
Median price asked for vacant for-sale houses and condos in 2022: $587,939.
Median contract rent in 2022: $948 (lower quartile is $750, upper quartile is $1,238)
Median rent asked for vacant for-rent units in 2022: $1,605
Median gross rent in West Fargo, ND in 2022: $1,013
Housing units in West Fargo with a mortgage: 7,430 (896 second mortgage, 28 home equity loan, 749 both second mortgage and home equity loan )Houses without a mortgage: 112
Median household income for houses/condos with a mortgage: $119,862
Median household income for apartments without a mortgage: $81,089
Median monthly housing costs: $1,267
Data:
Median house or condo value ($)
Median house or condo value ($ change since 2000)
Median house or condo value ($) - White
Median house or condo value ($) - Black or African American
Median house or condo value ($) - Asian
Median house or condo value ($) - Hispanic or Latino
Median house or condo value ($) - American Indian and Alaska Native
Median house or condo value ($) - Multirace
Median house or condo value ($) - Other Race
Median price asked for mobile homes ($)
Household density (households per square mile)
Mean house or condo value by units in structure - 1, detached ($)
Mean house or condo value by units in structure - 1, attached ($)
Mean house or condo value by units in structure - 2 ($)
Mean house or condo value by units in structure by units in structure - 3 or 4 ($)
Mean house or condo value by units in structure - 5 or more ($)
Mean house or condo value by units in structure - Boat, RV, van, etc. ($)
Mean house or condo value by units in structure - Mobile home ($)
Median contract rent ($)
Median contract rent - Lower quartile ($)
Median contract rent - Upper quartile ($)
Median gross rent ($)
Urban houses (%)
Rural houses (%)
Houses occupied (%)
Houses occupied (% change since 2000)
Houses owner occupied (%)
Houses owner occupied (% change since 2000)
Houses renter occupied (%)
Houses renter occupied (% change since 2000)
Vacant housing units - For rent (%)
Vacant housing units - For rent (% change since 2000)
Vacant housing units - For sale only (%)
Vacant housing units - For sale only (% change since 2000)
Vacant housing units - Rented or sold, not occupied (%)
Vacant housing units - Rented or sold, not occupied (% change since 2000)
Vacant housing units - For seasonal, recreational, or occasional use (%)
Vacant housing units - For seasonal, recreational, or occasional use (% change since 2000)
Vacant housing units - For migrant workers (%)
Vacant housing units - For migrant workers (% change since 2000)
Vacant housing units - Other vacant (%)
Vacant housing units - Other vacant (% change since 2000)
Median monthly housing costs ($)
Median household income for houses/condos with a mortgage ($)
Median household income for houses/condos without a mortgage ($)
Median household income ($)
Median household income ($) - White
Median household income ($) - Black or African American
Median household income ($) - Asian
Median household income ($) - Hispanic or Latino
Median household income ($) - American Indian and Alaska Native
Median household income ($) - Multirace
Median household income ($) - Other Race
Mortgage status - with mortgage (%)
Mortgage status - with second mortgage (%)
Mortgage status - with home equity loan (%)
Mortgage status - with both second mortgage and home equity loan (%)
Mortgage status - without a mortgage (%)
Median year house/condo built
Median year apartment built
Household type by relationship - Male householder living alone (%)
Household type by relationship - Male householder not living alone (%)
Household type by relationship - Female householder living alone (%)
Household type by relationship - Female householder not living alone (%)
Household type by relationship - Opposite-Sex spouse (%)
Household type by relationship - Same-Sex spouse (%)
Household type by relationship - Opposite-Sex unmarried partner (%)
Household type by relationship - Same-Sex unmarried partner (%)
Household type by relationship - In group quarters (%)
Size of family households - 2-person household (%)
Size of family households - 3-person household (%)
Size of family households - 4-person household (%)
Size of family households - 5-person household (%)
Size of family households - 6-person household (%)
Size of family households - 7-or-more-person household (%)
Size of nonfamily households - 1-person household (%)
Size of nonfamily households - 2-person household (%)
Size of nonfamily households - 3-person household (%)
Size of nonfamily households - 4-person household (%)
Size of nonfamily households - 5-person household (%)
Size of nonfamily households - 6-person household (%)
Size of nonfamily households - 7-or-moreperson household (%)
Year house built - Built 2010 or later (%)
Year house built - Built 2000 to 2009 (%)
Year house built - Built 1990 to 1999 (%)
Year house built - Built 1980 to 1989 (%)
Year house built - Built 1970 to 1979 (%)
Year house built - Built 1960 to 1969 (%)
Year house built - Built 1950 to 1959 (%)
Year house built - Built 1940 to 1949 (%)
Year house built - Built 1939 or earlier (%)
Median number of rooms in houses and condos
Median number of rooms in apartments
Median number of bedrooms in owner occupied houses
Mean number of bedrooms in owner occupied houses
Median number of bedrooms in renter occupied houses
Mean number of bedrooms in renter occupied houses
Median number of vehichles in owner occupied houses
Mean number of vehichles in owner occupied houses
Median number of vehichles in renter occupied houses
Mean number of vehichles in renter occupied houses
Rooms in owner-occupied houses - 1 room (%)
Rooms in owner-occupied houses - 2 rooms (%)
Rooms in owner-occupied houses - 3 rooms (%)
Rooms in owner-occupied houses - 4 rooms (%)
Rooms in owner-occupied houses - 5 rooms (%)
Rooms in owner-occupied houses - 6 rooms (%)
Rooms in owner-occupied houses - 7 rooms (%)
Rooms in owner-occupied houses - 8 rooms (%)
Rooms in owner-occupied houses - 9+ rooms (%)
Rooms in renter-occupied houses - 1 room (%)
Rooms in renter-occupied houses - 2 rooms (%)
Rooms in renter-occupied houses - 3 rooms (%)
Rooms in renter-occupied houses - 4 rooms (%)
Rooms in renter-occupied houses - 5 rooms (%)
Rooms in renter-occupied houses - 6 rooms (%)
Rooms in renter-occupied houses - 7 rooms (%)
Rooms in renter-occupied houses - 8 rooms (%)
Rooms in renter-occupied houses - 9+ rooms (%)
Bedrooms in owner-occupied houses - no bedrooms (%)
Bedrooms in owner-occupied houses - 1 bedroom (%)
Bedrooms in owner-occupied houses - 2 bedrooms (%)
Bedrooms in owner-occupied houses - 3 bedrooms (%)
Bedrooms in owner-occupied houses - 4 bedrooms (%)
Bedrooms in owner-occupied houses - 5+ bedrooms (%)
Bedrooms in renter-occupied houses - no bedrooms (%)
Bedrooms in renter-occupied houses - 1 bedroom (%)
Bedrooms in renter-occupied houses - 2 bedrooms (%)
Bedrooms in renter-occupied houses - 3 bedrooms (%)
Bedrooms in renter-occupied houses - 4 bedrooms (%)
Bedrooms in renter-occupied houses - 5+ bedrooms (%)
Vehicles available in owner-occupied houses - no vehicle available (%)
Vehicles available in owner-occupied houses - 1 vehicle available(%)
Vehicles available in owner-occupied houses - 2 Vehicles available (%)
Vehicles available in owner-occupied houses - 3 Vehicles available (%)
Vehicles available in owner-occupied houses - 4 Vehicles available (%)
Vehicles available in owner-occupied houses - 5+ Vehicles available (%)
Vehicles available in renter-occupied houses - no vehicle available (%)
Vehicles available in renter-occupied houses - 1 vehicle available (%)
Vehicles available in renter-occupied houses - 2 Vehicles available (%)
Vehicles available in renter-occupied houses - 3 Vehicles available (%)
Vehicles available in renter-occupied houses - 4 Vehicles available (%)
Vehicles available in renter-occupied houses - 5+ Vehicles available (%)
Housing units in structures - 1, detached (%)
Housing units in structures - 1, attached (%)
Housing units in structures - 2 (%)
Housing units in structures - 3 or 4 (%)
Housing units in structures - 5 to 9 (%)
Housing units in structures - 10 to 19 (%)
Housing units in structures - 20 to 49 (%)
Housing units in structures - 50 or more (%)
Housing units in structures - Mobile home (%)
Housing units in structures - Boat, RV, van, etc. (%)
Housing units in structures - Owners - 1, detached (%)
Housing units in structures - Owners - 1, attached (%)
Housing units in structures - Owners - 2 (%)
Housing units in structures - Owners - 3 or 4 (%)
Housing units in structures - Owners - 5 to 9 (%)
Housing units in structures - Owners - 10 to 19 (%)
Housing units in structures - Owners - 20 to 49 (%)
Housing units in structures - Owners - 50 or more (%)
Housing units in structures - Owners - Mobile home (%)
Housing units in structures - Owners - Boat, RV, van, etc. (%)
Housing units in structures - Renters - 1, detached (%)
Housing units in structures - Renters - 1, attached (%)
Housing units in structures - Renters - 2 (%)
Housing units in structures - Renters - 3 or 4 (%)
Housing units in structures - Renters - 5 to 9 (%)
Housing units in structures - Renters - 10 to 19 (%)
Housing units in structures - Renters - 20 to 49 (%)
Housing units in structures - Renters - 50 or more (%)
Housing units in structures - Renters - Mobile home (%)
Housing units in structures - Renters - Boat, RV, van, etc. (%)
House/condo owner moved in on average (years ago)
Renter moved in on average (years ago)
Year householder moved into unit - Moved in 1999 to March 2000 (%)
Year householder moved into unit - Moved in 1999 to March 2000 (%) - White
Year householder moved into unit - Moved in 1999 to March 2000 (%) - Black or African American
Year householder moved into unit - Moved in 1999 to March 2000 (%) - Asian
Year householder moved into unit - Moved in 1999 to March 2000 (%) - Hispanic or Latino
Year householder moved into unit - Moved in 1999 to March 2000 (%) - American Indian and Alaska Native
Year householder moved into unit - Moved in 1999 to March 2000 (%) - Multirace
Year householder moved into unit - Moved in 1999 to March 2000 (%) - Other Race
Year householder moved into unit - Moved in 1995 to 1998 (%)
Year householder moved into unit - Moved in 1995 to 1998 (%) - White
Year householder moved into unit - Moved in 1995 to 1998 (%) - Black or African American
Year householder moved into unit - Moved in 1995 to 1998 (%) - Asian
Year householder moved into unit - Moved in 1995 to 1998 (%) - Hispanic or Latino
Year householder moved into unit - Moved in 1995 to 1998 (%) - American Indian and Alaska Native
Year householder moved into unit - Moved in 1995 to 1998 (%) - Multirace
Year householder moved into unit - Moved in 1995 to 1998 (%) - Other Race
Year householder moved into unit - Moved in 1990 to 1994 (%)
Year householder moved into unit - Moved in 1990 to 1994 (%) - White
Year householder moved into unit - Moved in 1990 to 1994 (%) - Black or African American
Year householder moved into unit - Moved in 1990 to 1994 (%) - Asian
Year householder moved into unit - Moved in 1990 to 1994 (%) - Hispanic or Latino
Year householder moved into unit - Moved in 1990 to 1994 (%) - American Indian and Alaska Native
Year householder moved into unit - Moved in 1990 to 1994 (%) - Multirace
Year householder moved into unit - Moved in 1990 to 1994 (%) - Other Race
Year householder moved into unit - Moved in 1980 to 1989 (%)
Year householder moved into unit - Moved in 1980 to 1989 (%) - White
Year householder moved into unit - Moved in 1980 to 1989 (%) - Black or African American
Year householder moved into unit - Moved in 1980 to 1989 (%) - Asian
Year householder moved into unit - Moved in 1980 to 1989 (%) - Hispanic or Latino
Year householder moved into unit - Moved in 1980 to 1989 (%) - American Indian and Alaska Native
Year householder moved into unit - Moved in 1980 to 1989 (%) - Multirace
Year householder moved into unit - Moved in 1980 to 1989 (%) - Other Race
Year householder moved into unit - Moved in 1970 to 1979 (%)
Year householder moved into unit - Moved in 1970 to 1979 (%) - White
Year householder moved into unit - Moved in 1970 to 1979 (%) - Black or African American
Year householder moved into unit - Moved in 1970 to 1979 (%) - Asian
Year householder moved into unit - Moved in 1970 to 1979 (%) - Hispanic or Latino
Year householder moved into unit - Moved in 1970 to 1979 (%) - American Indian and Alaska Native
Year householder moved into unit - Moved in 1970 to 1979 (%) - Multirace
Year householder moved into unit - Moved in 1970 to 1979 (%) - Other Race
Year householder moved into unit - Moved in 1969 or earlier (%)
Year householder moved into unit - Moved in 1969 or earlier (%) - White
Year householder moved into unit - Moved in 1969 or earlier (%) - Black or African American
Year householder moved into unit - Moved in 1969 or earlier (%) - Asian
Year householder moved into unit - Moved in 1969 or earlier (%) - Hispanic or Latino
Year householder moved into unit - Moved in 1969 or earlier (%) - American Indian and Alaska Native
Year householder moved into unit - Moved in 1969 or earlier (%) - Multirace
Year householder moved into unit - Moved in 1969 or earlier (%) - Other Race
Housing units lacking complete plumbing facilities (%)
Housing units lacking complete kitchen facilities (%)
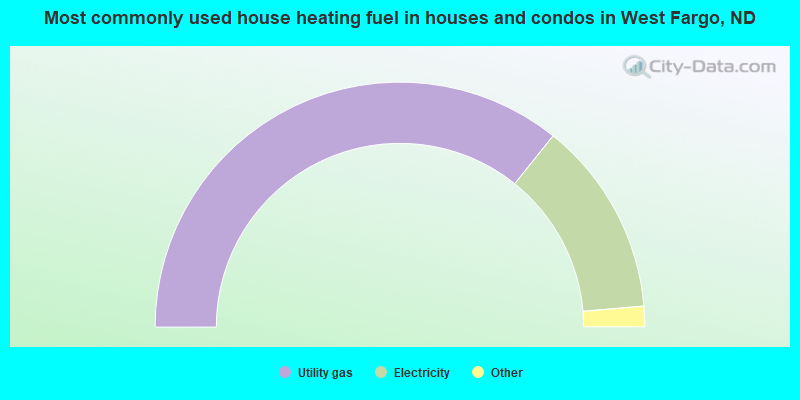
House heating fuel used in houses and condos - Utility gas (%)
House heating fuel used in houses and condos - Bottled, tank, or LP gas (%)
House heating fuel used in houses and condos - Electricity (%)
House heating fuel used in houses and condos - Fuel oil, kerosene, etc. (%)
House heating fuel used in houses and condos - Coal or coke (%)
House heating fuel used in houses and condos - Wood (%)
House heating fuel used in houses and condos - Solar energy (%)
House heating fuel used in houses and condos - Other fuel (%)
House heating fuel used in houses and condos - No fuel used (%)
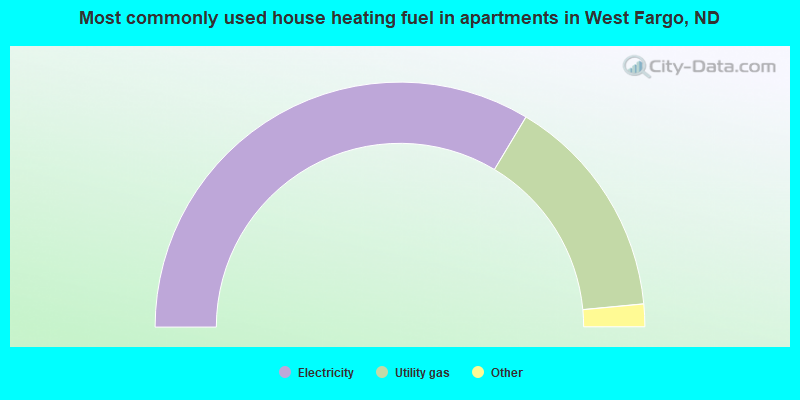
House heating fuel used in apartments - Utility gas (%)
House heating fuel used in apartments - Bottled, tank, or LP gas (%)
House heating fuel used in apartments - Electricity (%)
House heating fuel used in apartments - Fuel oil, kerosene, etc. (%)
House heating fuel used in apartments - Coal or coke (%)
House heating fuel used in apartments - Wood (%)
House heating fuel used in apartments - Solar energy (%)
House heating fuel used in apartments - Other fuel (%)
House heating fuel used in apartments - No fuel used (%)
Median year house/condo built: 2002Median year apartment built: 2015Household type by relationship:
Households: 39,981
Male householders: 7,150 (1,656 living alone ), Female householders: 8,471 (2,283 living alone )8,720 spouses (8,705 opposite-sex spouses ), 1,429 unmarried partners , (1,332 opposite-sex unmarried partners ), 12,356 children (11,625 natural , 214 adopted , 517 stepchildren ), 219 grandchildren , 260 brothers or sisters , 103 parents , 29 foster children , 187 other relatives , 934 non-relatives In group quarters: 117
Size of family households: 3,965 2-persons , 2,528 3-persons , 1,824 4-persons , 986 5-persons , 337 6-persons , 166 7-or-more-persons .
Size of nonfamily households: 4,222 1-person , 1,430 2-persons , 95 3-persons , 26 4-persons , 20 6-persons .
8,145 married couples with children. single-parent households (488 men , 1,627 women ).
92.8% of residents of West Fargo speak English at home. of residents speak Spanish at home (33% speak English very well , 67% speak English well ).of residents speak other Indo-European language at home (93% speak English very well , 7% speak English well ).of residents speak Asian or Pacific Island language at home (50% speak English very well , 43% speak English well , 6% speak English not well , 1% don't speak English at all ).of residents speak other language at home (94% speak English very well , 4% speak English well , 2% speak English not well ).
Foreign born population: 1,860 (4.7%)of them are naturalized citizens )
Median number of rooms in houses and condos:
Median number of rooms in apartments
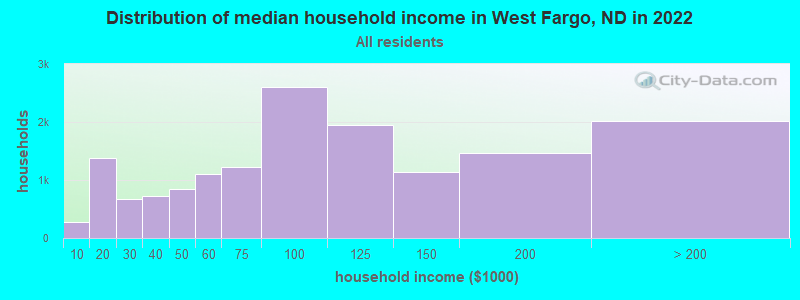
West Fargo, ND household income distribution 282 Less than $10,0001,372 $10,000 to $19,999677 $20,000 to $29,999717 $30,000 to $39,999850 $40,000 to $49,9991,100 $50,000 to $59,9991,223 $60,000 to $74,9992,611 $75,000 to $99,9991,941 $100,000 to $124,9991,145 $125,000 to $149,9991,466 $150,000 to $199,9992,016 $200,000 or more
Home value of owner - occupied houses in 2022 in West Fargo, ND 199 Less than $10,00076 $10,000 to $14,99953 $15,000 to $19,99977 $20,000 to $24,9992 $25,000 to $29,99937 $30,000 to $34,99945 $40,000 to $49,99999 $50,000 to $59,99982 $60,000 to $69,99976 $70,000 to $79,99937 $90,000 to $99,999125 $100,000 to $124,999329 $125,000 to $149,999248 $150,000 to $174,999380 $175,000 to $199,9991,989 $200,000 to $249,9991,884 $250,000 to $299,9991,978 $300,000 to $399,9991,587 $400,000 to $499,9991,110 $500,000 to $749,999131 $750,000 to $999,999107 $2,000,000 or moreRent paid by renters in 2022 in West Fargo, ND 17 $250 to $29916 $300 to $349107 $400 to $449145 $450 to $499201 $500 to $549289 $550 to $599181 $600 to $649120 $650 to $699293 $700 to $749120 $750 to $7991,111 $800 to $899564 $900 to $999749 $1,000 to $1,249382 $1,250 to $1,499691 $1,500 to $1,99960 $2,000 to $2,49948 $2,500 to $2,99996 $3,500 or more31 No cash rent
Percentage of workers working in this county: 94.1%Number of people working at home: 2,496 (10.5% of all workers )
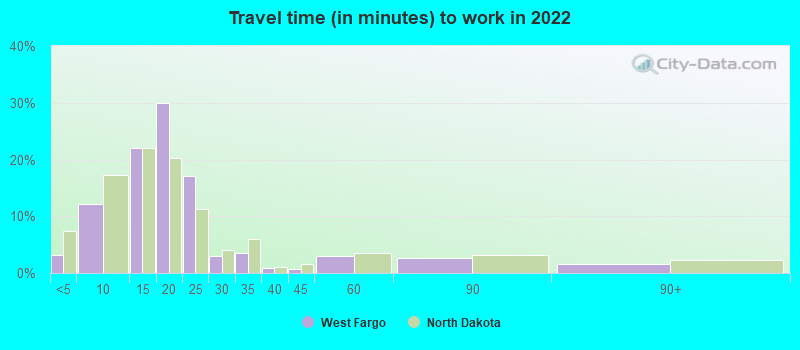
Travel time to work (commute)
Less than 5 minutes: 4975 to 9 minutes: 2,49810 to 14 minutes: 5,17415 to 19 minutes: 7,22820 to 24 minutes: 2,80725 to 29 minutes: 1,15630 to 34 minutes: 49835 to 39 minutes: 5640 to 44 minutes: 8545 to 59 minutes: 57660 to 89 minutes: 44290 or more minutes: 188
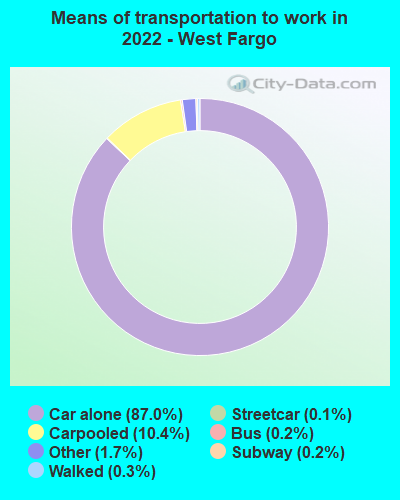
Means of transportation to work:
Drove a car alone: 12,757 (76.9%)Carpooled: 1,377 (8.3%)Bus : 20 (0.1%)Subway or elevated rail : 21 (0.1%)Long-distance train or commuter rail : 48 (0.3%)Taxi: 164 (1.0%)Walked: 36 (0.2%)Worked at home: 2,496 (15.1%)
Unemployment by race in 2022
Unemployment rate for White non-Hispanic residents 0.3% Males0.9% FemalesUnemployment rate for Black residents 6.4% MalesUnemployment rate for two or more race residents 1.9% Females
Year of entry for the foreign-born population in West Fargo, North Dakota
1,029 2010 or later 549 2000 to 2009 281 1990 to 1999 24 1980 to 1989 33 1970 to 1979 23 Before 1970
First ancestries reported:
German: 4,259 (32.2%)
Norwegian: 2,726 (20.6%)
American: 715 (5.4%)
Scandinavian: 585 (4.4%)
English: 462 (3.5%)
European: 394 (3.0%)
Irish: 384 (2.9%)
Swedish: 313 (2.4%)
Syrian: 250 (1.9%)
Czech: 149 (1.1%)
Nigerian: 137 (1.0%)
Polish: 115 (0.9%)
Italian: 110 (0.8%)
Dutch: 85 (0.6%)
Liberian: 78 (0.6%)
Sudanese: 74 (0.6%)
Finnish: 67 (0.5%)
French Canadian: 54 (0.4%)
Danish: 43 (0.3%)
Scottish: 43 (0.3%)
Pennsylvania German: 36 (0.3%)
Lebanese: 22 (0.2%)
British: 21 (0.2%)
Russian: 21 (0.2%)
Luxembourger: 20 (0.2%)
Icelander: 18 (0.1%)
Lithuanian: 16 (0.1%)
African: 15 (0.1%)
Welsh: 15 (0.1%)
French: 14 (0.1%)
Hungarian: 14 (0.1%)
German Russian: 13 (0.10%)
Croatian: 12 (0.09%)
Scotch-Irish: 9 (0.07%)
Iraqi: 9 (0.07%) Most common places of birth for foreign-born residents (%): Japan West Fargo:
8.6% (158)North Dakota:
1.3% (464)
India West Fargo:
7.9% (146)North Dakota:
3.8% (1,374)
Canada West Fargo:
7.6% (140)North Dakota:
8.7% (3,118)
Vietnam West Fargo:
6.8% (126)North Dakota:
1.5% (542)
Nigeria West Fargo:
6.8% (125)North Dakota:
3.0% (1,068)
Philippines West Fargo:
6.7% (124)North Dakota:
6.9% (2,472)
Congo West Fargo:
6.5% (119)North Dakota:
0.5% (172)
Syria West Fargo:
6.1% (112)North Dakota:
0.6% (225)
Other Eastern Africa West Fargo:
5.9% (108)North Dakota:
1.1% (391)
Liberia West Fargo:
4.1% (76)North Dakota:
8.6% (3,094)
Korea West Fargo:
3.9% (72)North Dakota:
2.0% (720)
Nepal West Fargo:
3.7% (68)North Dakota:
3.0% (1,073)
Tanzania West Fargo:
3.4% (62)North Dakota:
1.0% (367)
United Kingdom, excluding England and Scotland West Fargo:
3.1% (57)North Dakota:
0.5% (179)
Mexico West Fargo:
2.7% (50)North Dakota:
8.0% (2,889)
Russia West Fargo:
2.6% (47)North Dakota:
0.8% (282)
Peru West Fargo:
2.6% (47)North Dakota:
0.7% (245)
Sierra Leone West Fargo:
2.4% (44)North Dakota:
0.1% (53)
Greece West Fargo:
2.0% (36)North Dakota:
0.1% (51)
Place of birth for U.S.-born residents:
This state: 24,322Other state: 13,496Northeast: 462Midwest: 11,139South: 464West: 1,579 86.6% of West Fargo residents lived in the same house 1 years ago.
Out of people who lived in different houses, 33.2% lived in this county.
Out of people who lived in different counties, 18.6% lived in North Dakota.
West Fargo:
86.6%State average:
84.2%
Education attainment for males 25 years and older:
No schooling: 30Nursery to 4th grade: 05th and 6th grade: 07th and 8th grade: 349th grade: 1110th grade: 4711th grade: 5712th grade, no diploma: 79High school graduate (or equivalency): 2,590Less than 1 year of college: 866Some college more than 1 year, no degree: 2,053Associate degree: 1,681Bachelor's degree: 3,535Master's degree: 1,163Professional school degree: 462Doctorate degree: 173
Education attainment for females 25 years and older:
No schooling: 69Nursery to 4th grade: 425th and 6th grade: 07th and 8th grade: 309th grade: 010th grade: 2011th grade: 5812th grade, no diploma: 112High school graduate (or equivalency): 2,131Less than 1 year of college: 310Some college more than 1 year, no degree: 1,654Associate degree: 1,609Bachelor's degree: 4,583Master's degree: 1,142Professional school degree: 317Doctorate degree: 311
Housing units in structures:
One, detached: 8,491One, attached: 2,582Two: 3203 or 4: 4975 to 9: 42010 to 19: 87320 to 49: 1,98850 or more: 646Mobile homes: 603Housing units lacking complete plumbing facilities in 2022: 0.9%Housing units lacking complete kitchen facilities in 2022: 0.7%House/condo owner moved in on average 7 years ago
Renter moved in on average 1 years ago
Private vs. public school enrollment:
Students in private schools in grades 1 to 8 (elementary and middle school): 457 Here:
9.8%North Dakota:
8.4%
Students in private schools in grades 9 to 12 (high school): 73 Here:
3.4%North Dakota:
8.2%
Students in private undergraduate colleges: 239 Here:
11.1%North Dakota:
14.3%