Webster Groves, MO (Missouri) Houses and Residents
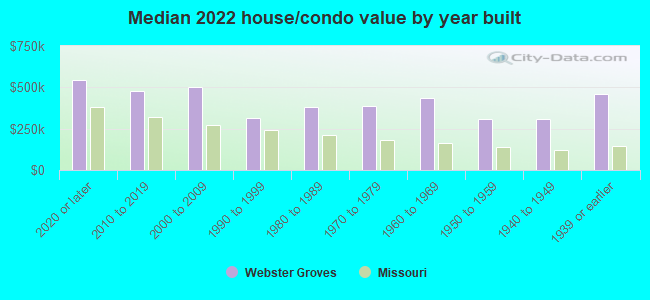
Estimated median house or condo value in 2022: $376,739 (it was $158,700 in 2000 )
Webster Groves:
$376,739Missouri:
$221,200
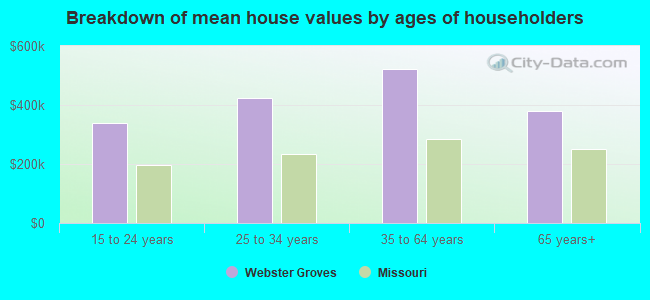
Lower value quartile - upper value quartile: $282,478 - $524,183Mean price in 2022: Detached houses: $458,655 Here:
$458,655State:
$278,068
Townhouses or other attached units: $272,867 Here:
$272,867State:
$260,773
In 5-or-more-unit structures: $304,960 Here:
$304,960State:
$263,082
Total population: 23,186 (Urban population: 23,064, Rural population: 0)
Houses: 10,122 (9,639 occupied: 7,124 owner occupied, 2,493 renter occupied )
% of renters here:
26%State:
32%
Housing density: 1,716 houses/condos per square mile
Median price asked for vacant for-sale houses and condos in 2022: $142,717.
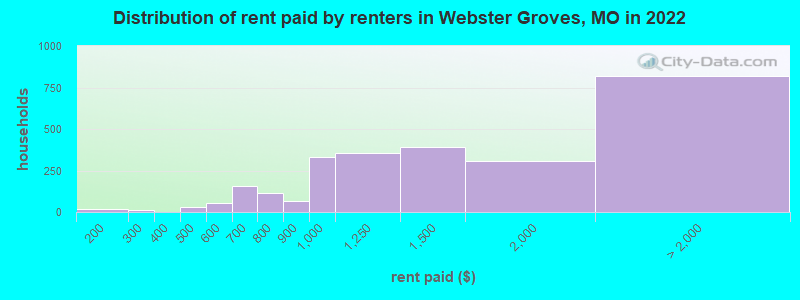
Median contract rent in 2022: $1,346 (lower quartile is $947, upper quartile is over $2,000)
Median rent asked for vacant for-rent units in 2022: $2,919
Median gross rent in Webster Groves, MO in 2022: $1,573
Housing units in Webster Groves with a mortgage: 5,250 (644 second mortgage, 8 home equity loan, 530 both second mortgage and home equity loan )Houses without a mortgage: 118
Median household income for houses/condos with a mortgage: $143,907
Median household income for apartments without a mortgage: $102,429
Median monthly housing costs: $1,698
Data:
Median house or condo value ($)
Median house or condo value ($ change since 2000)
Median house or condo value ($) - White
Median house or condo value ($) - Black or African American
Median house or condo value ($) - Asian
Median house or condo value ($) - Hispanic or Latino
Median house or condo value ($) - American Indian and Alaska Native
Median house or condo value ($) - Multirace
Median house or condo value ($) - Other Race
Median price asked for mobile homes ($)
Household density (households per square mile)
Mean house or condo value by units in structure - 1, detached ($)
Mean house or condo value by units in structure - 1, attached ($)
Mean house or condo value by units in structure - 2 ($)
Mean house or condo value by units in structure by units in structure - 3 or 4 ($)
Mean house or condo value by units in structure - 5 or more ($)
Mean house or condo value by units in structure - Boat, RV, van, etc. ($)
Mean house or condo value by units in structure - Mobile home ($)
Median contract rent ($)
Median contract rent - Lower quartile ($)
Median contract rent - Upper quartile ($)
Median gross rent ($)
Urban houses (%)
Rural houses (%)
Houses occupied (%)
Houses occupied (% change since 2000)
Houses owner occupied (%)
Houses owner occupied (% change since 2000)
Houses renter occupied (%)
Houses renter occupied (% change since 2000)
Vacant housing units - For rent (%)
Vacant housing units - For rent (% change since 2000)
Vacant housing units - For sale only (%)
Vacant housing units - For sale only (% change since 2000)
Vacant housing units - Rented or sold, not occupied (%)
Vacant housing units - Rented or sold, not occupied (% change since 2000)
Vacant housing units - For seasonal, recreational, or occasional use (%)
Vacant housing units - For seasonal, recreational, or occasional use (% change since 2000)
Vacant housing units - For migrant workers (%)
Vacant housing units - For migrant workers (% change since 2000)
Vacant housing units - Other vacant (%)
Vacant housing units - Other vacant (% change since 2000)
Median monthly housing costs ($)
Median household income for houses/condos with a mortgage ($)
Median household income for houses/condos without a mortgage ($)
Median household income ($)
Median household income ($) - White
Median household income ($) - Black or African American
Median household income ($) - Asian
Median household income ($) - Hispanic or Latino
Median household income ($) - American Indian and Alaska Native
Median household income ($) - Multirace
Median household income ($) - Other Race
Mortgage status - with mortgage (%)
Mortgage status - with second mortgage (%)
Mortgage status - with home equity loan (%)
Mortgage status - with both second mortgage and home equity loan (%)
Mortgage status - without a mortgage (%)
Median year house/condo built
Median year apartment built
Household type by relationship - Male householder living alone (%)
Household type by relationship - Male householder not living alone (%)
Household type by relationship - Female householder living alone (%)
Household type by relationship - Female householder not living alone (%)
Household type by relationship - Opposite-Sex spouse (%)
Household type by relationship - Same-Sex spouse (%)
Household type by relationship - Opposite-Sex unmarried partner (%)
Household type by relationship - Same-Sex unmarried partner (%)
Household type by relationship - In group quarters (%)
Size of family households - 2-person household (%)
Size of family households - 3-person household (%)
Size of family households - 4-person household (%)
Size of family households - 5-person household (%)
Size of family households - 6-person household (%)
Size of family households - 7-or-more-person household (%)
Size of nonfamily households - 1-person household (%)
Size of nonfamily households - 2-person household (%)
Size of nonfamily households - 3-person household (%)
Size of nonfamily households - 4-person household (%)
Size of nonfamily households - 5-person household (%)
Size of nonfamily households - 6-person household (%)
Size of nonfamily households - 7-or-moreperson household (%)
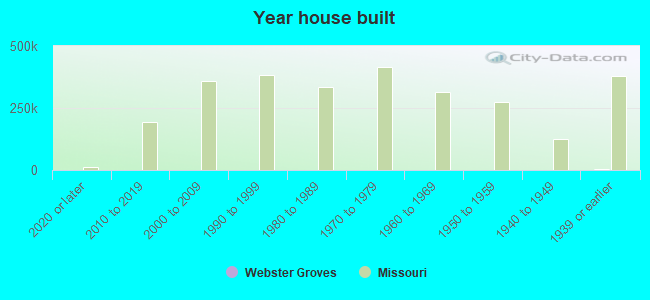
Year house built - Built 2010 or later (%)
Year house built - Built 2000 to 2009 (%)
Year house built - Built 1990 to 1999 (%)
Year house built - Built 1980 to 1989 (%)
Year house built - Built 1970 to 1979 (%)
Year house built - Built 1960 to 1969 (%)
Year house built - Built 1950 to 1959 (%)
Year house built - Built 1940 to 1949 (%)
Year house built - Built 1939 or earlier (%)
Median number of rooms in houses and condos
Median number of rooms in apartments
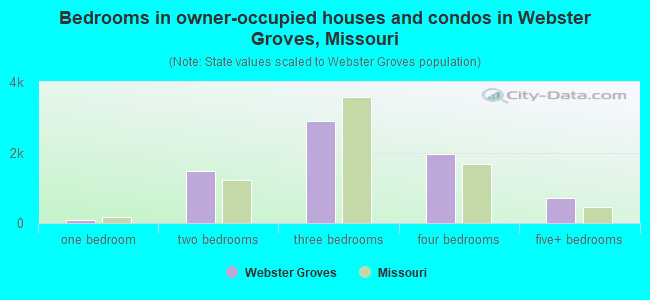
Median number of bedrooms in owner occupied houses
Mean number of bedrooms in owner occupied houses
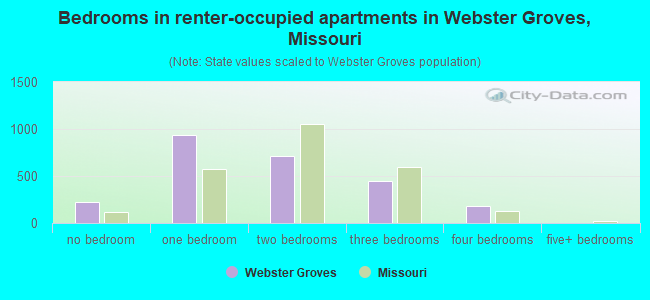
Median number of bedrooms in renter occupied houses
Mean number of bedrooms in renter occupied houses
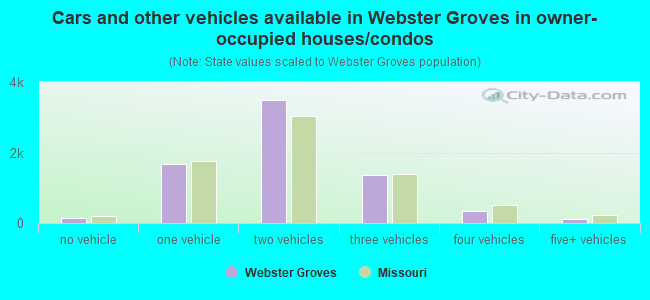
Median number of vehichles in owner occupied houses
Mean number of vehichles in owner occupied houses
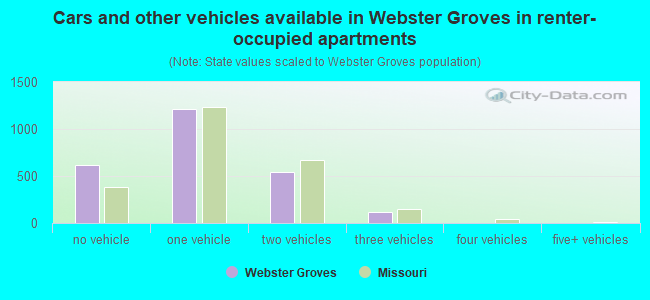
Median number of vehichles in renter occupied houses
Mean number of vehichles in renter occupied houses
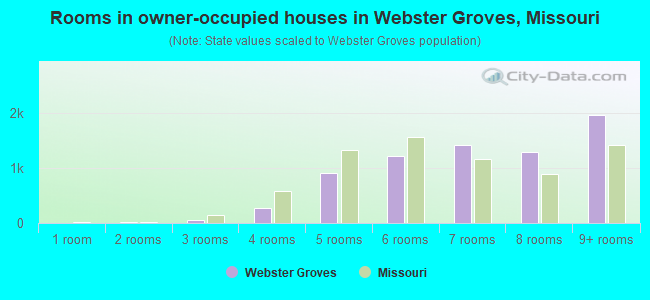
Rooms in owner-occupied houses - 1 room (%)
Rooms in owner-occupied houses - 2 rooms (%)
Rooms in owner-occupied houses - 3 rooms (%)
Rooms in owner-occupied houses - 4 rooms (%)
Rooms in owner-occupied houses - 5 rooms (%)
Rooms in owner-occupied houses - 6 rooms (%)
Rooms in owner-occupied houses - 7 rooms (%)
Rooms in owner-occupied houses - 8 rooms (%)
Rooms in owner-occupied houses - 9+ rooms (%)
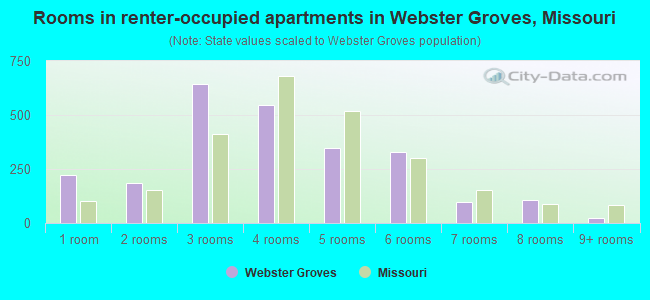
Rooms in renter-occupied houses - 1 room (%)
Rooms in renter-occupied houses - 2 rooms (%)
Rooms in renter-occupied houses - 3 rooms (%)
Rooms in renter-occupied houses - 4 rooms (%)
Rooms in renter-occupied houses - 5 rooms (%)
Rooms in renter-occupied houses - 6 rooms (%)
Rooms in renter-occupied houses - 7 rooms (%)
Rooms in renter-occupied houses - 8 rooms (%)
Rooms in renter-occupied houses - 9+ rooms (%)
Bedrooms in owner-occupied houses - no bedrooms (%)
Bedrooms in owner-occupied houses - 1 bedroom (%)
Bedrooms in owner-occupied houses - 2 bedrooms (%)
Bedrooms in owner-occupied houses - 3 bedrooms (%)
Bedrooms in owner-occupied houses - 4 bedrooms (%)
Bedrooms in owner-occupied houses - 5+ bedrooms (%)
Bedrooms in renter-occupied houses - no bedrooms (%)
Bedrooms in renter-occupied houses - 1 bedroom (%)
Bedrooms in renter-occupied houses - 2 bedrooms (%)
Bedrooms in renter-occupied houses - 3 bedrooms (%)
Bedrooms in renter-occupied houses - 4 bedrooms (%)
Bedrooms in renter-occupied houses - 5+ bedrooms (%)
Vehicles available in owner-occupied houses - no vehicle available (%)
Vehicles available in owner-occupied houses - 1 vehicle available(%)
Vehicles available in owner-occupied houses - 2 Vehicles available (%)
Vehicles available in owner-occupied houses - 3 Vehicles available (%)
Vehicles available in owner-occupied houses - 4 Vehicles available (%)
Vehicles available in owner-occupied houses - 5+ Vehicles available (%)
Vehicles available in renter-occupied houses - no vehicle available (%)
Vehicles available in renter-occupied houses - 1 vehicle available (%)
Vehicles available in renter-occupied houses - 2 Vehicles available (%)
Vehicles available in renter-occupied houses - 3 Vehicles available (%)
Vehicles available in renter-occupied houses - 4 Vehicles available (%)
Vehicles available in renter-occupied houses - 5+ Vehicles available (%)
Housing units in structures - 1, detached (%)
Housing units in structures - 1, attached (%)
Housing units in structures - 2 (%)
Housing units in structures - 3 or 4 (%)
Housing units in structures - 5 to 9 (%)
Housing units in structures - 10 to 19 (%)
Housing units in structures - 20 to 49 (%)
Housing units in structures - 50 or more (%)
Housing units in structures - Mobile home (%)
Housing units in structures - Boat, RV, van, etc. (%)
Housing units in structures - Owners - 1, detached (%)
Housing units in structures - Owners - 1, attached (%)
Housing units in structures - Owners - 2 (%)
Housing units in structures - Owners - 3 or 4 (%)
Housing units in structures - Owners - 5 to 9 (%)
Housing units in structures - Owners - 10 to 19 (%)
Housing units in structures - Owners - 20 to 49 (%)
Housing units in structures - Owners - 50 or more (%)
Housing units in structures - Owners - Mobile home (%)
Housing units in structures - Owners - Boat, RV, van, etc. (%)
Housing units in structures - Renters - 1, detached (%)
Housing units in structures - Renters - 1, attached (%)
Housing units in structures - Renters - 2 (%)
Housing units in structures - Renters - 3 or 4 (%)
Housing units in structures - Renters - 5 to 9 (%)
Housing units in structures - Renters - 10 to 19 (%)
Housing units in structures - Renters - 20 to 49 (%)
Housing units in structures - Renters - 50 or more (%)
Housing units in structures - Renters - Mobile home (%)
Housing units in structures - Renters - Boat, RV, van, etc. (%)
House/condo owner moved in on average (years ago)
Renter moved in on average (years ago)
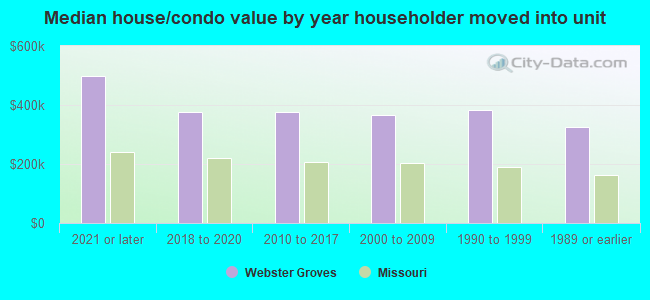
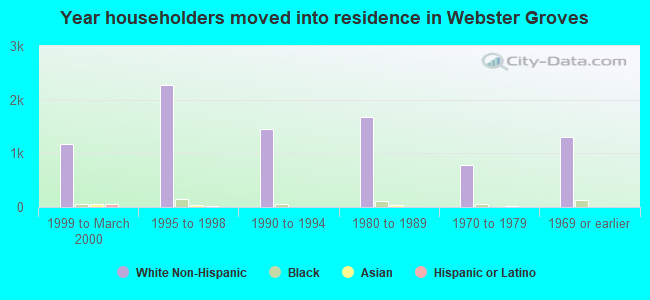
Year householder moved into unit - Moved in 1999 to March 2000 (%)
Year householder moved into unit - Moved in 1999 to March 2000 (%) - White
Year householder moved into unit - Moved in 1999 to March 2000 (%) - Black or African American
Year householder moved into unit - Moved in 1999 to March 2000 (%) - Asian
Year householder moved into unit - Moved in 1999 to March 2000 (%) - Hispanic or Latino
Year householder moved into unit - Moved in 1999 to March 2000 (%) - American Indian and Alaska Native
Year householder moved into unit - Moved in 1999 to March 2000 (%) - Multirace
Year householder moved into unit - Moved in 1999 to March 2000 (%) - Other Race
Year householder moved into unit - Moved in 1995 to 1998 (%)
Year householder moved into unit - Moved in 1995 to 1998 (%) - White
Year householder moved into unit - Moved in 1995 to 1998 (%) - Black or African American
Year householder moved into unit - Moved in 1995 to 1998 (%) - Asian
Year householder moved into unit - Moved in 1995 to 1998 (%) - Hispanic or Latino
Year householder moved into unit - Moved in 1995 to 1998 (%) - American Indian and Alaska Native
Year householder moved into unit - Moved in 1995 to 1998 (%) - Multirace
Year householder moved into unit - Moved in 1995 to 1998 (%) - Other Race
Year householder moved into unit - Moved in 1990 to 1994 (%)
Year householder moved into unit - Moved in 1990 to 1994 (%) - White
Year householder moved into unit - Moved in 1990 to 1994 (%) - Black or African American
Year householder moved into unit - Moved in 1990 to 1994 (%) - Asian
Year householder moved into unit - Moved in 1990 to 1994 (%) - Hispanic or Latino
Year householder moved into unit - Moved in 1990 to 1994 (%) - American Indian and Alaska Native
Year householder moved into unit - Moved in 1990 to 1994 (%) - Multirace
Year householder moved into unit - Moved in 1990 to 1994 (%) - Other Race
Year householder moved into unit - Moved in 1980 to 1989 (%)
Year householder moved into unit - Moved in 1980 to 1989 (%) - White
Year householder moved into unit - Moved in 1980 to 1989 (%) - Black or African American
Year householder moved into unit - Moved in 1980 to 1989 (%) - Asian
Year householder moved into unit - Moved in 1980 to 1989 (%) - Hispanic or Latino
Year householder moved into unit - Moved in 1980 to 1989 (%) - American Indian and Alaska Native
Year householder moved into unit - Moved in 1980 to 1989 (%) - Multirace
Year householder moved into unit - Moved in 1980 to 1989 (%) - Other Race
Year householder moved into unit - Moved in 1970 to 1979 (%)
Year householder moved into unit - Moved in 1970 to 1979 (%) - White
Year householder moved into unit - Moved in 1970 to 1979 (%) - Black or African American
Year householder moved into unit - Moved in 1970 to 1979 (%) - Asian
Year householder moved into unit - Moved in 1970 to 1979 (%) - Hispanic or Latino
Year householder moved into unit - Moved in 1970 to 1979 (%) - American Indian and Alaska Native
Year householder moved into unit - Moved in 1970 to 1979 (%) - Multirace
Year householder moved into unit - Moved in 1970 to 1979 (%) - Other Race
Year householder moved into unit - Moved in 1969 or earlier (%)
Year householder moved into unit - Moved in 1969 or earlier (%) - White
Year householder moved into unit - Moved in 1969 or earlier (%) - Black or African American
Year householder moved into unit - Moved in 1969 or earlier (%) - Asian
Year householder moved into unit - Moved in 1969 or earlier (%) - Hispanic or Latino
Year householder moved into unit - Moved in 1969 or earlier (%) - American Indian and Alaska Native
Year householder moved into unit - Moved in 1969 or earlier (%) - Multirace
Year householder moved into unit - Moved in 1969 or earlier (%) - Other Race
Housing units lacking complete plumbing facilities (%)
Housing units lacking complete kitchen facilities (%)
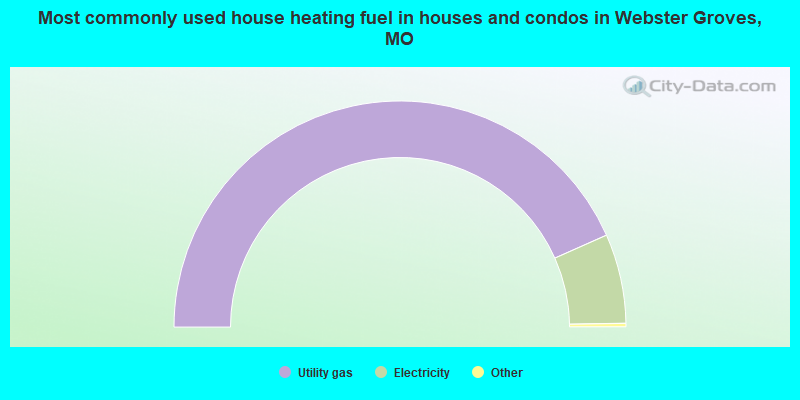
House heating fuel used in houses and condos - Utility gas (%)
House heating fuel used in houses and condos - Bottled, tank, or LP gas (%)
House heating fuel used in houses and condos - Electricity (%)
House heating fuel used in houses and condos - Fuel oil, kerosene, etc. (%)
House heating fuel used in houses and condos - Coal or coke (%)
House heating fuel used in houses and condos - Wood (%)
House heating fuel used in houses and condos - Solar energy (%)
House heating fuel used in houses and condos - Other fuel (%)
House heating fuel used in houses and condos - No fuel used (%)
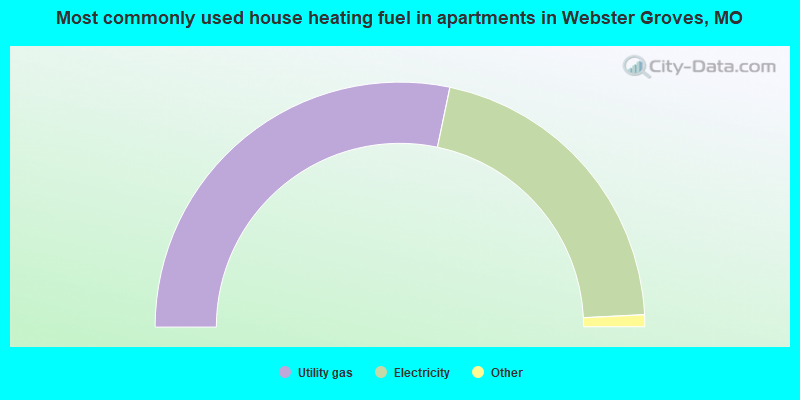
House heating fuel used in apartments - Utility gas (%)
House heating fuel used in apartments - Bottled, tank, or LP gas (%)
House heating fuel used in apartments - Electricity (%)
House heating fuel used in apartments - Fuel oil, kerosene, etc. (%)
House heating fuel used in apartments - Coal or coke (%)
House heating fuel used in apartments - Wood (%)
House heating fuel used in apartments - Solar energy (%)
House heating fuel used in apartments - Other fuel (%)
House heating fuel used in apartments - No fuel used (%)
Median year house/condo built: 1943Median year apartment built: 1968Household type by relationship:
Households: 23,616
Male householders: 4,356 (899 living alone ), Female householders: 5,171 (1,999 living alone )5,133 spouses (5,105 opposite-sex spouses ), 536 unmarried partners , (457 opposite-sex unmarried partners ), 6,740 children (6,442 natural , 178 adopted , 119 stepchildren ), 107 grandchildren , 66 brothers or sisters , 97 parents , 123 foster children , 58 other relatives , 348 non-relatives In group quarters: 874
Size of family households: 2,931 2-persons , 1,301 3-persons , 1,061 4-persons , 449 5-persons , 355 6-persons , 53 7-or-more-persons .
Size of nonfamily households: 2,867 1-person , 580 2-persons , 57 3-persons .
4,413 married couples with children. single-parent households (136 men , 458 women ).
95.7% of residents of Webster Groves speak English at home. of residents speak Spanish at home (76% speak English very well , 18% speak English well , 4% speak English not well , 2% don't speak English at all ).of residents speak other Indo-European language at home (100% speak English very well ).of residents speak Asian or Pacific Island language at home (76% speak English very well , 23% speak English well , 1% speak English not well ).
Foreign born population: 768 (3.3%)of them are naturalized citizens )
Median number of rooms in houses and condos:
Median number of rooms in apartments
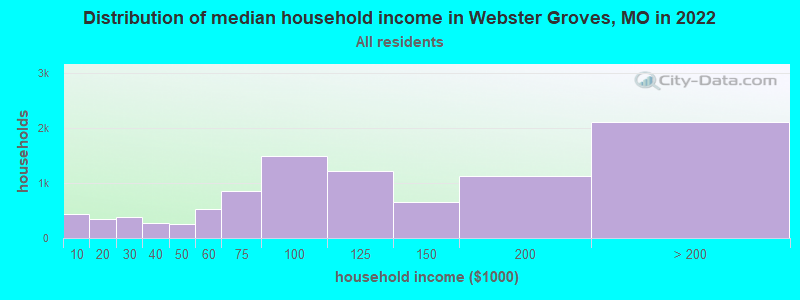
Webster Groves, MO household income distribution 443 Less than $10,000338 $10,000 to $19,999383 $20,000 to $29,999270 $30,000 to $39,999255 $40,000 to $49,999523 $50,000 to $59,999859 $60,000 to $74,9991,486 $75,000 to $99,9991,225 $100,000 to $124,999655 $125,000 to $149,9991,127 $150,000 to $199,9992,110 $200,000 or more
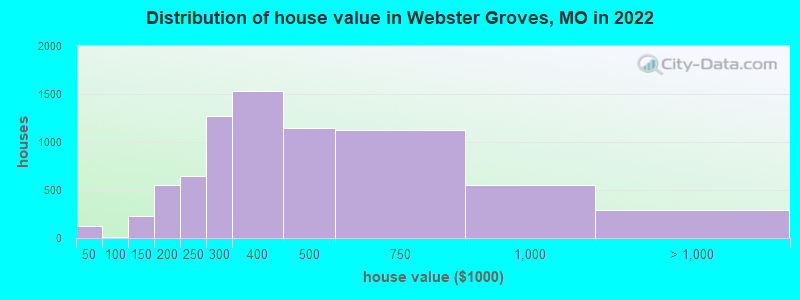
Home value of owner - occupied houses in 2022 in Webster Groves, MO 42 Less than $10,00051 $15,000 to $19,99923 $20,000 to $24,99911 $25,000 to $29,99910 $60,000 to $69,99993 $100,000 to $124,999134 $125,000 to $149,999233 $150,000 to $174,999312 $175,000 to $199,999642 $200,000 to $249,9991,275 $250,000 to $299,9991,533 $300,000 to $399,9991,148 $400,000 to $499,9991,120 $500,000 to $749,999546 $750,000 to $999,999243 $1,000,000 to $1,499,99923 $1,500,000 to $1,999,99921 $2,000,000 or moreRent paid by renters in 2022 in Webster Groves, MO 16 $100 to $14914 $250 to $29930 $400 to $44955 $500 to $549145 $600 to $6499 $650 to $699114 $750 to $79965 $800 to $899331 $900 to $999353 $1,000 to $1,249389 $1,250 to $1,499305 $1,500 to $1,99952 $2,000 to $2,499134 $2,500 to $2,99957 $3,000 to $3,499415 $3,500 or more159 No cash rent
Percentage of workers working in this county: 74.8%Number of people working at home: 2,955 (24.8% of all workers )
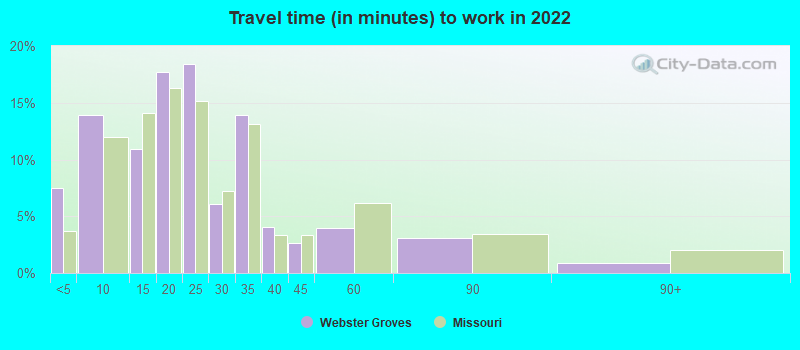
Travel time to work (commute)
Less than 5 minutes: 5995 to 9 minutes: 1,00110 to 14 minutes: 1,29015 to 19 minutes: 1,83420 to 24 minutes: 1,95725 to 29 minutes: 83130 to 34 minutes: 99435 to 39 minutes: 20540 to 44 minutes: 20645 to 59 minutes: 21260 to 89 minutes: 11590 or more minutes: 57
Means of transportation to work:
Drove a car alone: 7,367 (65.7%)Carpooled: 545 (4.9%)Bus : 221 (2.0%)Subway or elevated rail : 37 (0.3%)Light rail, streetcar or trolley : 103 (0.9%)Taxi: 131 (1.2%)Walked: 263 (2.3%)Worked at home: 2,955 (26.3%)
Unemployment by race in 2022
Unemployment rate for White non-Hispanic residents 2.6% Males2.0% FemalesUnemployment rate for Black residents 9.0% MalesUnemployment rate for Asian residents 14.2% FemalesUnemployment rate for two or more race residents 30.5% Males0.3% Females
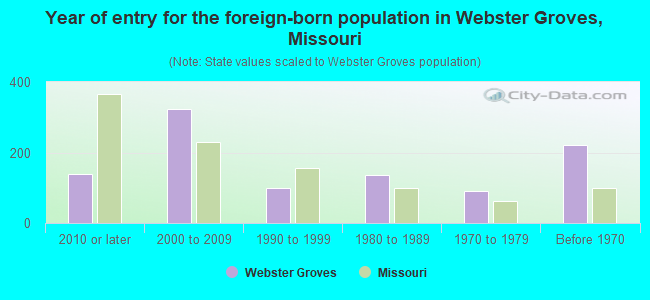
Year of entry for the foreign-born population in Webster Groves, Missouri
140 2010 or later 324 2000 to 2009 99 1990 to 1999 135 1980 to 1989 92 1970 to 1979 222 Before 1970
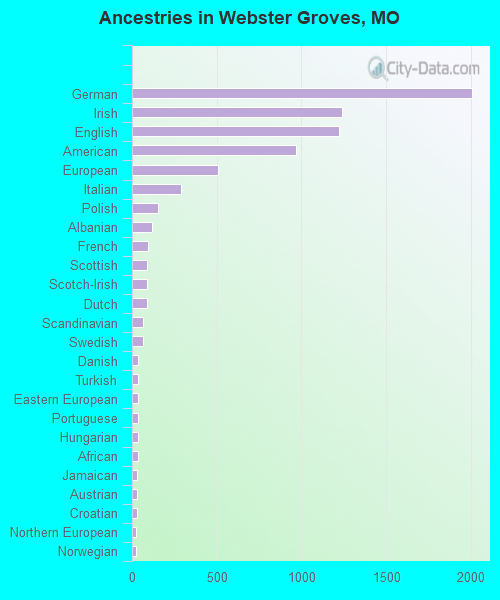
First ancestries reported:
German: 2,007 (21.5%)
Irish: 1,241 (13.3%)
English: 1,223 (13.1%)
American: 969 (10.4%)
European: 506 (5.4%)
Italian: 288 (3.1%)
Polish: 154 (1.7%)
Albanian: 116 (1.2%)
French: 95 (1.0%)
Scottish: 91 (1.0%)
Scotch-Irish: 90 (1.0%)
Dutch: 87 (0.9%)
Scandinavian: 66 (0.7%)
Swedish: 64 (0.7%)
Danish: 38 (0.4%)
Turkish: 38 (0.4%)
Eastern European: 36 (0.4%)
Portuguese: 35 (0.4%)
Hungarian: 35 (0.4%)
African: 34 (0.4%)
Jamaican: 30 (0.3%)
Austrian: 30 (0.3%)
Croatian: 27 (0.3%)
Northern European: 23 (0.2%)
Norwegian: 22 (0.2%)
Swiss: 20 (0.2%)
Lebanese: 19 (0.2%)
Welsh: 18 (0.2%)
Czech: 17 (0.2%)
Greek: 15 (0.2%)
Ukrainian: 14 (0.2%)
Belgian: 12 (0.1%)
Russian: 10 (0.1%)
Finnish: 10 (0.1%)
Cajun: 8 (0.09%)
British: 8 (0.09%)
Slovak: 8 (0.09%)
Canadian: 7 (0.08%)
Czechoslovakian: 4 (0.04%)
Australian: 4 (0.04%) Most common places of birth for foreign-born residents (%): England Webster Groves:
37.5% (284)Missouri:
1.1% (2,796)
Albania Webster Groves:
11.6% (88)Missouri:
0.4% (1,155)
India Webster Groves:
9.6% (73)Missouri:
8.9% (22,932)
Philippines Webster Groves:
5.5% (42)Missouri:
4.2% (10,873)
Kenya Webster Groves:
5.0% (38)Missouri:
1.7% (4,518)
China, excluding Hong Kong and Taiwan Webster Groves:
4.0% (30)Missouri:
6.6% (17,002)
Mexico Webster Groves:
4.0% (30)Missouri:
14.9% (38,568)
Japan Webster Groves:
3.8% (29)Missouri:
0.7% (1,818)
Belarus Webster Groves:
3.2% (24)Missouri:
0.3% (852)
United Kingdom, excluding England and Scotland Webster Groves:
3.0% (23)Missouri:
0.8% (2,138)
Turkey Webster Groves:
2.5% (19)Missouri:
0.4% (911)
Canada Webster Groves:
2.4% (18)Missouri:
1.9% (4,806)
Russia Webster Groves:
2.1% (16)Missouri:
1.5% (3,767)
Korea Webster Groves:
1.7% (13)Missouri:
2.9% (7,525)
Place of birth for U.S.-born residents:
This state: 15,473Other state: 7,205Northeast: 1,241Midwest: 3,557South: 1,588West: 847 88.6% of Webster Groves residents lived in the same house 1 years ago.
Out of people who lived in different houses, 30.1% lived in this county.
Out of people who lived in different counties, 40.0% lived in Missouri.
Webster Groves:
88.6%State average:
87.1%
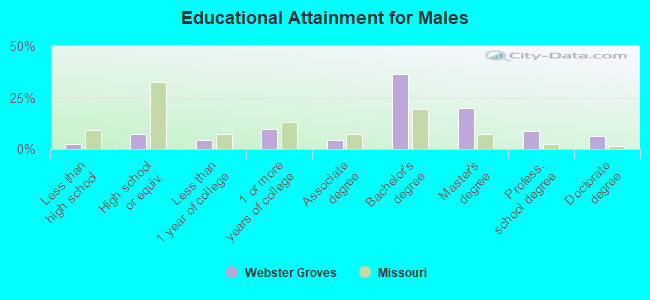
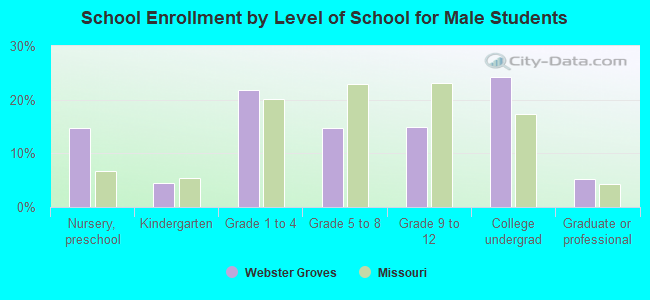
Education attainment for males 25 years and older:
No schooling: 21Nursery to 4th grade: 195th and 6th grade: 117th and 8th grade: 309th grade: 2210th grade: 811th grade: 4912th grade, no diploma: 28High school graduate (or equivalency): 538Less than 1 year of college: 317Some college more than 1 year, no degree: 695Associate degree: 322Bachelor's degree: 2,685Master's degree: 1,468Professional school degree: 648Doctorate degree: 473
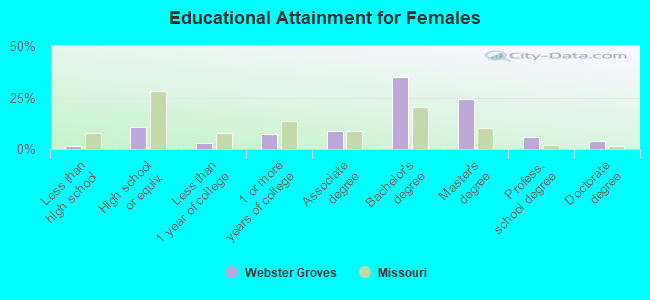
Education attainment for females 25 years and older:
No schooling: 8Nursery to 4th grade: 215th and 6th grade: 07th and 8th grade: 419th grade: 010th grade: 311th grade: 2612th grade, no diploma: 33High school graduate (or equivalency): 961Less than 1 year of college: 260Some college more than 1 year, no degree: 661Associate degree: 800Bachelor's degree: 3,123Master's degree: 2,196Professional school degree: 514Doctorate degree: 351
Housing units in structures:
One, detached: 7,871One, attached: 138Two: 843 or 4: 2285 to 9: 10110 to 19: 13220 to 49: 77750 or more: 788Housing units lacking complete plumbing facilities in 2022: 0.1%Housing units lacking complete kitchen facilities in 2022: 3.0%House/condo owner moved in on average 11 years ago
Renter moved in on average 1 years ago
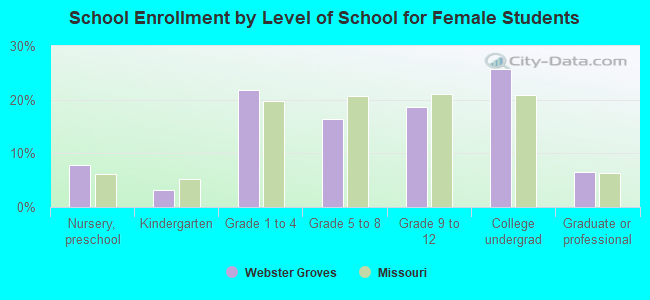
Private vs. public school enrollment:
Students in private schools in grades 1 to 8 (elementary and middle school): 383 Students in private schools in grades 9 to 12 (high school): 304 Students in private undergraduate colleges: 870