Wayland, MA (Massachusetts) Houses and Residents
| Wayland: | $1,098,383 |
| Massachusetts: | $534,700 |
Total population: 12,994 (Urban population: 11,926, Rural population: 1,174 (all nonfarm))
Houses: 4,735 (4,625 occupied: 4,236 owner occupied, 389 renter occupied)
| % of renters here: | 8% |
| State: | 38% |
Housing density: 311 houses/condos per square mile
Median price asked for vacant for-sale houses and condos in 2022 in this county: $1,068,910.
Median contract rent in 2022: $1,702 (lower quartile is $615, upper quartile is over $2,000)
Median gross rent in Wayland, MA in 2022: $1,963
Housing units in Wayland with a mortgage: 2,914 (355 second mortgage, 584 home equity loan, 0 both second mortgage and home equity loan)
Houses without a mortgage: 1,079
Compare current foreclosures near Wayland, MA:
| Photo | Address | Area | Beds / Baths | Price | Details |
|---|---|---|---|---|---|

|
#1
Overlook Rd
Wayland, MA 01778
|
4,219 sq. feet
|
3 baths 4 beds |
show details | |

|
#2
Maiden Ln
Wayland, MA 01778
|
1,405 sq. feet
|
2 baths 2 beds |
show details | |

|
#3
Stonebridge Rd
Wayland, MA 01778
|
1,337 sq. feet
|
1 baths 3 beds |
show details | |

|
#4
Old Connecticut Path
Wayland, MA 01778
|
2,394 sq. feet
|
2 baths 4 beds |
show details | |

|
#5
Indian Rock Rd
Wayland, MA 01778
|
- sq. feet
|
- baths - beds |
show details | |

|
#6
Boston Post Rd # C304
Wayland, MA 01778
|
- sq. feet
|
- baths - beds |
show details | |

|
#7
Rice Rd
Wayland, MA 01778
|
- sq. feet
|
- baths - beds |
show details | |

|
#8
Boyd St
Boston, MA 02124
|
3,970 sq. feet
|
3 baths 9 beds |
$650,000
|
show details |

|
#9
Stillman St
Framingham, MA 01702
|
1,122 sq. feet
|
1 baths 2 beds |
$290,000
|
show details |

|
#10
Main St Unit 8c
Hudson, MA 01749
|
890 sq. feet
|
2 baths 2 beds |
$322,400
|
show details |
| Photo | Address | Area | Beds / Baths | Price | Details |
|---|---|---|---|---|---|

|
#11
Adams St
Hyde Park, MA 02136
|
1,988 sq. feet
|
2 baths 4 beds |
$499,200
|
show details |

|
#12
Vine St
Melrose, MA 02176
|
2,056 sq. feet
|
2 baths 4 beds |
show details | |

|
#13
Ormond St
Mattapan, MA 02126
|
4,252 sq. feet
|
3 baths 7 beds |
show details | |

|
#14
Church Street
Boston, MA Array
|
3,663 sq. feet
|
3 baths 6 beds |
show details | |

|
#15
Kidder Ave
Somerville, MA 02144
|
2,831 sq. feet
|
6 baths 6 beds |
show details | |

|
#16
Savin St
Dedham, MA 02026
|
3,552 sq. feet
|
4 baths 4 beds |
show details | |

|
#17
Burget Ave
Medford, MA 02155
|
1,299 sq. feet
|
2 baths 3 beds |
show details | |

|
#18
Orchardhill Rd
Jamaica Plain, MA 02130
|
2,700 sq. feet
|
2 baths 5 beds |
show details | |

|
#19
Stafford St
Dedham, MA 02026
|
2,050 sq. feet
|
2 baths 5 beds |
show details | |

|
#20
Alwin St
Hyde Park, MA 02136
|
1,040 sq. feet
|
1 baths 3 beds |
show details |
| Photo | Address | Area | Beds / Baths | Price | Details |
|---|---|---|---|---|---|

|
#21
Poplar St
Roslindale, MA 02131
|
4,314 sq. feet
|
3 baths 9 beds |
show details | |

|
#22
Bolton St # A
Cambridge, MA 02140
|
1,047 sq. feet
|
3 baths 2 beds |
show details | |

|
#23
Brook St # 2
Brookline, MA 02445
|
726 sq. feet
|
1 baths 2 beds |
show details | |

|
#24
Congress Pl
Dedham, MA 02026
|
1,966 sq. feet
|
2 baths 4 beds |
show details | |

|
#25
Brahms St
Roslindale, MA 02131
|
1,604 sq. feet
|
1 baths 4 beds |
show details | |

|
#26
Pearson Ave
Somerville, MA 02144
|
3,104 sq. feet
|
3 baths 4 beds |
show details | |

|
#27
S Bolton Rd
Bolton, MA 01740
|
961 sq. feet
|
1 baths 2 beds |
show details | |

|
#28
Dedham St
Hyde Park, MA 02136
|
1,538 sq. feet
|
1 baths 3 beds |
show details | |

|
#29
Guild St
Boston, MA 02119
|
3,474 sq. feet
|
4 baths 9 beds |
show details | |

|
#30
Wakullah St
Boston, MA 02119
|
2,624 sq. feet
|
2 baths 5 beds |
show details |
| Photo | Address | Area | Beds / Baths | Price | Details |
|---|---|---|---|---|---|

|
#31
Harvard St
Mattapan, MA 02126
|
2,884 sq. feet
|
2 baths 6 beds |
show details | |

|
#32
Washington St
Hyde Park, MA 02136
|
3,131 sq. feet
|
3 baths 5 beds |
show details | |

|
#33
Crawford St
Boston, MA 02121
|
3,602 sq. feet
|
2 baths 5 beds |
show details | |

|
#34
Homestead St
Boston, MA 02121
|
3,727 sq. feet
|
3 baths 6 beds |
show details | |

|
#35
Thornton St
Boston, MA 02119
|
3,382 sq. feet
|
4 baths 5 beds |
show details | |

|
#36
Larchwood St
North Billerica, MA 01862
|
1,898 sq. feet
|
2 baths 3 beds |
show details | |

|
#37
Copley Dr
Northborough, MA 01532
|
2,910 sq. feet
|
3 baths 4 beds |
show details | |

|
#38
Tampa St
Hyde Park, MA 02136
|
1,050 sq. feet
|
1 baths 2 beds |
show details | |

|
#39
Melba Way
Hyde Park, MA 02136
|
1,904 sq. feet
|
2 baths 3 beds |
show details | |

|
#40
Hicks Ave Apt 12
Medford, MA 02155
|
1,749 sq. feet
|
2 baths 3 beds |
show details |
| Photo | Address | Area | Beds / Baths | Price | Details |
|---|---|---|---|---|---|

|
#41
W Walnut Park
Boston, MA 02119
|
3,216 sq. feet
|
2 baths 4 beds |
show details | |

|
#42
Exchange St
Millis, MA 02054
|
2,324 sq. feet
|
3 baths 4 beds |
show details | |

|
#43
Collins St
Hyde Park, MA 02136
|
1,092 sq. feet
|
1 baths 3 beds |
show details | |

|
#44
Laurel St
Somerville, MA 02143
|
4,078 sq. feet
|
6 baths 9 beds |
show details | |

|
#45
Burroughs Rd
Boxborough, MA 01719
|
3,566 sq. feet
|
5 baths 5 beds |
show details | |

|
#46
Keystone St
West Roxbury, MA 02132
|
1,464 sq. feet
|
1 baths 3 beds |
show details | |

|
#47
Everett Cir
Hopkinton, MA 01748
|
5,180 sq. feet
|
3 baths 4 beds |
show details | |

|
#48
King St
Watertown, MA 02472
|
1,344 sq. feet
|
3 baths 3 beds |
show details | |

|
#49
Church St
Marlborough, MA 01752
|
1,764 sq. feet
|
3 baths 4 beds |
show details | |

|
Check over 1 million property listings on Foreclosure.com!
|
browse all offers | |||
Latest news about housing in Wayland, MA collected exclusively by city-data.com from local newspapers, TV, and radio stations

 | How Much Massachusetts Households Make Per Year: Census Data (37 replies) |
| Affordable housing right across the street? (Wayland) (15 replies) |
| 2020 Real Estate Observations (623 replies) |
| Lexington, Concord, Lincoln, Wayland, Sudbury, Weston? (83 replies) |
| Popularity of Mid-Century Modern house in Boston suburbs? (18 replies) |
| Natick, Wayland, or Sudbury? (30 replies) |

Household type by relationship:
Households: 1,447,673- In family households: 1,161,600 (250,263 male householders, 116,393 female householders)
287,332 spouses, 410,462 children (392,286 natural, 9,871 adopted, 8,305 stepchildren), 16,644 grandchildren, 14,569 brothers or sisters, 15,064 parents, foster children, 15,023 other relatives, 25,838 non-relatives
- In nonfamily households: 286,073 (95,244 male householders (67,197 living alone)), 118,788 female householders (94,319 living alone)), 72,041 nonrelatives
- In group quarters: 55,412 (13,773 institutionalized population)
252,928 married couples with children.
55,356 single-parent households (9,721 men, 45,635 women).
88.6% of residents of Wayland speak English at home.
1.8% of residents speak Spanish at home (73% speak English very well, 13% speak English well, 14% speak English not well).
5.8% of residents speak other Indo-European language at home (88% speak English very well, 7% speak English well, 4% speak English not well).
3.6% of residents speak Asian or Pacific Island language at home (74% speak English very well, 20% speak English well, 6% speak English not well).
0.2% of residents speak other language at home (100% speak English very well).
Foreign born population: 1,939 (13.4%)
(81.2% of them are naturalized citizens)
| Here: | 8.1 |
| State: | 6.5 |
| Here: | 4.0 |
| State: | 4.0 |

- Bedrooms in owner-occupied houses and condos in Wayland, Massachusetts
- 0no bedroom
- 621 bedroom
- 6042 bedrooms
- 1,5313 bedrooms
- 1,5514 bedrooms
- 4885+ bedrooms

- Bedrooms in renter-occupied apartments in Wayland, Massachusetts
- 7no bedroom
- 1271 bedroom
- 1162 bedrooms
- 1133 bedrooms
- 264 bedrooms
- 05+ bedrooms

- Cars and other vehicles available in Wayland in owner-occupied houses/condos
- 55no vehicle
- 7251 vehicle
- 2,4802 vehicles
- 8143 vehicles
- 1484 vehicles
- 145+ vehicles

- Cars and other vehicles available in Wayland in renter-occupied apartments
- 61no vehicle
- 2191 vehicle
- 902 vehicles
- 193 vehicles
- 04 vehicles
- 05+ vehicles

- Rooms in owner-occupied houses in Wayland, Massachusetts
- 01 room
- 02 rooms
- 113 rooms
- 744 rooms
- 3555 rooms
- 7396 rooms
- 9017 rooms
- 8168 rooms
- 1,3409+ rooms

- Rooms in renter-occupied apartments in Wayland, Massachusetts
- 71 room
- 602 rooms
- 473 rooms
- 514 rooms
- 855 rooms
- 346 rooms
- 657 rooms
- 88 rooms
- 329+ rooms


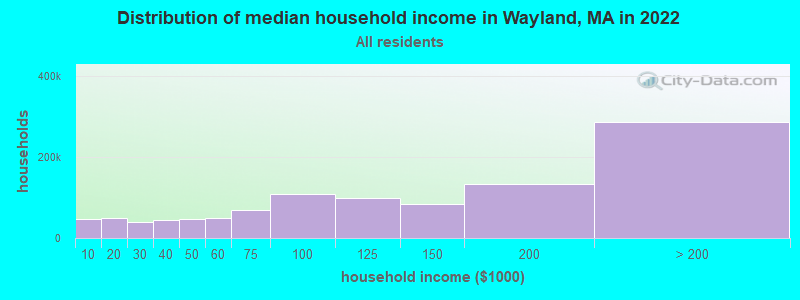
Wayland, MA household income distribution

- 47,429Less than $10,000
- 50,170$10,000 to $19,999
- 40,163$20,000 to $29,999
- 44,522$30,000 to $39,999
- 47,433$40,000 to $49,999
- 49,268$50,000 to $59,999
- 68,937$60,000 to $74,999
- 107,910$75,000 to $99,999
- 100,099$100,000 to $124,999
- 83,377$125,000 to $149,999
- 133,934$150,000 to $199,999
- 286,966$200,000 or more
Percentage of workers working in this county: 69.8%
Number of people working at home: 1,828 (24.7% of all workers)
Travel time to work (commute)
- Less than 5 minutes: 84
- 5 to 9 minutes: 332
- 10 to 14 minutes: 548
- 15 to 19 minutes: 696
- 20 to 24 minutes: 788
- 25 to 29 minutes: 463
- 30 to 34 minutes: 789
- 35 to 39 minutes: 388
- 40 to 44 minutes: 476
- 45 to 59 minutes: 868
- 60 to 89 minutes: 383
- 90 or more minutes: 115
Means of transportation to work:
- Drove a car alone: 5,160 (80.7%)
- Carpooled: 453 (7.1%)
- Bus or trolley bus: 50 (0.8%)
- Subway or elevated: 41 (0.6%)
- Railroad: 154 (2.4%)
- Bicycle: 19 (0.3%)
- Walked: 38 (0.6%)
- Other means: 15 (0.2%)
- Worked at home: 468 (7.3%)


- Year of entry for the foreign-born population in Wayland, Massachusetts
- 651995 to March 2000
- 591990 to 1994
- 1901985 to 1989
- 1391980 to 1984
- 971975 to 1979
- 1551970 to 1974
- 661965 to 1969
- 390Before 1965

First ancestries reported:
- Other: 2,797 (17.4%)
- Irish: 2,531 (15.8%)
- English: 2,053 (12.8%)
- Italian: 1,962 (12.2%)
- German: 1,434 (8.9%)
- Russian: 919 (5.7%)
- Polish: 706 (4.4%)
- French: 582 (3.6%)
- Scottish: 437 (2.7%)
- United States: 423 (2.6%)
- French Canadian: 360 (2.2%)
- Scotch-Irish: 282 (1.8%)
- Norwegian: 197 (1.2%)
- Swedish: 196 (1.2%)
- Dutch: 182 (1.1%)
- Ukrainian: 162 (1.0%)
- Lithuanian: 154 (1.0%)
- Czech: 115 (0.7%)
- Greek: 107 (0.7%)
- Hungarian: 103 (0.6%)
- Welsh: 88 (0.5%)
- Danish: 73 (0.5%)
- Swiss: 47 (0.3%)
- Portuguese: 45 (0.3%)
- Arab: 44 (0.3%)
- Subsaharan African: 24 (0.1%)
- Slovak: 13 (0.08%)
Most common places of birth for foreign-born residents (%):
| Wayland: | 11.2% (130) |
| Massachusetts: | 5.1% (39,255) |
| Wayland: | 9.7% (113) |
| Massachusetts: | 5.2% (40,247) |
| Wayland: | 8.7% (101) |
| Massachusetts: | 1.0% (7,937) |
| Wayland: | 7.8% (91) |
| Massachusetts: | 1.8% (13,543) |
| Wayland: | 7.8% (91) |
| Massachusetts: | 3.6% (28,086) |
| Wayland: | 7.3% (85) |
| Massachusetts: | 1.9% (14,883) |
| Wayland: | 7.2% (84) |
| Massachusetts: | 3.3% (25,403) |
| Wayland: | 5.3% (61) |
| Massachusetts: | 1.7% (13,456) |
| Wayland: | 4.9% (57) |
| Massachusetts: | 3.7% (28,319) |
| Wayland: | 3.4% (40) |
| Massachusetts: | 2.3% (17,449) |
| Wayland: | 2.0% (23) |
| Massachusetts: | 1.7% (12,975) |
| Wayland: | 2.0% (23) |
| Massachusetts: | 0.8% (6,023) |
| Wayland: | 1.9% (22) |
| Massachusetts: | 0.3% (2,470) |
| Wayland: | 1.8% (21) |
| Massachusetts: | 1.6% (12,350) |
| Wayland: | 1.7% (20) |
| Massachusetts: | 0.2% (1,729) |
| Wayland: | 1.6% (19) |
| Massachusetts: | 0.2% (1,855) |
| Wayland: | 1.6% (18) |
| Massachusetts: | 2.0% (15,286) |
Place of birth for U.S.-born residents:
- This state: 7,669
- Other state: 4,147
- Northeast: 2,505
- Midwest: 725
- South: 590
- West: 327
68% of Wayland residents lived in the same house 5 years ago.
Out of people who lived in different houses, 64% lived in this county.
Out of people who lived in different counties, 61% lived in Massachusetts.
Education attainment for males 25 years and older:
- No schooling: 0
- Nursery to 4th grade: 6
- 5th and 6th grade: 5
- 7th and 8th grade: 36
- 9th grade: 16
- 10th grade: 17
- 11th grade: 12
- 12th grade, no diploma: 52
- High school graduate (or equivalency): 397
- Less than 1 year of college: 88
- Some college more than 1 year, no degree: 250
- Associate degree: 205
- Bachelor's degree: 1,188
- Master's degree: 1,056
- Professional school degree: 439
- Doctorate degree: 380

Education attainment for females 25 years and older:
- No schooling: 0
- Nursery to 4th grade: 4
- 5th and 6th grade: 24
- 7th and 8th grade: 23
- 9th grade: 58
- 10th grade: 30
- 11th grade: 15
- 12th grade, no diploma: 18
- High school graduate (or equivalency): 628
- Less than 1 year of college: 171
- Some college more than 1 year, no degree: 447
- Associate degree: 338
- Bachelor's degree: 1,540
- Master's degree: 1,135
- Professional school degree: 244
- Doctorate degree: 146


Housing units in structures:
- One, detached: 4,066
- One, attached: 328
- Two: 130
- 3 or 4: 94
- 5 to 9: 32
- 10 to 19: 8
- 20 to 49: 21
- 50 or more: 56

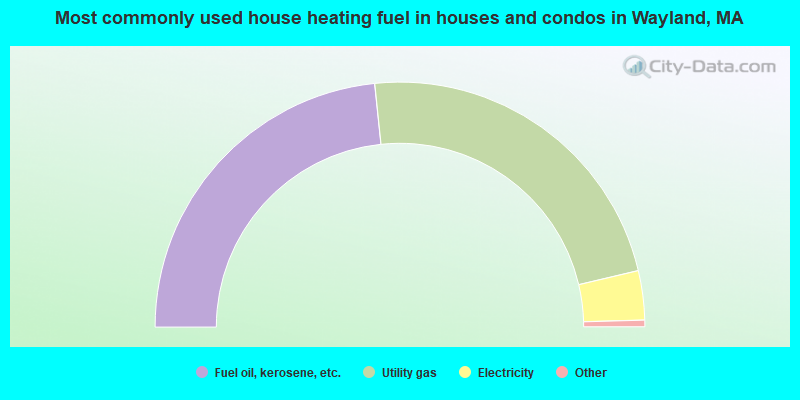
- 46.7%Fuel oil, kerosene, etc.
- 45.9%Utility gas
- 6.5%Electricity
- 0.8%Bottled, tank, or LP gas
- 0.2%Wood
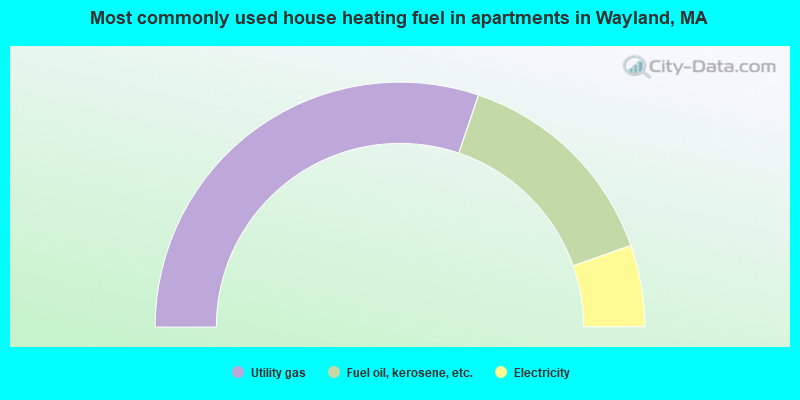
- 60.4%Utility gas
- 28.8%Fuel oil, kerosene, etc.
- 10.8%Electricity
Private vs. public school enrollment:
| Here: | 3.3% |
| Massachusetts: | 10.8% |
| Here: | 10.1% |
| Massachusetts: | 12.2% |
| Here: | 61.3% |
| Massachusetts: | 48.2% |


