Waverly, IA (Iowa) Houses and Residents
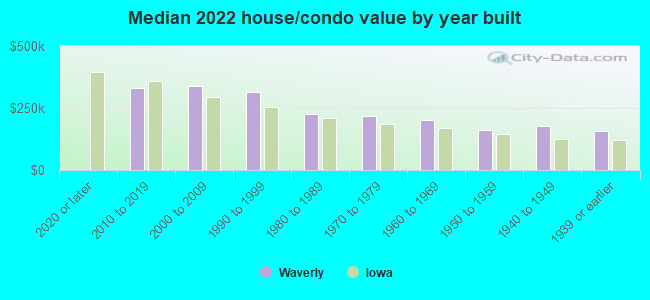
| Waverly: | $226,105 |
| Iowa: | $194,600 |
Mean price in 2022:
Detached houses: $276,037
Here: $276,037 State: $245,224 Townhouses or other attached units: $201,300
Here: $201,300 State: $238,767 In 5-or-more-unit structures: $141,564
Here: $141,564 State: $190,519 Mobile homes: $15,792
Here: $15,792 State: $51,271
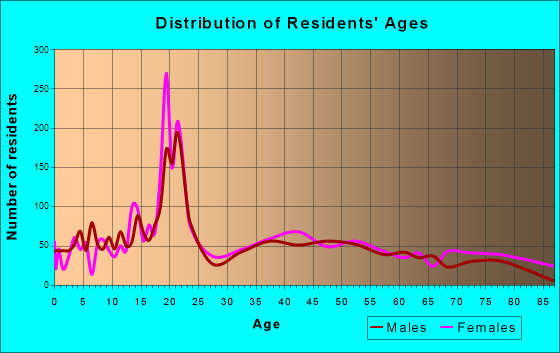
Total population: 10,106 (Urban population: 7,518 (all inside urban clusters), Rural population: 1,421 (57 farm, 1,364 nonfarm))
Houses: 4,141 (3,845 occupied: 2,985 owner occupied, 922 renter occupied)
| % of renters here: | 24% |
| State: | 28% |
Housing density: 371 houses/condos per square mile
Median price asked for vacant for-sale houses and condos in 2022 in this county: $135,653.
Median contract rent in 2022: $655 (lower quartile is $553, upper quartile is $861)
Median rent asked for vacant for-rent units in 2022: $612
Median gross rent in Waverly, IA in 2022: $839
Housing units in Waverly with a mortgage: 1,749 (201 second mortgage, 1 home equity loan, 174 both second mortgage and home equity loan)
Houses without a mortgage: 98
Median household income for houses/condos with a mortgage: $99,021
Median household income for apartments without a mortgage: $72,857
Median monthly housing costs: $949
Compare current foreclosures near Waverly, IA:
| Photo | Address | Area | Beds / Baths | Price | Details |
|---|---|---|---|---|---|

|
#1
Bridle Spur Ct
Waverly, IA 50677
|
1,805 sq. feet
|
5 baths 5 beds |
show details | |

|
#2
1st St SE
Waverly, IA 50677
|
1,305 sq. feet
|
5 baths 3 beds |
show details | |

|
#3
Elm St
Waverly, IA 50677
|
1,008 sq. feet
|
1 baths 3 beds |
show details | |

|
#4
1st Ave NE
Waverly, IA 50677
|
1,816 sq. feet
|
2 baths 5 beds |
show details | |

|
#5
1st St NW
Waverly, IA 50677
|
952 sq. feet
|
- baths 2 beds |
show details | |

|
#6
E Bremer Ave # 13
Waverly, IA 50677
|
- sq. feet
|
- baths - beds |
show details | |

|
#7
5th St NW
Waverly, IA 50677
|
- sq. feet
|
- baths - beds |
show details | |

|
#8
E Bremer Ave # 68
Waverly, IA 50677
|
- sq. feet
|
- baths - beds |
show details | |

|
#9
4th Ave SW
Waverly, IA 50677
|
- sq. feet
|
- baths - beds |
show details | |

|
#10
Longfellow Ave
Waterloo, IA 50703
|
900 sq. feet
|
1 baths 3 beds |
$174,900
|
show details |
| Photo | Address | Area | Beds / Baths | Price | Details |
|---|---|---|---|---|---|

|
#11
Oneida St
Waterloo, IA 50703
|
1,177 sq. feet
|
1 baths 3 beds |
$99,900
|
show details |

|
#12
Newton St
Waterloo, IA 50703
|
1,288 sq. feet
|
2 baths 3 beds |
show details | |

|
#13
Orchard Hill Dr
Cedar Falls, IA 50613
|
2,378 sq. feet
|
7 baths 5 beds |
show details | |

|
#14
Grandview Ave
Waterloo, IA 50703
|
1,142 sq. feet
|
2 baths 3 beds |
show details | |

|
#15
E Mount Vernon Rd
Waterloo, IA 50703
|
1,880 sq. feet
|
2 baths 4 beds |
show details | |

|
#16
Avon Ave
Waterloo, IA 50703
|
739 sq. feet
|
1 baths 2 beds |
show details | |

|
#17
Niles St
Waterloo, IA 50703
|
936 sq. feet
|
1 baths 3 beds |
show details | |

|
#18
N Walnut St
Shell Rock, IA 50670
|
1,584 sq. feet
|
2 baths 4 beds |
show details | |

|
#19
Broadway St
Waterloo, IA 50703
|
972 sq. feet
|
1 baths 2 beds |
show details | |

|
#20
Dawson St
Waterloo, IA 50703
|
676 sq. feet
|
1 baths 2 beds |
show details |
| Photo | Address | Area | Beds / Baths | Price | Details |
|---|---|---|---|---|---|

|
#21
Fairfield St
Waterloo, IA 50703
|
1,066 sq. feet
|
1 baths 2 beds |
show details | |

|
#22
Kirkwood Ave
Waterloo, IA 50701
|
1,154 sq. feet
|
3 baths 3 beds |
show details | |

|
#23
W Water St
Shell Rock, IA 50670
|
764 sq. feet
|
1 baths 2 beds |
show details | |

|
#24
Angeles Dr
Waterloo, IA 50703
|
1,689 sq. feet
|
2 baths 3 beds |
show details | |

|
#25
Goodell Ave
Readlyn, IA 50668
|
1,104 sq. feet
|
2 baths 2 beds |
show details | |

|
#26
Sumner St
Waterloo, IA 50703
|
1,970 sq. feet
|
2 baths 5 beds |
show details | |

|
#27
W 9th St
Cedar Falls, IA 50613
|
2,013 sq. feet
|
3 baths 5 beds |
show details | |

|
#28
E Lone Tree Rd
Cedar Falls, IA 50613
|
1,120 sq. feet
|
1 baths 2 beds |
show details | |

|
#29
Westland Ave
Waterloo, IA 50701
|
936 sq. feet
|
1 baths 3 beds |
show details | |

|
#30
W 2nd St
Cedar Falls, IA 50613
|
720 sq. feet
|
1 baths 2 beds |
show details |
| Photo | Address | Area | Beds / Baths | Price | Details |
|---|---|---|---|---|---|

|
#31
Downing Ave
Waterloo, IA 50701
|
950 sq. feet
|
3 baths 2 beds |
show details | |

|
#32
W 1st St
Cedar Falls, IA 50613
|
1,152 sq. feet
|
3 baths 3 beds |
show details | |

|
#33
Logan Ave
Waterloo, IA 50703
|
1,424 sq. feet
|
3 baths 3 beds |
show details | |

|
#34
Newton St
Waterloo, IA 50703
|
720 sq. feet
|
1 baths 2 beds |
show details | |

|
#35
W Parker St
Waterloo, IA 50703
|
856 sq. feet
|
1 baths 1 beds |
show details | |

|
#36
Downing Ave
Waterloo, IA 50701
|
1,144 sq. feet
|
1 baths 4 beds |
show details | |

|
#37
Saint Andrews Ave
Waterloo, IA 50701
|
1,418 sq. feet
|
2 baths 2 beds |
show details | |

|
#38
Quesada Ave
Cedar Falls, IA 50613
|
2,004 sq. feet
|
2 baths 2 beds |
show details | |

|
#39
Ricker St
Waterloo, IA 50703
|
1,024 sq. feet
|
1 baths 3 beds |
show details | |

|
#40
Sager Ave
Waterloo, IA 50701
|
932 sq. feet
|
2 baths 2 beds |
show details |
| Photo | Address | Area | Beds / Baths | Price | Details |
|---|---|---|---|---|---|

|
#41
E Dunkerton Rd
Waterloo, IA 50703
|
1,452 sq. feet
|
3 baths 4 beds |
show details | |

|
#42
Letsch Rd
Waterloo, IA 50701
|
1,204 sq. feet
|
2 baths 3 beds |
show details | |

|
#43
Riverside Dr
Waterloo, IA 50703
|
1,284 sq. feet
|
1 baths 2 beds |
show details | |

|
#44
Boston Ave
Waterloo, IA 50703
|
1,012 sq. feet
|
1 baths 4 beds |
show details | |

|
#45
Winslow Rd
Janesville, IA 50647
|
1,651 sq. feet
|
1 baths 3 beds |
show details | |

|
#46
Ford Rd
Cedar Falls, IA 50613
|
1,582 sq. feet
|
2 baths 3 beds |
show details | |

|
#47
Norris Ct
Waterloo, IA 50701
|
1,435 sq. feet
|
1 baths 3 beds |
show details | |

|
#48
Lakeside St
Waterloo, IA 50703
|
1,092 sq. feet
|
1 baths 3 beds |
show details | |

|
#49
W Dale St
Waterloo, IA 50703
|
1,113 sq. feet
|
1 baths 3 beds |
show details | |

|
Check over 1 million property listings on Foreclosure.com!
|
browse all offers | |||

Latest news about housing in Waverly, IA collected exclusively by city-data.com from local newspapers, TV, and radio stations

 | Iowa looks beautiful....but then comes the taxes.... (51 replies) |
| Considering Moving to Waterloo, IA...work?...Rent costs? Cost of living (12 replies) |
| Relocating to Waverly, Housing Needed (0 replies) |
| Waverly, Cedar Falls/Waterloo (10 replies) |
| Looking for the perfect small town in Iowa ! (102 replies) |
| Drive through Iowa or Wisconsin? (32 replies) |
Median year apartment built: 1976
Household type by relationship:
Households: 10,437- Male householders: 1,868 (306 living alone), Female householders: 1,933 (702 living alone)
2,080 spouses (2,072 opposite-sex spouses), 254 unmarried partners, (254 opposite-sex unmarried partners), 2,404 children (2,281 natural, 45 adopted, 78 stepchildren), 59 grandchildren, 22 brothers or sisters, 29 parents, 0 foster children, 53 other relatives, 305 non-relatives
- In group quarters: 1,426
Size of family households: 1,446 2-persons, 443 3-persons, 352 4-persons, 283 5-persons, 50 6-persons, 10 7-or-more-persons.
Size of nonfamily households: 1,048 1-person, 237 2-persons, 16 3-persons, 21 4-persons.
1,473 married couples with children.
507 single-parent households (156 men, 351 women).
95.7% of residents of Waverly speak English at home.
1.2% of residents speak Spanish at home (100% speak English very well).
1.0% of residents speak other Indo-European language at home (92% speak English very well, 8% speak English well).
1.0% of residents speak Asian or Pacific Island language at home (19% speak English very well, 30% speak English well, 52% speak English not well).
1.3% of residents speak other language at home (14% speak English very well, 66% speak English well, 21% speak English not well).
Foreign born population: 452 (4.3%)
(62.8% of them are naturalized citizens)
| Here: | 7.2 |
| State: | 6.8 |
| Here: | 4.0 |
| State: | 4.2 |
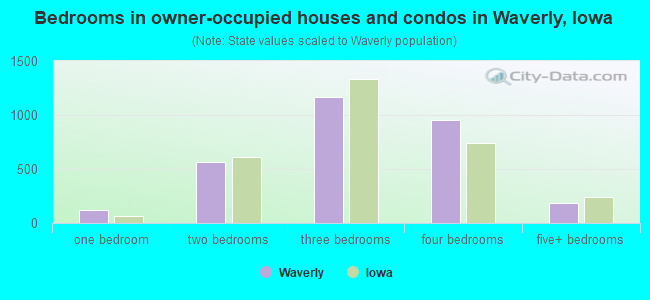
- Bedrooms in owner-occupied houses and condos in Waverly, Iowa
- 0no bedroom
- 1181 bedroom
- 5662 bedrooms
- 1,1633 bedrooms
- 9504 bedrooms
- 1895+ bedrooms
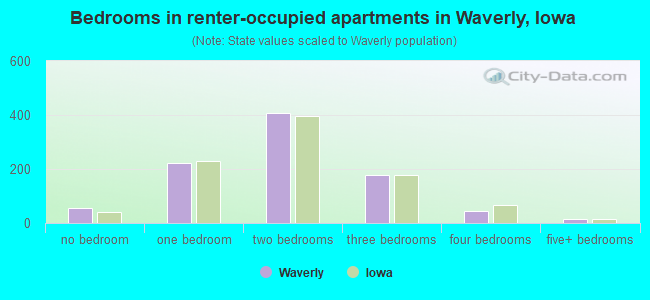
- Bedrooms in renter-occupied apartments in Waverly, Iowa
- 57no bedroom
- 2231 bedroom
- 4082 bedrooms
- 1773 bedrooms
- 444 bedrooms
- 135+ bedrooms
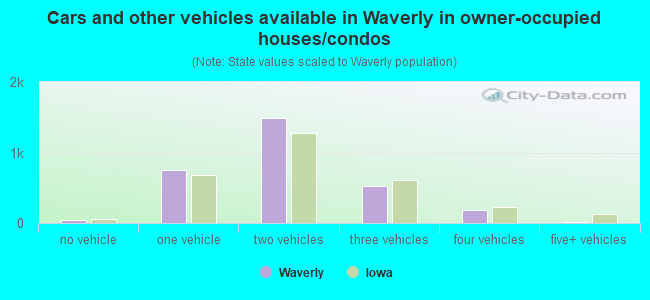
- Cars and other vehicles available in Waverly in owner-occupied houses/condos
- 38no vehicle
- 7451 vehicle
- 1,4852 vehicles
- 5263 vehicles
- 1804 vehicles
- 125+ vehicles
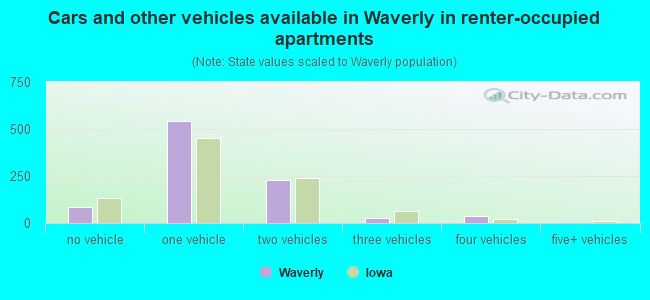
- Cars and other vehicles available in Waverly in renter-occupied apartments
- 85no vehicle
- 5431 vehicle
- 2312 vehicles
- 263 vehicles
- 384 vehicles
- 05+ vehicles
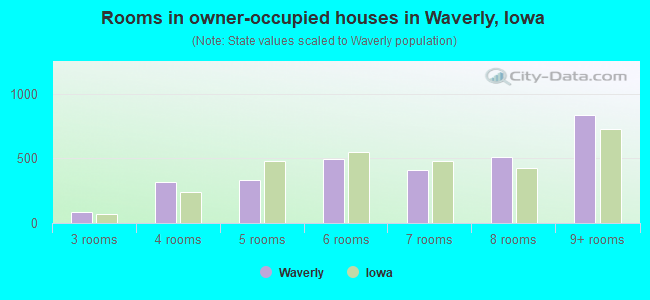
- Rooms in owner-occupied houses in Waverly, Iowa
- 01 room
- 02 rooms
- 853 rooms
- 3144 rooms
- 3345 rooms
- 4976 rooms
- 4117 rooms
- 5118 rooms
- 8359+ rooms
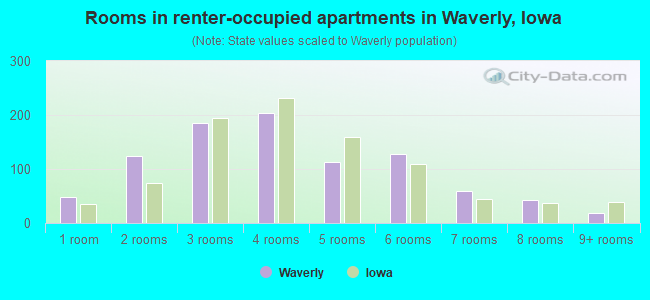
- Rooms in renter-occupied apartments in Waverly, Iowa
- 481 room
- 1252 rooms
- 1853 rooms
- 2034 rooms
- 1135 rooms
- 1276 rooms
- 607 rooms
- 428 rooms
- 199+ rooms
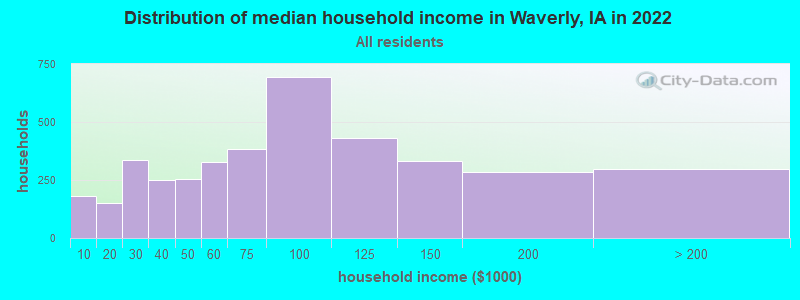
Waverly, IA household income distribution

- 183Less than $10,000
- 153$10,000 to $19,999
- 337$20,000 to $29,999
- 248$30,000 to $39,999
- 255$40,000 to $49,999
- 326$50,000 to $59,999
- 383$60,000 to $74,999
- 695$75,000 to $99,999
- 431$100,000 to $124,999
- 332$125,000 to $149,999
- 285$150,000 to $199,999
- 297$200,000 or more
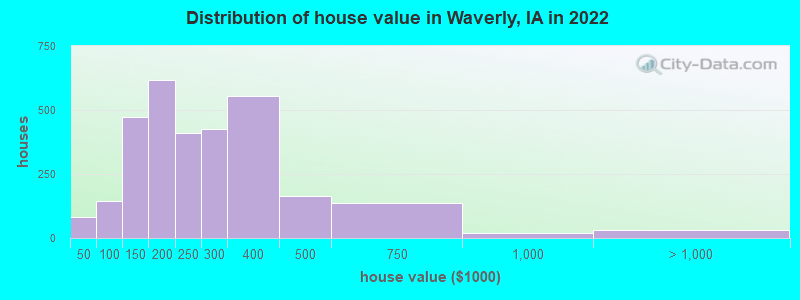
Home value of owner - occupied houses in 2022 in Waverly, IA
-
- 26$10,000 to $14,999
- 33$15,000 to $19,999
- 9$20,000 to $24,999
- 12$35,000 to $39,999
- 33$50,000 to $59,999
- 18$60,000 to $69,999
- 27$70,000 to $79,999
- 43$80,000 to $89,999
- 21$90,000 to $99,999
- 219$100,000 to $124,999
- 253$125,000 to $149,999
- 370$150,000 to $174,999
- 247$175,000 to $199,999
- 411$200,000 to $249,999
- 426$250,000 to $299,999
- 556$300,000 to $399,999
- 162$400,000 to $499,999
- 135$500,000 to $749,999
- 19$750,000 to $999,999
- 31$1,500,000 to $1,999,999
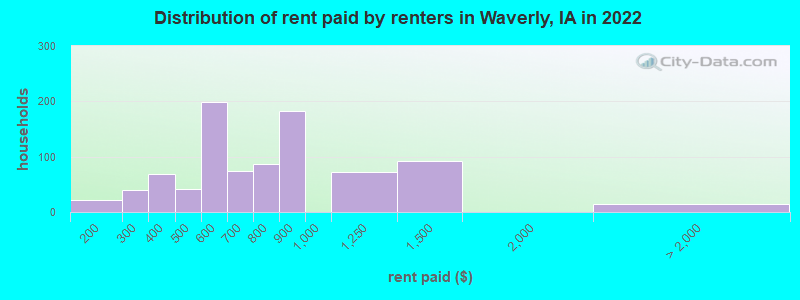
Rent paid by renters in 2022 in Waverly, IA
-
- 7$100 to $149
- 13$150 to $199
- 24$200 to $249
- 15$250 to $299
- 55$300 to $349
- 12$350 to $399
- 9$400 to $449
- 32$450 to $499
- 42$500 to $549
- 155$550 to $599
- 43$600 to $649
- 30$650 to $699
- 47$700 to $749
- 39$750 to $799
- 182$800 to $899
- 73$1,000 to $1,249
- 93$1,250 to $1,499
- 13No cash rent
Percentage of workers working in this county: 69.7%
Number of people working at home: 545 (10.4% of all workers)
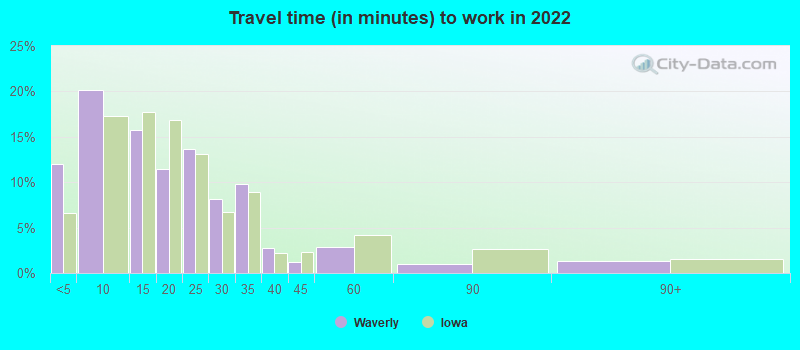
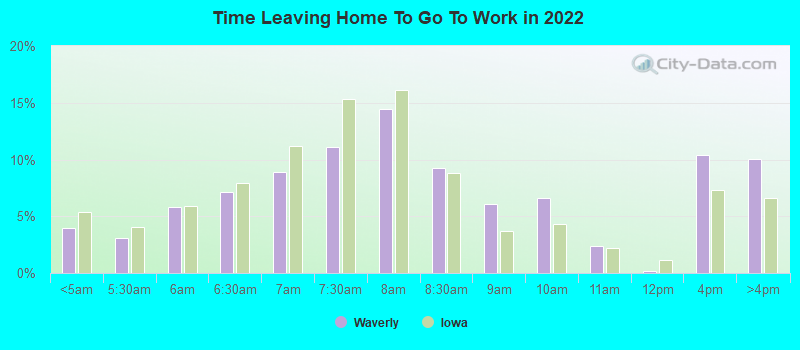
Travel time to work (commute)
- Less than 5 minutes: 770
- 5 to 9 minutes: 1,220
- 10 to 14 minutes: 729
- 15 to 19 minutes: 297
- 20 to 24 minutes: 399
- 25 to 29 minutes: 450
- 30 to 34 minutes: 479
- 35 to 39 minutes: 143
- 40 to 44 minutes: 34
- 45 to 59 minutes: 67
- 60 to 89 minutes: 63
- 90 or more minutes: 55
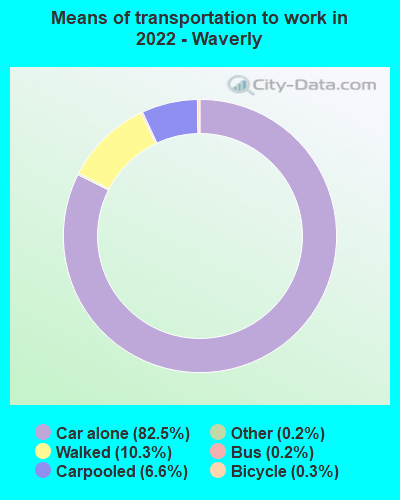
Means of transportation to work:
- Drove a car alone: 5,144 (75.1%)
- Carpooled: 432 (6.3%)
- Bus: 11 (0.2%)
- Taxi: 9 (0.1%)
- Bicycle: 22 (0.3%)
- Walked: 641 (9.4%)
- Worked at home: 545 (8.0%)
- Unemployment by race in 2022
- Unemployment rate for White non-Hispanic residents
- 1.9%Males
- 2.3%Females
- Unemployment rate for Black residents
- 10.6%Males
- Unemployment rate for two or more race residents
- 3.7%Males
- Unemployment rate for Hispanic or Latino residents
- 1.6%Males
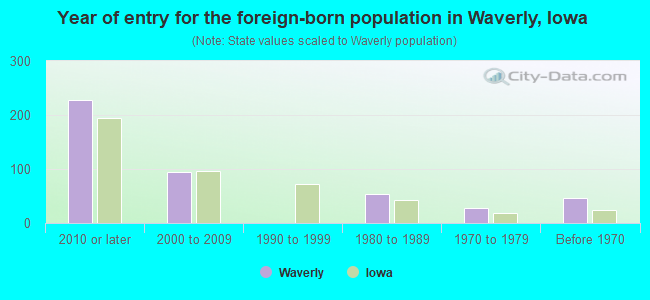
- Year of entry for the foreign-born population in Waverly, Iowa
- 2282010 or later
- 952000 to 2009
- 01990 to 1999
- 531980 to 1989
- 271970 to 1979
- 47Before 1970
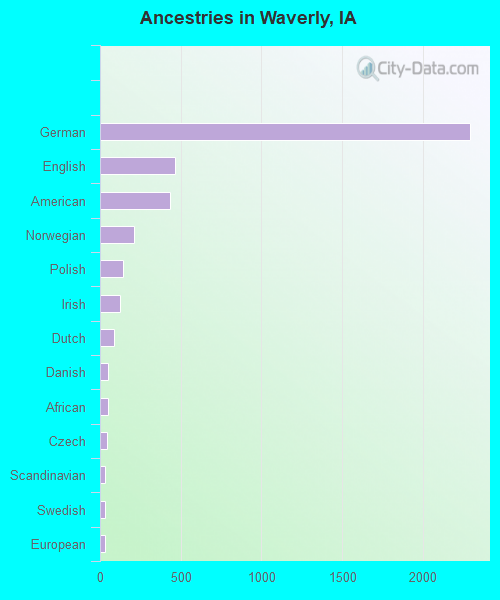
First ancestries reported:
- German: 2,295 (48.8%)
- English: 465 (9.9%)
- American: 433 (9.2%)
- Norwegian: 210 (4.5%)
- Polish: 143 (3.0%)
- Irish: 121 (2.6%)
- Dutch: 86 (1.8%)
- Danish: 52 (1.1%)
- African: 49 (1.0%)
- Czech: 46 (1.0%)
- Scandinavian: 32 (0.7%)
- Swedish: 29 (0.6%)
- European: 28 (0.6%)
- British: 14 (0.3%)
- Welsh: 13 (0.3%)
- Yugoslavian: 13 (0.3%)
- French: 9 (0.2%)
- Eastern European: 7 (0.1%)
- Scotch-Irish: 7 (0.1%)
- French Canadian: 6 (0.1%)
- Luxembourger: 5 (0.1%)
- Scottish: 5 (0.1%)
- Italian: 4 (0.09%)
- Ethiopian: 3 (0.06%)
- Canadian: 2 (0.04%)
Most common places of birth for foreign-born residents (%):
| Waverly: | 15.7% (68) |
| Iowa: | 0.2% (352) |
| Waverly: | 14.4% (62) |
| Iowa: | 0.7% (1,227) |
| Waverly: | 12.7% (55) |
| Iowa: | 1.0% (1,858) |
| Waverly: | 11.8% (51) |
| Iowa: | 4.6% (8,194) |
| Waverly: | 8.8% (38) |
| Iowa: | 2.0% (3,595) |
| Waverly: | 4.9% (21) |
| Iowa: | 0.2% (441) |
| Waverly: | 4.9% (21) |
| Iowa: | 3.2% (5,672) |
| Waverly: | 4.6% (20) |
| Iowa: | 0.5% (898) |
| Waverly: | 4.4% (19) |
| Iowa: | 2.9% (5,155) |
| Waverly: | 3.7% (16) |
| Iowa: | 3.2% (5,751) |
| Waverly: | 2.8% (12) |
| Iowa: | 0.1% (210) |
| Waverly: | 1.9% (8) |
| Iowa: | 0.0% (74) |
| Waverly: | 1.9% (8) |
| Iowa: | 6.2% (11,148) |
| Waverly: | 1.9% (8) |
| Iowa: | 0.8% (1,507) |
| Waverly: | 1.6% (7) |
| Iowa: | 1.6% (2,873) |
Place of birth for U.S.-born residents:
- This state: 7,777
- Other state: 2,128
- Northeast: 92
- Midwest: 1,512
- South: 234
- West: 284
81.4% of Waverly residents lived in the same house 1 years ago.
Out of people who lived in different houses, 20.7% lived in this county.
Out of people who lived in different counties, 79.0% lived in Iowa.
| Waverly: | 81.4% |
| State average: | 87.2% |
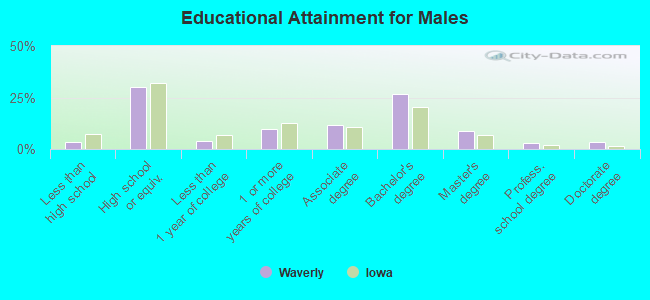
Education attainment for males 25 years and older:
- No schooling: 0
- Nursery to 4th grade: 0
- 5th and 6th grade: 4
- 7th and 8th grade: 2
- 9th grade: 31
- 10th grade: 15
- 11th grade: 35
- 12th grade, no diploma: 14
- High school graduate (or equivalency): 881
- Less than 1 year of college: 111
- Some college more than 1 year, no degree: 279
- Associate degree: 344
- Bachelor's degree: 789
- Master's degree: 253
- Professional school degree: 79
- Doctorate degree: 104
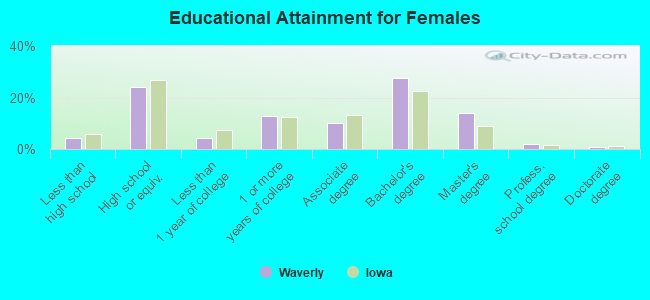
Education attainment for females 25 years and older:
- No schooling: 22
- Nursery to 4th grade: 0
- 5th and 6th grade: 11
- 7th and 8th grade: 4
- 9th grade: 22
- 10th grade: 50
- 11th grade: 14
- 12th grade, no diploma: 24
- High school graduate (or equivalency): 830
- Less than 1 year of college: 144
- Some college more than 1 year, no degree: 449
- Associate degree: 346
- Bachelor's degree: 957
- Master's degree: 488
- Professional school degree: 72
- Doctorate degree: 21
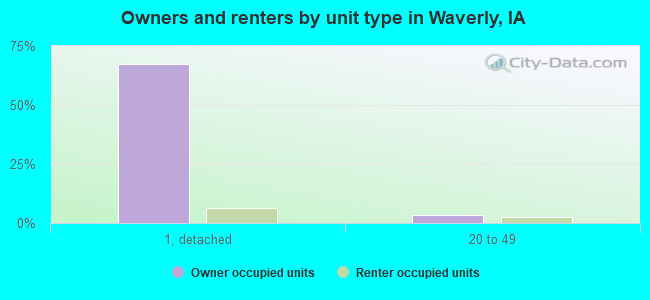
Housing units in structures:
- One, detached: 2,953
- One, attached: 189
- Two: 141
- 3 or 4: 133
- 5 to 9: 163
- 10 to 19: 185
- 20 to 49: 185
- 50 or more: 95
- Mobile homes: 92
Housing units lacking complete kitchen facilities in 2022: 1.3%
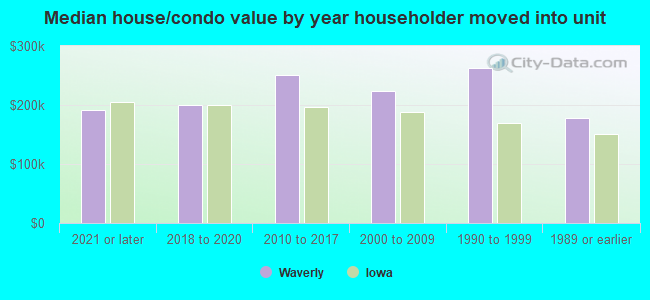
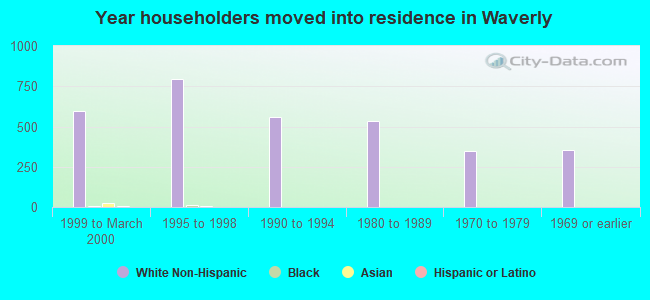
House/condo owner moved in on average 8 years ago
Renter moved in on average 3 years ago
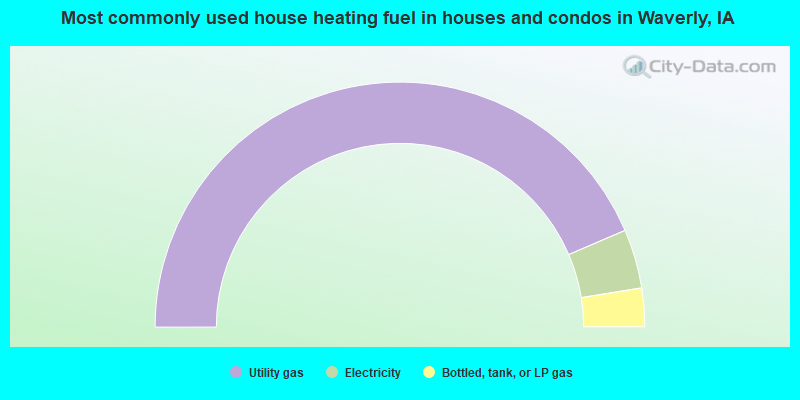
- 87.1%Utility gas
- 7.8%Electricity
- 5.1%Bottled, tank, or LP gas
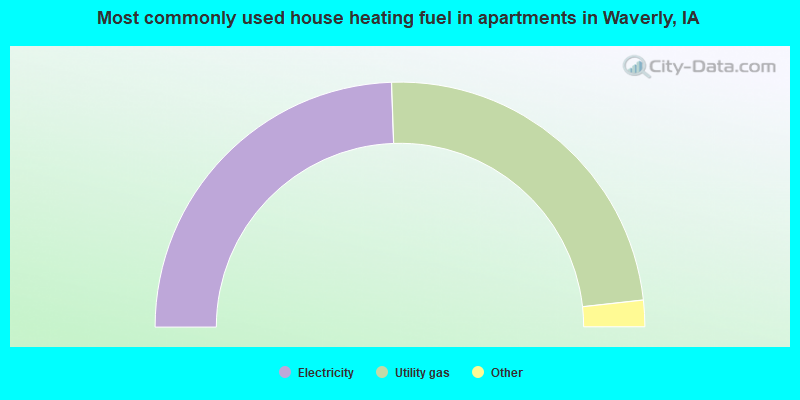
- 49.0%Electricity
- 47.7%Utility gas
- 2.1%Other fuel
- 1.2%Bottled, tank, or LP gas
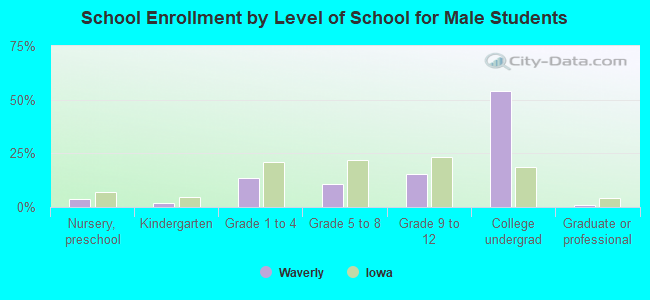
Private vs. public school enrollment:
| Here: | 18.5% |
| Iowa: | 10.6% |
| Here: | 1.5% |
| Iowa: | 7.9% |
| Here: | 87.0% |
| Iowa: | 23.9% |