Warrington, FL (Florida) Houses and Residents
| Warrington: | $200,439 |
| Florida: | $354,100 |
Mean price in 2022:
Detached houses: $311,389
Here: $311,389 State: $500,941 Townhouses or other attached units: $252,557
Here: $252,557 State: $370,869 In 5-or-more-unit structures: $196,037
Here: $196,037 State: $447,145 Mobile homes: $70,380
Here: $70,380 State: $113,202 Occupied boats, RVs, vans, etc.: $96,086
Here: $96,086 State: $73,933
Total population: 14,531 (All urban)
Houses: 8,426 (7,273 occupied: 4,583 owner occupied, 2,933 renter occupied)
| % of renters here: | 39% |
| State: | 33% |
Housing density: 1,282 houses/condos per square mile
Median price asked for vacant for-sale houses and condos in 2022: $893,204.
Median contract rent in 2022: $861 (lower quartile is $571, upper quartile is $1,145)
Median rent asked for vacant for-rent units in 2022: $1,120
Median gross rent in Warrington, FL in 2022: $1,050
Housing units in Warrington with a mortgage: 2,511 (148 second mortgage, 0 home equity loan, 72 both second mortgage and home equity loan)
Houses without a mortgage: 16
Median household income for houses/condos with a mortgage: $81,323
Median household income for apartments without a mortgage: $51,841
Median monthly housing costs: $984
Compare current foreclosures near Warrington, FL:
| Photo | Address | Area | Beds / Baths | Price | Details |
|---|---|---|---|---|---|

|
#1
Eureka Ln
Pensacola, FL 32526
|
1,191 sq. feet
|
2 baths 3 beds |
$113,800
|
show details |

|
#2
Kalakaua Ct
Gulf Breeze, FL 32563
|
1,512 sq. feet
|
2 baths 3 beds |
$390,000
|
show details |

|
#3
Addies Way
Pensacola, FL 32534
|
2,113 sq. feet
|
2 baths 4 beds |
show details | |

|
#4
E Leonard St
Pensacola, FL 32503
|
1,917 sq. feet
|
2 baths 2 beds |
show details | |

|
#5
Laurel Dr
Gulf Breeze, FL 32563
|
2,277 sq. feet
|
2 baths 4 beds |
show details | |

|
#6
Sterling Point Pl
Gulf Breeze, FL 32563
|
1,211 sq. feet
|
2 baths 3 beds |
show details | |

|
#7
Circle Ln
Gulf Breeze, FL 32563
|
1,405 sq. feet
|
2 baths 3 beds |
show details | |

|
#8
Stanford Rd
Gulf Breeze, FL 32563
|
1,228 sq. feet
|
2 baths 3 beds |
show details | |

|
#9
Boyette St
Pensacola, FL 32514
|
1,690 sq. feet
|
2 baths 3 beds |
show details | |

|
#10
Farrel Way
Milton, FL 32583
|
2,413 sq. feet
|
2 baths 4 beds |
show details |
| Photo | Address | Area | Beds / Baths | Price | Details |
|---|---|---|---|---|---|

|
#11
Seminole Rd W
Seminole, AL 36574
|
1,373 sq. feet
|
2 baths 3 beds |
show details | |

|
#12
E Belmont St
Pensacola, FL 32501
|
2,000 sq. feet
|
1 baths 4 beds |
show details | |

|
#13
Chippewa Way
Pensacola, FL 32534
|
1,271 sq. feet
|
2 baths 3 beds |
show details | |

|
#14
Del Monte St
Milton, FL 32583
|
1,223 sq. feet
|
1 baths 3 beds |
show details | |

|
#15
Rambling Way
Milton, FL 32571
|
1,075 sq. feet
|
1 baths 2 beds |
show details | |

|
#16
San Miguel St
Milton, FL 32583
|
1,479 sq. feet
|
2 baths 3 beds |
show details | |

|
#17
Suwanee St
Milton, FL 32583
|
1,830 sq. feet
|
2 baths 3 beds |
show details | |

|
#18
7th Ave
Milton, FL 32571
|
816 sq. feet
|
1 baths 2 beds |
show details | |

|
#19
Auburn Pkwy
Gulf Breeze, FL 32563
|
950 sq. feet
|
1 baths 3 beds |
show details | |

|
#20
Bartow Ave
Pensacola, FL 32507
|
1,373 sq. feet
|
2 baths 3 beds |
show details |
| Photo | Address | Area | Beds / Baths | Price | Details |
|---|---|---|---|---|---|

|
#21
Cornerbrook Dr
Milton, FL 32571
|
1,993 sq. feet
|
2 baths 3 beds |
show details | |

|
#22
N 36th Ave
Milton, FL 32583
|
1,424 sq. feet
|
1 baths 3 beds |
show details | |

|
#23
Gulf Breeze Pkwy
Gulf Breeze, FL 32561
|
2,085 sq. feet
|
3 baths 3 beds |
show details | |

|
#24
Cabral St
Pensacola, FL 32503
|
1,831 sq. feet
|
2 baths - beds |
show details | |

|
#25
Lanier Dr
Pensacola, FL 32504
|
1,281 sq. feet
|
1 baths - beds |
show details | |

|
#26
Tristan Way
Gulf Breeze, FL 32561
|
3,194 sq. feet
|
3 baths - beds |
show details | |

|
#27
Wimbledon Dr Apt 7
Pensacola, FL 32504
|
1,932 sq. feet
|
2 baths - beds |
show details | |

|
#28
Sweet Heart Ln
Pensacola, FL 32526
|
2,780 sq. feet
|
2 baths - beds |
show details | |

|
#29
Parkwood Ave
Pensacola, FL 32504
|
1,327 sq. feet
|
2 baths - beds |
show details | |

|
#30
W Hope Dr
Pensacola, FL 32534
|
1,026 sq. feet
|
1 baths - beds |
show details |
| Photo | Address | Area | Beds / Baths | Price | Details |
|---|---|---|---|---|---|

|
#31
Castlegate Dr
Pensacola, FL 32534
|
1,238 sq. feet
|
1 baths - beds |
show details | |

|
#32
Fiesta Dr
Pensacola, FL 32534
|
1,779 sq. feet
|
1 baths - beds |
show details | |

|
#33
Farmington Rd
Pensacola, FL 32504
|
1,727 sq. feet
|
2 baths - beds |
show details | |

|
#34
Huron Dr
Pensacola, FL 32507
|
1,678 sq. feet
|
2 baths - beds |
show details | |

|
#35
Hobart Ave
Pensacola, FL 32534
|
2,128 sq. feet
|
1 baths - beds |
show details | |

|
#36
W Francisco Apt 19
Pensacola, FL 32504
|
1,910 sq. feet
|
2 baths - beds |
show details | |

|
#37
Clubhouse Ter
Pensacola, FL 32507
|
3,107 sq. feet
|
5 baths - beds |
show details | |

|
#38
Fowler Ave
Pensacola, FL 32534
|
2,191 sq. feet
|
2 baths - beds |
show details | |

|
#39
Concord Dr W
Lillian, AL 36549
|
2,069 sq. feet
|
2 baths 3 beds |
show details | |

|
#40
E Ensley St
Pensacola, FL 32534
|
2,126 sq. feet
|
2 baths - beds |
show details |
| Photo | Address | Area | Beds / Baths | Price | Details |
|---|---|---|---|---|---|

|
#41
Keating Rd
Pensacola, FL 32504
|
1,509 sq. feet
|
2 baths - beds |
show details | |

|
#42
Rosalia Ave
Lillian, AL 36549
|
1,375 sq. feet
|
1 baths 3 beds |
show details | |

|
#43
Cove Ave
Pensacola, FL 32534
|
1,875 sq. feet
|
2 baths - beds |
show details | |

|
#44
Santa Piedro St
Lillian, AL 36549
|
1,672 sq. feet
|
1 baths 3 beds |
show details | |

|
#45
Hawthorn Dr
Pensacola, FL 32507
|
1,066 sq. feet
|
1 baths - beds |
show details | |

|
#46
Calvert St
Pensacola, FL 32514
|
2,040 sq. feet
|
2 baths - beds |
show details | |

|
#47
Schwab Dr
Pensacola, FL 32504
|
912 sq. feet
|
1 baths - beds |
show details | |

|
#48
Valerie Dr
Pensacola, FL 32507
|
1,952 sq. feet
|
2 baths - beds |
show details | |

|
#49
Kee Ave
Lillian, AL 36549
|
1,530 sq. feet
|
1 baths 3 beds |
show details | |

|
Check over 1 million property listings on Foreclosure.com!
|
browse all offers | |||

Latest news about housing in Warrington, FL collected exclusively by city-data.com from local newspapers, TV, and radio stations

 | Moving to the Panhandle…which area? (18 replies) |
| Big Bayou Cemetery (6 replies) |
| Pensacola Fl Best Neighborhoods (8 replies) |
| Should I move to Pensacola (6 replies) |
| Moving to Pensacola area and want locals opinions (3 replies) |
| Questioning moving to Pensacola (46 replies) |

Median year apartment built: 1966
Household type by relationship:
Households: 16,751- Male householders: 2,873 (878 living alone), Female householders: 4,315 (1,386 living alone)
2,463 spouses (2,386 opposite-sex spouses), 585 unmarried partners, (531 opposite-sex unmarried partners), 4,214 children (3,850 natural, 150 adopted, 213 stepchildren), 651 grandchildren, 389 brothers or sisters, 248 parents, 47 foster children, 286 other relatives, 651 non-relatives
- In group quarters: 25
Size of family households: 2,404 2-persons, 693 3-persons, 798 4-persons, 190 5-persons, 169 6-persons, 51 7-or-more-persons.
Size of nonfamily households: 2,518 1-person, 525 2-persons, 166 3-persons, 12 4-persons.
1,356 married couples with children.
1,300 single-parent households (155 men, 1,145 women).
94.6% of residents of Warrington speak English at home.
2.1% of residents speak Spanish at home (89% speak English very well, 8% speak English well, 2% speak English not well).
0.8% of residents speak other Indo-European language at home (78% speak English very well, 8% speak English well, 14% speak English not well).
1.7% of residents speak Asian or Pacific Island language at home (68% speak English very well, 16% speak English well, 17% speak English not well).
0.1% of residents speak other language at home (62% speak English very well, 38% speak English well).
Foreign born population: 442 (2.6%)
(64.7% of them are naturalized citizens)
| Here: | 6.3 |
| State: | 5.9 |
| Here: | 4.2 |
| State: | 4.2 |

- Bedrooms in owner-occupied houses and condos in Warrington, Florida
- 0no bedroom
- 1721 bedroom
- 8612 bedrooms
- 2,5433 bedrooms
- 8644 bedrooms
- 1445+ bedrooms

- Bedrooms in renter-occupied apartments in Warrington, Florida
- 100no bedroom
- 2071 bedroom
- 1,6572 bedrooms
- 8173 bedrooms
- 844 bedrooms
- 695+ bedrooms

- Cars and other vehicles available in Warrington in owner-occupied houses/condos
- 160no vehicle
- 1,2951 vehicle
- 2,2202 vehicles
- 6133 vehicles
- 1524 vehicles
- 1435+ vehicles

- Cars and other vehicles available in Warrington in renter-occupied apartments
- 403no vehicle
- 1,5351 vehicle
- 8002 vehicles
- 1603 vehicles
- 364 vehicles
- 05+ vehicles

- Rooms in owner-occupied houses in Warrington, Florida
- 01 room
- 1062 rooms
- 1093 rooms
- 4264 rooms
- 8915 rooms
- 1,1566 rooms
- 5477 rooms
- 6528 rooms
- 6979+ rooms

- Rooms in renter-occupied apartments in Warrington, Florida
- 1001 room
- 602 rooms
- 6533 rooms
- 8614 rooms
- 5705 rooms
- 3556 rooms
- 1037 rooms
- 908 rooms
- 1429+ rooms


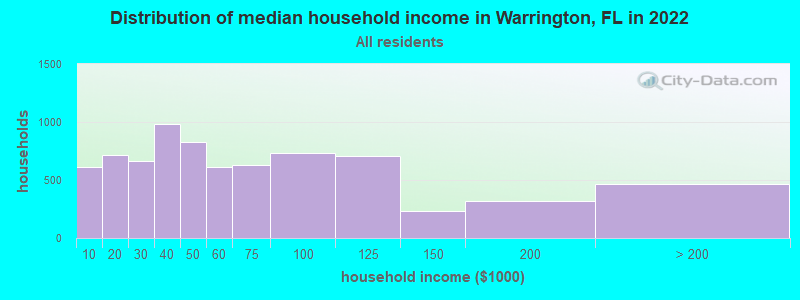
Warrington, FL household income distribution

- 614Less than $10,000
- 717$10,000 to $19,999
- 664$20,000 to $29,999
- 980$30,000 to $39,999
- 829$40,000 to $49,999
- 609$50,000 to $59,999
- 629$60,000 to $74,999
- 733$75,000 to $99,999
- 710$100,000 to $124,999
- 229$125,000 to $149,999
- 322$150,000 to $199,999
- 468$200,000 or more
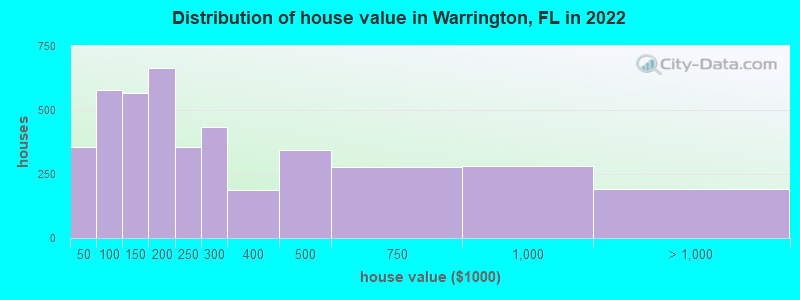
Home value of owner - occupied houses in 2022 in Warrington, FL
-
- 106Less than $10,000
- 25$10,000 to $14,999
- 75$15,000 to $19,999
- 21$20,000 to $24,999
- 33$25,000 to $29,999
- 17$30,000 to $34,999
- 36$35,000 to $39,999
- 36$40,000 to $49,999
- 72$50,000 to $59,999
- 180$60,000 to $69,999
- 100$70,000 to $79,999
- 81$80,000 to $89,999
- 105$90,000 to $99,999
- 279$100,000 to $124,999
- 285$125,000 to $149,999
- 342$150,000 to $174,999
- 320$175,000 to $199,999
- 357$200,000 to $249,999
- 433$250,000 to $299,999
- 187$300,000 to $399,999
- 341$400,000 to $499,999
- 276$500,000 to $749,999
- 282$750,000 to $999,999
- 151$1,000,000 to $1,499,999
- 39$2,000,000 or more
Rent paid by renters in 2022 in Warrington, FL
-
- 32Less than $100
- 176$200 to $249
- 13$250 to $299
- 118$350 to $399
- 12$400 to $449
- 57$450 to $499
- 374$500 to $549
- 71$550 to $599
- 230$600 to $649
- 45$650 to $699
- 56$700 to $749
- 105$750 to $799
- 379$800 to $899
- 251$900 to $999
- 368$1,000 to $1,249
- 171$1,250 to $1,499
- 271$1,500 to $1,999
- 71No cash rent

Percentage of workers working in this county: 88.5%
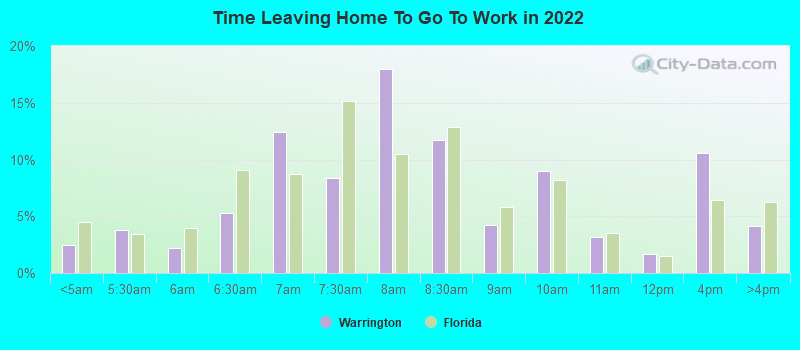
Number of people working at home: 808 (10.3% of all workers)
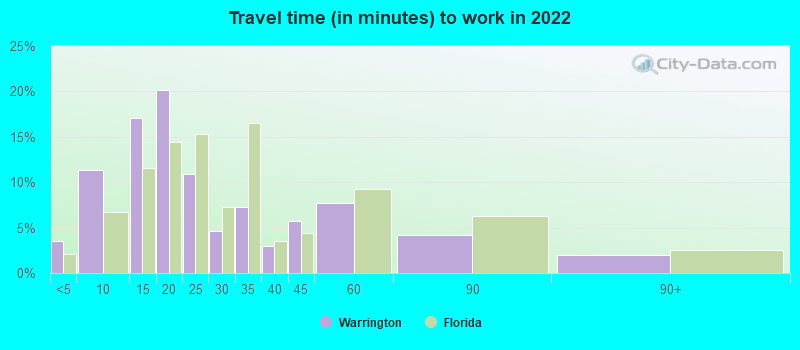
Travel time to work (commute)
- Less than 5 minutes: 131
- 5 to 9 minutes: 693
- 10 to 14 minutes: 1,071
- 15 to 19 minutes: 1,539
- 20 to 24 minutes: 1,184
- 25 to 29 minutes: 329
- 30 to 34 minutes: 804
- 35 to 39 minutes: 198
- 40 to 44 minutes: 177
- 45 to 59 minutes: 364
- 60 to 89 minutes: 185
- 90 or more minutes: 225
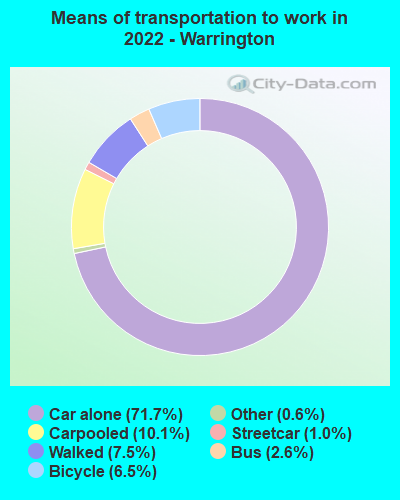
Means of transportation to work:
- Drove a car alone: 2,327 (60.1%)
- Carpooled: 273 (7.0%)
- Bus: 66 (1.7%)
- Subway or elevated rail: 45 (1.2%)
- Taxi: 17 (0.4%)
- Bicycle: 95 (2.5%)
- Walked: 145 (3.7%)
- Worked at home: 808 (20.9%)
- Unemployment by race in 2022
- Unemployment rate for White non-Hispanic residents
- 2.4%Males
- 8.0%Females
- Unemployment rate for Black residents
- 20.1%Males
- 3.4%Females
- Unemployment rate for two or more race residents
- 3.6%Males
- 23.2%Females

- Year of entry for the foreign-born population in Warrington, Florida
- 1312010 or later
- 412000 to 2009
- 441990 to 1999
- 811980 to 1989
- 881970 to 1979
- 143Before 1970

First ancestries reported:
- English: 1,073 (14.5%)
- German: 786 (10.6%)
- Irish: 664 (8.9%)
- American: 542 (7.3%)
- Italian: 207 (2.8%)
- Scottish: 198 (2.7%)
- Welsh: 104 (1.4%)
- Norwegian: 92 (1.2%)
- Swedish: 80 (1.1%)
- French: 57 (0.8%)
- Scotch-Irish: 56 (0.8%)
- Portuguese: 40 (0.5%)
- British: 38 (0.5%)
- European: 30 (0.4%)
- Danish: 26 (0.4%)
- Hungarian: 26 (0.4%)
- Greek: 24 (0.3%)
- French Canadian: 22 (0.3%)
- Russian: 18 (0.2%)
- Dutch: 17 (0.2%)
- Haitian: 17 (0.2%)
- Czechoslovakian: 15 (0.2%)
- Slovak: 15 (0.2%)
- Polish: 12 (0.2%)
- Bahamian: 12 (0.2%)
- Iranian: 11 (0.1%)
- Moroccan: 8 (0.1%)
Most common places of birth for foreign-born residents (%):
| Warrington: | 23.3% (104) |
| Florida: | 1.8% (84,403) |
| Warrington: | 15.9% (71) |
| Florida: | 1.3% (60,604) |
| Warrington: | 10.7% (48) |
| Florida: | 0.1% (3,890) |
| Warrington: | 7.6% (34) |
| Florida: | 0.1% (5,920) |
| Warrington: | 5.4% (24) |
| Florida: | 0.2% (10,425) |
| Warrington: | 4.9% (22) |
| Florida: | 0.8% (37,723) |
| Warrington: | 4.0% (18) |
| Florida: | 5.0% (227,319) |
| Warrington: | 3.8% (17) |
| Florida: | 7.5% (342,375) |
| Warrington: | 3.1% (14) |
| Florida: | 0.4% (17,749) |
| Warrington: | 2.9% (13) |
| Florida: | 0.7% (31,076) |
| Warrington: | 2.5% (11) |
| Florida: | 0.0% (1,058) |
| Warrington: | 2.5% (11) |
| Florida: | 1.3% (57,263) |
| Warrington: | 2.2% (10) |
| Florida: | 1.2% (54,272) |
| Warrington: | 2.2% (10) |
| Florida: | 2.1% (97,632) |
| Warrington: | 2.0% (9) |
| Florida: | 0.3% (15,079) |
| Warrington: | 1.6% (7) |
| Florida: | 0.5% (22,972) |
Place of birth for U.S.-born residents:
- This state: 8,033
- Other state: 7,880
- Northeast: 1,240
- Midwest: 1,813
- South: 3,747
- West: 1,055
86.1% of Warrington residents lived in the same house 1 years ago.
Out of people who lived in different houses, 35.6% lived in this county.
Out of people who lived in different counties, 39.8% lived in Florida.
| Warrington: | 86.1% |
| State average: | 86.3% |
Education attainment for males 25 years and older:
- No schooling: 124
- Nursery to 4th grade: 34
- 5th and 6th grade: 21
- 7th and 8th grade: 46
- 9th grade: 61
- 10th grade: 8
- 11th grade: 165
- 12th grade, no diploma: 126
- High school graduate (or equivalency): 1,913
- Less than 1 year of college: 512
- Some college more than 1 year, no degree: 720
- Associate degree: 492
- Bachelor's degree: 1,179
- Master's degree: 91
- Professional school degree: 84
- Doctorate degree: 88

Education attainment for females 25 years and older:
- No schooling: 177
- Nursery to 4th grade: 6
- 5th and 6th grade: 0
- 7th and 8th grade: 49
- 9th grade: 167
- 10th grade: 49
- 11th grade: 134
- 12th grade, no diploma: 183
- High school graduate (or equivalency): 1,406
- Less than 1 year of college: 538
- Some college more than 1 year, no degree: 940
- Associate degree: 833
- Bachelor's degree: 1,403
- Master's degree: 313
- Professional school degree: 72
- Doctorate degree: 38


Housing units in structures:
- One, detached: 6,143
- One, attached: 207
- Two: 479
- 3 or 4: 126
- 5 to 9: 47
- 10 to 19: 246
- 20 to 49: 173
- 50 or more: 120
- Mobile homes: 837
- Boats, RVs, vans, etc.: 41
Median worth of mobile homes: $99,668
Housing units lacking complete kitchen facilities in 2022: 1.7%
House/condo owner moved in on average 9 years ago
Renter moved in on average 3 years ago

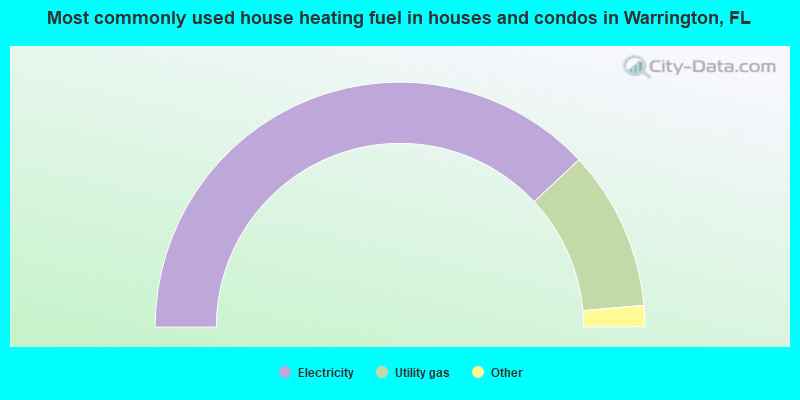
- 76.1%Electricity
- 21.1%Utility gas
- 1.3%Solar energy
- 0.7%Wood
- 0.6%No fuel used
- 0.3%Bottled, tank, or LP gas
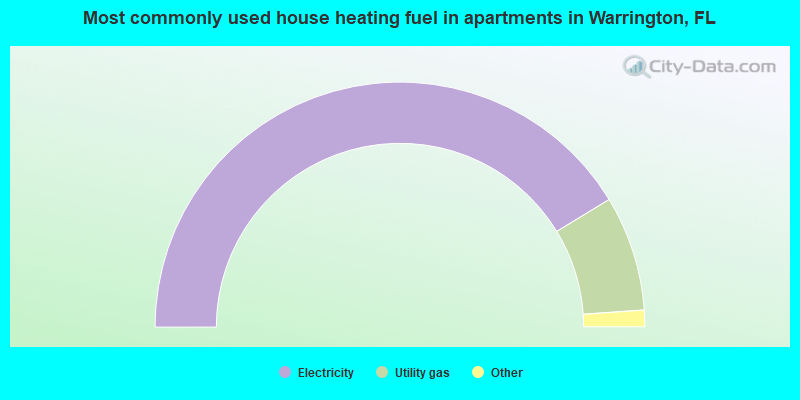
- 82.6%Electricity
- 15.2%Utility gas
- 1.2%No fuel used
- 1.0%Bottled, tank, or LP gas
Private vs. public school enrollment:
| Here: | 19.3% |
| Florida: | 15.8% |
| Here: | 8.0% |
| Florida: | 12.9% |
| Here: | 16.4% |
| Florida: | 23.6% |


