Waltham, MA (Massachusetts) Houses and Residents
| Waltham: | $716,878 |
| Massachusetts: | $534,700 |
Mean price in 2022:
Detached houses: $595,871
Here: $595,871 State: $651,570 Townhouses or other attached units: $651,448
Here: $651,448 State: $617,749 In 2-unit structures: $524,998
Here: $524,998 State: $594,808 In 3-to-4-unit structures: $511,714
Here: $511,714 State: $601,912 In 5-or-more-unit structures: $388,547
Here: $388,547 State: $555,768
Total population: 63,014 (Urban population: 59,226, Rural population: 0)
Houses: 27,501 (26,497 occupied: 12,685 owner occupied, 13,788 renter occupied)
| % of renters here: | 52% |
| State: | 38% |
Housing density: 2,165 houses/condos per square mile
Median price asked for vacant for-sale houses and condos in 2022: $1,033,160.
Median contract rent in 2022: $1,976 (lower quartile is $1,416, upper quartile is over $2,000)
Median rent asked for vacant for-rent units in 2022: $3,059
Median gross rent in Waltham, MA in 2022: over $2,000
Housing units in Waltham with a mortgage: 7,440 (1,090 second mortgage, 19 home equity loan, 1,018 both second mortgage and home equity loan)
Houses without a mortgage: 235
Median household income for houses/condos with a mortgage: $165,822
Median household income for apartments without a mortgage: $95,599
Median monthly housing costs: $2,051
Compare current foreclosures in Waltham, MA:
| Photo | Address | Area | Beds / Baths | Price | Details |
|---|---|---|---|---|---|

|
#1
Rose Hill Way
Waltham, MA 02453
|
1,440 sq. feet
|
2 baths 2 beds |
show details | |

|
#2
Ash St
Waltham, MA 02453
|
2,174 sq. feet
|
6 baths 3 beds |
show details | |

|
#3
Jacqueline Rd Apt F
Waltham, MA 02452
|
780 sq. feet
|
1 baths 2 beds |
show details | |

|
#4
Centre St
Waltham, MA 02453
|
2,549 sq. feet
|
3 baths 4 beds |
show details | |

|
#5
Mokema Ave
Waltham, MA 02451
|
912 sq. feet
|
1 baths 3 beds |
show details | |

|
#6
Castle St
Waltham, MA 02451
|
1,292 sq. feet
|
1 baths 2 beds |
show details | |

|
#7
Eddy St
Waltham, MA 02453
|
2,504 sq. feet
|
2 baths 4 beds |
show details | |

|
#8
Casey Cir
Waltham, MA 02451
|
1,440 sq. feet
|
2 baths 2 beds |
show details | |

|
#9
Farnum Rd
Waltham, MA 02453
|
1,612 sq. feet
|
1 baths 4 beds |
show details | |

|
#10
Lexington St
Waltham, MA 02452
|
2,934 sq. feet
|
2 baths 4 beds |
show details |
| Photo | Address | Area | Beds / Baths | Price | Details |
|---|---|---|---|---|---|

|
#11
Main St
Waltham, MA 02453
|
2,445 sq. feet
|
2 baths 3 beds |
show details | |

|
#12
Bishops Forest Dr
Waltham, MA 02452
|
2,114 sq. feet
|
2 baths 2 beds |
show details | |

|
#13
Kingston Rd
Waltham, MA 02451
|
1,933 sq. feet
|
1 baths 4 beds |
show details | |

|
#14
Mokema Ave
Waltham, MA 02451
|
912 sq. feet
|
1 baths 3 beds |
show details | |

|
#15
Ash St
Waltham, MA 02453
|
2,174 sq. feet
|
4 baths 3 beds |
show details | |

|
#16
Florence Rd
Waltham, MA 02453
|
1,148 sq. feet
|
1 baths 2 beds |
show details | |

|
#17
Indian Rd
Waltham, MA 02451
|
2,035 sq. feet
|
1 baths 3 beds |
show details | |

|
#18
Centre St
Waltham, MA 02453
|
2,168 sq. feet
|
1 baths 4 beds |
show details | |

|
#19
College Farm Rd
Waltham, MA 02451
|
1,800 sq. feet
|
1 baths 2 beds |
show details | |

|
#20
Dorchester St
Waltham, MA 02453
|
2,838 sq. feet
|
2 baths 5 beds |
show details |
| Photo | Address | Area | Beds / Baths | Price | Details |
|---|---|---|---|---|---|

|
#21
Hillcrest St
Waltham, MA 02451
|
924 sq. feet
|
1 baths 3 beds |
show details | |

|
#22
Mckenn St
Waltham, MA 02453
|
1,968 sq. feet
|
2 baths 6 beds |
show details | |

|
#23
Main St
Waltham, MA 02453
|
3,369 sq. feet
|
2 baths 3 beds |
show details | |

|
#24
Mountain Rd
Waltham, MA 02451
|
1,370 sq. feet
|
1 baths 3 beds |
show details | |

|
#25
Columbus Ave
Waltham, MA 02451
|
3,586 sq. feet
|
1 baths 5 beds |
show details | |

|
#26
Warren St
Waltham, MA 02453
|
- sq. feet
|
1 baths 1 beds |
show details | |

|
#27
West St
Waltham, MA 02451
|
5,500 sq. feet
|
1 baths - beds |
show details | |

|
#28
Church St
Waltham, MA 02452
|
1,532 sq. feet
|
1 baths - beds |
show details | |

|
#29
Albemarle Rd
Waltham, MA 02452
|
1,632 sq. feet
|
2 baths - beds |
show details | |

|
#30
Crescent St Apt B3
Waltham, MA 02453
|
- sq. feet
|
- baths - beds |
show details |
| Photo | Address | Area | Beds / Baths | Price | Details |
|---|---|---|---|---|---|

|
#31
Pond St Apt 31
Waltham, MA 02451
|
- sq. feet
|
- baths - beds |
show details | |

|
#32
School Ave Apt C
Waltham, MA 02453
|
- sq. feet
|
- baths - beds |
show details | |

|
#33
River St
Waltham, MA 02453
|
- sq. feet
|
- baths - beds |
show details | |

|
#34
Crescent St Ste 203
Waltham, MA 02453
|
- sq. feet
|
- baths - beds |
show details | |

|
#35
Trapelo Rd # 12
Waltham, MA 02452
|
- sq. feet
|
- baths - beds |
show details | |

|
Check over 1 million property listings on Foreclosure.com!
|
browse all offers | |||

Latest news about housing in Waltham, MA collected exclusively by city-data.com from local newspapers, TV, and radio stations


Median year apartment built: 1969
Household type by relationship:
Households: 64,471- Male householders: 12,786 (3,713 living alone), Female householders: 13,240 (4,587 living alone)
9,736 spouses (9,322 opposite-sex spouses), 2,827 unmarried partners, (2,653 opposite-sex unmarried partners), 12,210 children (11,782 natural, 265 adopted, 163 stepchildren), 489 grandchildren, 645 brothers or sisters, 1,046 parents, 78 foster children, 961 other relatives, 3,612 non-relatives
- In group quarters: 6,835
Size of family households: 6,481 2-persons, 3,072 3-persons, 2,120 4-persons, 1,001 5-persons, 284 6-persons, 264 7-or-more-persons.
Size of nonfamily households: 8,653 1-person, 4,029 2-persons, 445 3-persons, 156 4-persons, 160 5-persons, 10 6-persons.
5,746 married couples with children.
1,944 single-parent households (441 men, 1,503 women).
67.1% of residents of Waltham speak English at home.
11.6% of residents speak Spanish at home (64% speak English very well, 17% speak English well, 15% speak English not well, 4% don't speak English at all).
11.5% of residents speak other Indo-European language at home (75% speak English very well, 13% speak English well, 12% speak English not well).
7.8% of residents speak Asian or Pacific Island language at home (64% speak English very well, 22% speak English well, 8% speak English not well, 7% don't speak English at all).
1.8% of residents speak other language at home (72% speak English very well, 14% speak English well, 15% speak English not well).
Foreign born population: 17,111 (26.5%)
(45.7% of them are naturalized citizens)
| Here: | 6.3 |
| State: | 6.5 |
| Here: | 3.8 |
| State: | 4.0 |

- Bedrooms in owner-occupied houses and condos in Waltham, Massachusetts
- 11no bedroom
- 4841 bedroom
- 3,1012 bedrooms
- 5,7943 bedrooms
- 2,8144 bedrooms
- 4815+ bedrooms

- Bedrooms in renter-occupied apartments in Waltham, Massachusetts
- 685no bedroom
- 4,8801 bedroom
- 5,9312 bedrooms
- 1,8703 bedrooms
- 2614 bedrooms
- 1615+ bedrooms

- Cars and other vehicles available in Waltham in owner-occupied houses/condos
- 407no vehicle
- 4,6151 vehicle
- 5,3872 vehicles
- 1,6083 vehicles
- 5724 vehicles
- 965+ vehicles

- Cars and other vehicles available in Waltham in renter-occupied apartments
- 1,594no vehicle
- 6,1291 vehicle
- 5,0912 vehicles
- 6703 vehicles
- 2004 vehicles
- 1045+ vehicles

- Rooms in owner-occupied houses in Waltham, Massachusetts
- 111 room
- 552 rooms
- 6363 rooms
- 1,2904 rooms
- 2,2125 rooms
- 2,7576 rooms
- 2,3487 rooms
- 1,6908 rooms
- 1,6859+ rooms

- Rooms in renter-occupied apartments in Waltham, Massachusetts
- 6411 room
- 1,0132 rooms
- 4,1153 rooms
- 3,9194 rooms
- 1,7715 rooms
- 1,2816 rooms
- 5247 rooms
- 3938 rooms
- 1309+ rooms


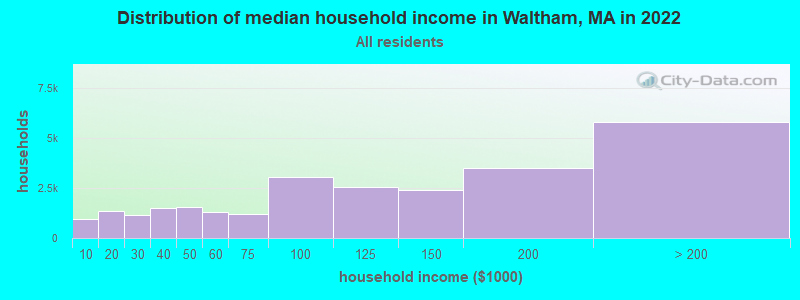
Waltham, MA household income distribution

- 940Less than $10,000
- 1,359$10,000 to $19,999
- 1,154$20,000 to $29,999
- 1,509$30,000 to $39,999
- 1,575$40,000 to $49,999
- 1,319$50,000 to $59,999
- 1,197$60,000 to $74,999
- 3,060$75,000 to $99,999
- 2,573$100,000 to $124,999
- 2,414$125,000 to $149,999
- 3,503$150,000 to $199,999
- 5,809$200,000 or more
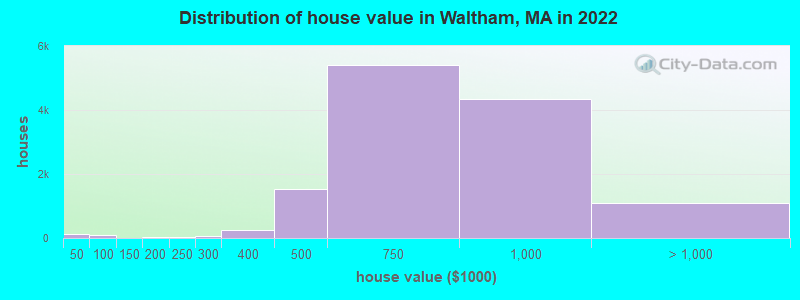
Home value of owner - occupied houses in 2022 in Waltham, MA
-
- 78Less than $10,000
- 17$10,000 to $14,999
- 18$15,000 to $19,999
- 64$50,000 to $59,999
- 24$60,000 to $69,999
- 20$80,000 to $89,999
- 7$125,000 to $149,999
- 22$175,000 to $199,999
- 38$200,000 to $249,999
- 62$250,000 to $299,999
- 257$300,000 to $399,999
- 1,528$400,000 to $499,999
- 5,401$500,000 to $749,999
- 4,351$750,000 to $999,999
- 765$1,000,000 to $1,499,999
- 82$1,500,000 to $1,999,999
- 240$2,000,000 or more
Rent paid by renters in 2022 in Waltham, MA
-
- 94Less than $100
- 23$150 to $199
- 43$200 to $249
- 79$250 to $299
- 173$300 to $349
- 21$350 to $399
- 66$400 to $449
- 38$450 to $499
- 110$500 to $549
- 68$550 to $599
- 125$600 to $649
- 104$650 to $699
- 183$700 to $749
- 94$750 to $799
- 433$800 to $899
- 96$900 to $999
- 808$1,000 to $1,249
- 927$1,250 to $1,499
- 3,313$1,500 to $1,999
- 3,069$2,000 to $2,499
- 1,816$2,500 to $2,999
- 1,017$3,000 to $3,499
- 608$3,500 or more
- 274No cash rent


Percentage of workers working in this county: 78.7%
Number of people working at home: 8,965 (23.7% of all workers)
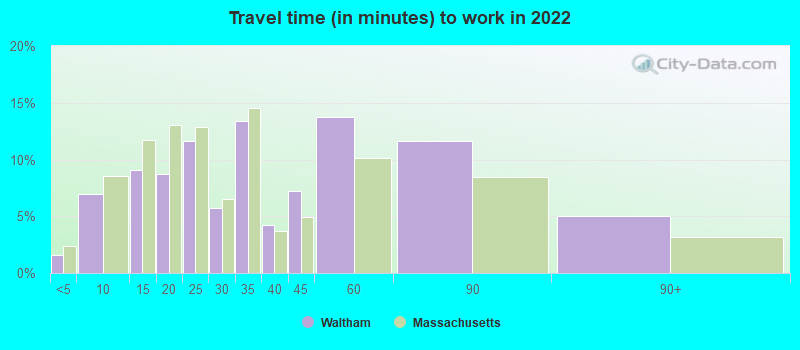
Travel time to work (commute)
- Less than 5 minutes: 414
- 5 to 9 minutes: 2,671
- 10 to 14 minutes: 4,380
- 15 to 19 minutes: 4,094
- 20 to 24 minutes: 4,945
- 25 to 29 minutes: 2,048
- 30 to 34 minutes: 5,323
- 35 to 39 minutes: 927
- 40 to 44 minutes: 1,212
- 45 to 59 minutes: 2,069
- 60 to 89 minutes: 1,035
- 90 or more minutes: 205
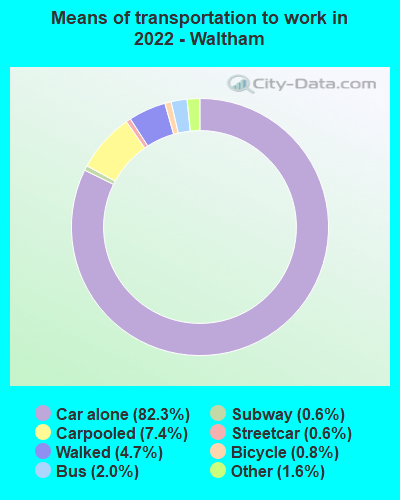
Means of transportation to work:
- Drove a car alone: 36,836 (66.9%)
- Carpooled: 3,441 (6.3%)
- Bus: 700 (1.3%)
- Subway or elevated rail: 274 (0.5%)
- Long-distance train or commuter rail: 185 (0.3%)
- Light rail, streetcar or trolley: 8 (0.0%)
- Taxi: 928 (1.7%)
- Bicycle: 450 (0.8%)
- Walked: 2,202 (4.0%)
- Worked at home: 8,965 (16.3%)

- Unemployment by race in 2022
- Unemployment rate for White non-Hispanic residents
- 1.8%Males
- 1.4%Females
- Unemployment rate for Black residents
- 4.4%Males
- 1.1%Females
- Unemployment rate for American Indian and Alaska Native residents
- 41.2%Males
- Unemployment rate for Asian residents
- 0.9%Males
- 1.6%Females
- Unemployment rate for other race residents
- 11.8%Males
- 0.5%Females
- Unemployment rate for two or more race residents
- 1.9%Males
- 1.9%Females
- Unemployment rate for Hispanic or Latino residents
- 5.6%Males
- 1.1%Females

- Year of entry for the foreign-born population in Waltham, Massachusetts
- 7,2522010 or later
- 2,9442000 to 2009
- 3,1151990 to 1999
- 3,2131980 to 1989
- 1,1461970 to 1979
- 2,146Before 1970

First ancestries reported:
- Irish: 3,242 (10.1%)
- Italian: 2,946 (9.2%)
- Armenian: 1,339 (4.2%)
- English: 1,181 (3.7%)
- American: 859 (2.7%)
- French Canadian: 845 (2.6%)
- Haitian: 682 (2.1%)
- Ugandan: 519 (1.6%)
- Polish: 486 (1.5%)
- European: 459 (1.4%)
- German: 456 (1.4%)
- Iranian: 387 (1.2%)
- Jamaican: 355 (1.1%)
- Ukrainian: 280 (0.9%)
- Canadian: 259 (0.8%)
- African: 240 (0.7%)
- French: 214 (0.7%)
- Russian: 208 (0.6%)
- Eastern European: 195 (0.6%)
- Scottish: 182 (0.6%)
- Greek: 175 (0.5%)
- Bulgarian: 118 (0.4%)
- Brazilian: 103 (0.3%)
- Lithuanian: 101 (0.3%)
- Northern European: 97 (0.3%)
- Swedish: 95 (0.3%)
- Albanian: 86 (0.3%)
- Turkish: 84 (0.3%)
- Palestinian: 82 (0.3%)
- Nigerian: 80 (0.2%)
- Portuguese: 80 (0.2%)
- Moroccan: 79 (0.2%)
- British: 56 (0.2%)
- Finnish: 53 (0.2%)
- Kenyan: 48 (0.1%)
- Slavic: 46 (0.1%)
- Norwegian: 40 (0.1%)
- Swiss: 38 (0.1%)
- Scotch-Irish: 29 (0.09%)
- Dutch: 26 (0.08%)
- Hungarian: 25 (0.08%)
- Celtic: 23 (0.07%)
- Egyptian: 23 (0.07%)
- Romanian: 22 (0.07%)
- Czechoslovakian: 21 (0.07%)
- Cape Verdean: 20 (0.06%)
- German Russian: 15 (0.05%)
- Israeli: 14 (0.04%)
- Zimbabwean: 14 (0.04%)
- Cypriot: 12 (0.04%)
- Lebanese: 11 (0.03%)
- Iraqi: 9 (0.03%)
- Yugoslavian: 9 (0.03%)
- Czech: 8 (0.02%)
- Trinidadian and Tobagonian: 7 (0.02%)
- Welsh: 5 (0.02%)
- British West Indian: 5 (0.02%)
- Icelander: 5 (0.02%)
- Somali: 3 (0.01%)
- Ghanaian: 3 (0.01%)
- South African: 3 (0.01%)
- Barbadian: 2 (0.01%)
Most common places of birth for foreign-born residents (%):
| Waltham: | 15.3% (2,621) |
| Massachusetts: | 2.7% (32,733) |
| Waltham: | 12.3% (2,113) |
| Massachusetts: | 8.4% (103,233) |
| Waltham: | 10.2% (1,751) |
| Massachusetts: | 6.8% (82,934) |
| Waltham: | 5.4% (931) |
| Massachusetts: | 0.4% (5,099) |
| Waltham: | 3.7% (626) |
| Massachusetts: | 2.3% (28,158) |
| Waltham: | 3.4% (579) |
| Massachusetts: | 8.3% (101,767) |
| Waltham: | 3.4% (576) |
| Massachusetts: | 4.9% (60,432) |
| Waltham: | 2.9% (500) |
| Massachusetts: | 0.7% (8,270) |
| Waltham: | 2.7% (461) |
| Massachusetts: | 0.2% (2,307) |
| Waltham: | 2.4% (412) |
| Massachusetts: | 0.6% (7,064) |
| Waltham: | 2.2% (379) |
| Massachusetts: | 0.6% (7,213) |
| Waltham: | 2.1% (352) |
| Massachusetts: | 1.7% (21,468) |
| Waltham: | 2.0% (336) |
| Massachusetts: | 7.6% (92,959) |
| Waltham: | 1.8% (310) |
| Massachusetts: | 1.4% (16,886) |
| Waltham: | 1.7% (296) |
| Massachusetts: | 2.3% (27,810) |
| Waltham: | 1.7% (294) |
| Massachusetts: | 3.7% (45,667) |
| Waltham: | 1.6% (269) |
| Massachusetts: | 1.5% (18,278) |
| Waltham: | 1.5% (258) |
| Massachusetts: | 3.0% (37,197) |
Place of birth for U.S.-born residents:
- This state: 31,480
- Other state: 14,687
- Northeast: 7,879
- Midwest: 2,267
- South: 2,375
- West: 2,129
81.9% of Waltham residents lived in the same house 1 years ago.
Out of people who lived in different houses, 32.5% lived in this county.
Out of people who lived in different counties, 47.1% lived in Massachusetts.
| Waltham: | 81.9% |
| State average: | 87.7% |
Education attainment for males 25 years and older:
- No schooling: 632
- Nursery to 4th grade: 106
- 5th and 6th grade: 96
- 7th and 8th grade: 213
- 9th grade: 104
- 10th grade: 155
- 11th grade: 101
- 12th grade, no diploma: 371
- High school graduate (or equivalency): 4,079
- Less than 1 year of college: 873
- Some college more than 1 year, no degree: 1,634
- Associate degree: 1,188
- Bachelor's degree: 6,800
- Master's degree: 3,964
- Professional school degree: 642
- Doctorate degree: 1,069

Education attainment for females 25 years and older:
- No schooling: 530
- Nursery to 4th grade: 94
- 5th and 6th grade: 176
- 7th and 8th grade: 184
- 9th grade: 178
- 10th grade: 134
- 11th grade: 139
- 12th grade, no diploma: 318
- High school graduate (or equivalency): 3,814
- Less than 1 year of college: 631
- Some college more than 1 year, no degree: 1,439
- Associate degree: 1,827
- Bachelor's degree: 6,437
- Master's degree: 4,831
- Professional school degree: 575
- Doctorate degree: 1,047


Housing units in structures:
- One, detached: 9,854
- One, attached: 1,871
- Two: 3,085
- 3 or 4: 3,763
- 5 to 9: 2,814
- 10 to 19: 2,207
- 20 to 49: 1,335
- 50 or more: 2,520
- Mobile homes: 24
- Boats, RVs, vans, etc.: 24
Housing units lacking complete kitchen facilities in 2022: 1.4%
House/condo owner moved in on average 16 years ago
Renter moved in on average 2 years ago

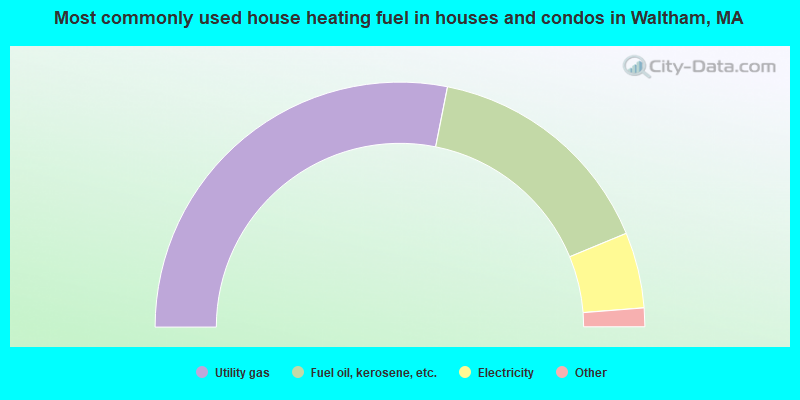
- 56.3%Utility gas
- 31.3%Fuel oil, kerosene, etc.
- 10.0%Electricity
- 1.7%Bottled, tank, or LP gas
- 0.5%Other fuel
- 0.2%Wood
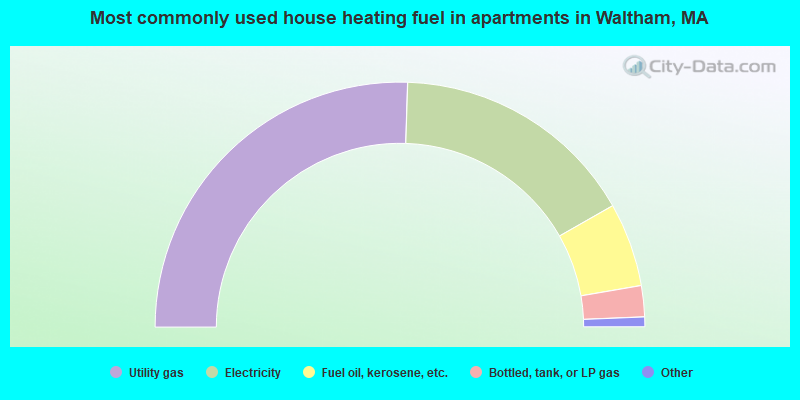
- 51.0%Utility gas
- 32.5%Electricity
- 11.1%Fuel oil, kerosene, etc.
- 4.1%Bottled, tank, or LP gas
- 0.7%Other fuel
- 0.6%No fuel used
Private vs. public school enrollment:
| Here: | 7.9% |
| Massachusetts: | 10.3% |
| Here: | 21.9% |
| Massachusetts: | 12.3% |
| Here: | 73.0% |
| Massachusetts: | 51.2% |


