Wallingford, CT (Connecticut) Houses and Residents
| Wallingford: | $340,931 |
| Connecticut: | $347,200 |
Total population: 45,135 (Urban population: 41,385, Rural population: 1,641 (17 farm, 1,624 nonfarm))
Houses: 17,306 (16,697 occupied: 12,132 owner occupied, 4,565 renter occupied)
| % of renters here: | 27% |
| State: | 34% |
Housing density: 444 houses/condos per square mile
Median price asked for vacant for-sale houses and condos in 2022 in this county: $371,867.
Median contract rent in 2022: $1,219 (lower quartile is $953, upper quartile is $1,495)
Median rent asked for vacant for-rent units in 2022: $1,167
Median gross rent in Wallingford, CT in 2022: $1,407
Housing units in Wallingford with a mortgage: 7,650 (965 second mortgage, 1,087 home equity loan, 23 both second mortgage and home equity loan)
Houses without a mortgage: 2,800
Compare current foreclosures in Wallingford, CT:
| Photo | Address | Area | Beds / Baths | Price | Details |
|---|---|---|---|---|---|

|
#1
N Elm St
Wallingford, CT 06492
|
1,812 sq. feet
|
2 baths 3 beds |
show details | |

|
#2
Saw Mill Dr
Wallingford, CT 06492
|
1,368 sq. feet
|
1 baths 3 beds |
show details | |

|
#3
Ben Ct
Wallingford, CT 06492
|
1,498 sq. feet
|
3 baths 3 beds |
show details | |

|
#4
Constitution St
Wallingford, CT 06492
|
2,830 sq. feet
|
2 baths 4 beds |
show details | |

|
#5
Union St
Wallingford, CT 06492
|
1,020 sq. feet
|
2 baths 2 beds |
show details | |

|
#6
S Main St
Wallingford, CT 06492
|
1,632 sq. feet
|
2 baths 4 beds |
show details | |

|
#7
Quinnipiac St
Wallingford, CT 06492
|
3,349 sq. feet
|
4 baths 6 beds |
show details | |

|
#8
5th Ridge Rd
Wallingford, CT 06492
|
2,130 sq. feet
|
2 baths 4 beds |
show details | |

|
#9
Cooper Ave
Wallingford, CT 06492
|
1,015 sq. feet
|
1 baths 3 beds |
show details | |

|
#10
Center St
Wallingford, CT 06492
|
2,412 sq. feet
|
1 baths 2 beds |
show details |
| Photo | Address | Area | Beds / Baths | Price | Details |
|---|---|---|---|---|---|

|
#11
Church St
Wallingford, CT 06492
|
2,104 sq. feet
|
2 baths 6 beds |
show details | |

|
#12
Shady Dr
Wallingford, CT 06492
|
988 sq. feet
|
2 baths 3 beds |
show details | |

|
#13
Grove St
Wallingford, CT 06492
|
726 sq. feet
|
1 baths 1 beds |
show details | |

|
#14
Pierson Dr
Wallingford, CT 06492
|
1,196 sq. feet
|
2 baths 3 beds |
show details | |

|
#15
Bayberry Dr
Wallingford, CT 06492
|
1,544 sq. feet
|
3 baths 3 beds |
show details | |

|
#16
Oxford Trl
Wallingford, CT 06492
|
936 sq. feet
|
2 baths 3 beds |
show details | |

|
#17
Evanwood Dr
Wallingford, CT 06492
|
1,218 sq. feet
|
3 baths 3 beds |
show details | |

|
#18
New Rock Hill Rd
Wallingford, CT 06492
|
1,056 sq. feet
|
1 baths 3 beds |
show details | |

|
#19
Edgewood Dr
Wallingford, CT 06492
|
1,176 sq. feet
|
1 baths 3 beds |
show details | |

|
#20
Dana Blvd
Wallingford, CT 06492
|
2,654 sq. feet
|
3 baths 4 beds |
show details |
| Photo | Address | Area | Beds / Baths | Price | Details |
|---|---|---|---|---|---|

|
#21
Nicholas Rd
Wallingford, CT 06492
|
1,444 sq. feet
|
2 baths 3 beds |
show details | |

|
#22
Church St
Wallingford, CT 06492
|
1,008 sq. feet
|
1 baths 2 beds |
show details | |

|
#23
Simpson Ave
Wallingford, CT 06492
|
1,990 sq. feet
|
2 baths 5 beds |
show details | |

|
#24
Roxbury Ln
Wallingford, CT 06492
|
2,256 sq. feet
|
3 baths 3 beds |
show details | |

|
#25
Pogmore Dr
Wallingford, CT 06492
|
1,368 sq. feet
|
2 baths 3 beds |
show details | |

|
#26
Parker Farms Rd
Wallingford, CT 06492
|
704 sq. feet
|
1 baths 2 beds |
show details | |

|
#27
S Elm St
Wallingford, CT 06492
|
2,923 sq. feet
|
3 baths 4 beds |
show details | |

|
#28
N Elm St
Wallingford, CT 06492
|
1,165 sq. feet
|
2 baths 3 beds |
show details | |

|
#29
Williams Pl
Wallingford, CT 06492
|
1,120 sq. feet
|
1 baths 3 beds |
show details | |

|
#30
Grieb Trl
Wallingford, CT 06492
|
941 sq. feet
|
1 baths 1 beds |
show details |
| Photo | Address | Area | Beds / Baths | Price | Details |
|---|---|---|---|---|---|

|
#31
Terrace Gdns
Wallingford, CT 06492
|
1,152 sq. feet
|
1 baths 2 beds |
show details | |

|
#32
Pierson Dr
Wallingford, CT 06492
|
1,196 sq. feet
|
2 baths 4 beds |
show details | |

|
#33
Carr St
Wallingford, CT 06492
|
936 sq. feet
|
1 baths 3 beds |
show details | |

|
#34
Summerhill Rd
Wallingford, CT 06492
|
1,632 sq. feet
|
1 baths 2 beds |
show details | |

|
#35
Cedar St
Wallingford, CT 06492
|
1,516 sq. feet
|
1 baths 3 beds |
show details | |

|
#36
Brentwood Dr
Wallingford, CT 06492
|
1,024 sq. feet
|
1 baths 2 beds |
show details | |

|
#37
Clintonville Rd
Wallingford, CT 06492
|
1,104 sq. feet
|
1 baths 3 beds |
show details | |

|
#38
Durham Rd
Wallingford, CT 06492
|
1,148 sq. feet
|
1 baths 2 beds |
show details | |

|
#39
Laurelwood Dr
Wallingford, CT 06492
|
2,375 sq. feet
|
2 baths 4 beds |
show details | |

|
#40
W Ridgeland Rd
Wallingford, CT 06492
|
1,204 sq. feet
|
2 baths 3 beds |
show details |
| Photo | Address | Area | Beds / Baths | Price | Details |
|---|---|---|---|---|---|

|
#41
Northfield Rd
Wallingford, CT 06492
|
1,232 sq. feet
|
2 baths 3 beds |
show details | |

|
#42
Brownstone Rd
Wallingford, CT 06492
|
2,426 sq. feet
|
2 baths 4 beds |
show details | |

|
#43
N Main St
Wallingford, CT 06492
|
3,211 sq. feet
|
3 baths 6 beds |
show details | |

|
#44
Hintz Dr
Wallingford, CT 06492
|
1,194 sq. feet
|
2 baths 3 beds |
show details | |

|
#45
Henry St
Wallingford, CT 06492
|
1,312 sq. feet
|
1 baths 3 beds |
show details | |

|
#46
Cooper Ave
Wallingford, CT 06492
|
1,334 sq. feet
|
1 baths 3 beds |
show details | |

|
#47
S Elm St
Wallingford, CT 06492
|
1,529 sq. feet
|
2 baths 3 beds |
show details | |

|
#48
West St
Wallingford, CT 06492
|
980 sq. feet
|
1 baths 2 beds |
show details | |

|
#49
Barnes Rd
Wallingford, CT 06492
|
3,136 sq. feet
|
2 baths 5 beds |
show details | |

|
Check over 1 million property listings on Foreclosure.com!
|
browse all offers | |||
Latest news about housing in Wallingford, CT collected exclusively by city-data.com from local newspapers, TV, and radio stations


Household type by relationship:
Households: 833,279- In family households: 686,398 (135,155 male householders, 80,594 female householders)
152,067 spouses, 248,015 children (234,078 natural, 5,289 adopted, 8,648 stepchildren), 16,153 grandchildren, 8,819 brothers or sisters, 9,694 parents, foster children, 10,947 other relatives, 19,201 non-relatives
- In nonfamily households: 146,881 (52,812 male householders (40,674 living alone)), 65,941 female householders (55,844 living alone)), 28,128 nonrelatives
- In group quarters: 29,198 (10,313 institutionalized population)
129,243 married couples with children.
54,016 single-parent households (8,416 men, 45,600 women).
88.4% of residents of Wallingford speak English at home.
4.1% of residents speak Spanish at home (61% speak English very well, 17% speak English well, 16% speak English not well, 6% don't speak English at all).
6.3% of residents speak other Indo-European language at home (72% speak English very well, 22% speak English well, 4% speak English not well, 2% don't speak English at all).
1.0% of residents speak Asian or Pacific Island language at home (48% speak English very well, 37% speak English well, 12% speak English not well, 3% don't speak English at all).
0.3% of residents speak other language at home (41% speak English very well, 35% speak English well, 24% speak English not well).
Foreign born population: 4,731 (10.5%)
(61.0% of them are naturalized citizens)
| Here: | 6.4 |
| State: | 6.5 |
| Here: | 3.0 |
| State: | 4.0 |

- Bedrooms in owner-occupied houses and condos in Wallingford, Connecticut
- 10no bedroom
- 2571 bedroom
- 2,4022 bedrooms
- 6,5673 bedrooms
- 2,5084 bedrooms
- 3885+ bedrooms

- Bedrooms in renter-occupied apartments in Wallingford, Connecticut
- 298no bedroom
- 1,4411 bedroom
- 2,1092 bedrooms
- 5963 bedrooms
- 1024 bedrooms
- 195+ bedrooms

- Cars and other vehicles available in Wallingford in owner-occupied houses/condos
- 340no vehicle
- 2,8831 vehicle
- 6,1542 vehicles
- 1,8973 vehicles
- 6874 vehicles
- 1715+ vehicles

- Cars and other vehicles available in Wallingford in renter-occupied apartments
- 606no vehicle
- 2,3671 vehicle
- 1,2592 vehicles
- 2553 vehicles
- 514 vehicles
- 275+ vehicles

- Rooms in owner-occupied houses in Wallingford, Connecticut
- 101 room
- 162 rooms
- 1563 rooms
- 8474 rooms
- 2,2805 rooms
- 3,0476 rooms
- 2,7537 rooms
- 1,6888 rooms
- 1,3359+ rooms
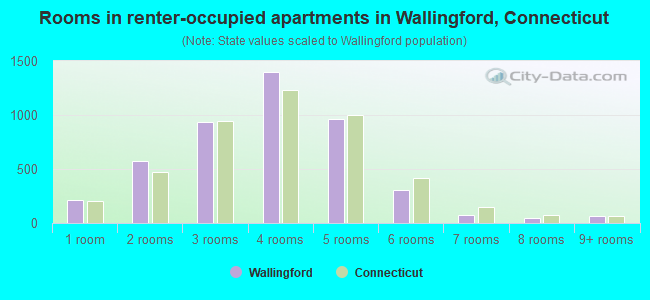
- Rooms in renter-occupied apartments in Wallingford, Connecticut
- 2141 room
- 5732 rooms
- 9343 rooms
- 1,3944 rooms
- 9605 rooms
- 3086 rooms
- 757 rooms
- 458 rooms
- 629+ rooms


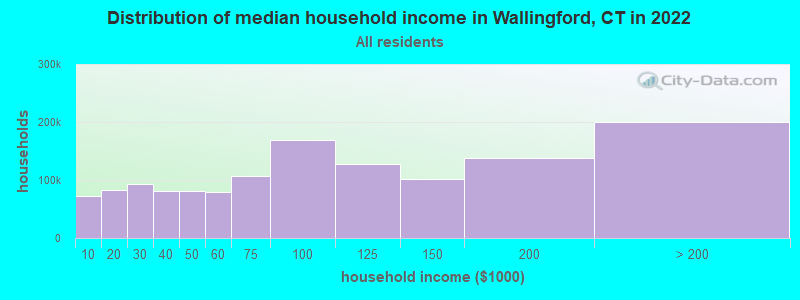
Wallingford, CT household income distribution

- 72,342Less than $10,000
- 82,856$10,000 to $19,999
- 92,367$20,000 to $29,999
- 80,877$30,000 to $39,999
- 81,578$40,000 to $49,999
- 78,753$50,000 to $59,999
- 106,869$60,000 to $74,999
- 168,378$75,000 to $99,999
- 127,896$100,000 to $124,999
- 102,007$125,000 to $149,999
- 138,537$150,000 to $199,999
- 200,027$200,000 or more
Percentage of workers working in this county: 75.2%
Number of people working at home: 3,809 (15.5% of all workers)
Travel time to work (commute)
- Less than 5 minutes: 637
- 5 to 9 minutes: 2,481
- 10 to 14 minutes: 4,271
- 15 to 19 minutes: 4,018
- 20 to 24 minutes: 3,238
- 25 to 29 minutes: 1,299
- 30 to 34 minutes: 2,587
- 35 to 39 minutes: 720
- 40 to 44 minutes: 720
- 45 to 59 minutes: 774
- 60 to 89 minutes: 449
- 90 or more minutes: 435
Means of transportation to work:
- Drove a car alone: 19,394 (87.5%)
- Carpooled: 1,610 (7.3%)
- Bus or trolley bus: 77 (0.3%)
- Railroad: 45 (0.2%)
- Taxi: 8 (0.0%)
- Motorcycle: 12 (0.1%)
- Bicycle: 22 (0.1%)
- Walked: 318 (1.4%)
- Other means: 143 (0.6%)
- Worked at home: 534 (2.4%)


- Year of entry for the foreign-born population in Wallingford, Connecticut
- 6641995 to March 2000
- 3641990 to 1994
- 2811985 to 1989
- 2841980 to 1984
- 2501975 to 1979
- 1271970 to 1974
- 1841965 to 1969
- 931Before 1965

First ancestries reported:
- Italian: 11,704 (21.7%)
- Irish: 9,181 (17.0%)
- Other: 5,208 (9.6%)
- Polish: 5,200 (9.6%)
- English: 4,904 (9.1%)
- German: 4,815 (8.9%)
- French: 2,464 (4.6%)
- United States: 1,676 (3.1%)
- French Canadian: 1,251 (2.3%)
- Hungarian: 1,009 (1.9%)
- Scottish: 913 (1.7%)
- Swedish: 868 (1.6%)
- Portuguese: 815 (1.5%)
- Russian: 656 (1.2%)
- Scotch-Irish: 645 (1.2%)
- Lithuanian: 468 (0.9%)
- Ukrainian: 320 (0.6%)
- Greek: 295 (0.5%)
- Welsh: 265 (0.5%)
- Dutch: 239 (0.4%)
- Danish: 225 (0.4%)
- Norwegian: 221 (0.4%)
- Czech: 194 (0.4%)
- Slovak: 116 (0.2%)
- Arab: 114 (0.2%)
- Swiss: 87 (0.2%)
- West Indian: 65 (0.1%)
- Subsaharan African: 53 (0.10%)
Most common places of birth for foreign-born residents (%):
| Wallingford: | 14.1% (435) |
| Connecticut: | 3.6% (13,282) |
| Wallingford: | 8.9% (276) |
| Connecticut: | 6.9% (25,507) |
| Wallingford: | 8.0% (247) |
| Connecticut: | 3.6% (13,234) |
| Wallingford: | 7.9% (243) |
| Connecticut: | 7.0% (26,023) |
| Wallingford: | 7.6% (233) |
| Connecticut: | 4.1% (15,108) |
| Wallingford: | 7.4% (229) |
| Connecticut: | 5.2% (19,083) |
| Wallingford: | 5.8% (179) |
| Connecticut: | 4.4% (16,395) |
| Wallingford: | 5.3% (164) |
| Connecticut: | 3.1% (11,432) |
| Wallingford: | 4.5% (139) |
| Connecticut: | 0.9% (3,317) |
| Wallingford: | 3.9% (120) |
| Connecticut: | 1.7% (6,247) |
| Wallingford: | 2.6% (80) |
| Connecticut: | 2.5% (9,358) |
| Wallingford: | 2.3% (72) |
| Connecticut: | 0.3% (1,005) |
| Wallingford: | 1.7% (52) |
| Connecticut: | 7.2% (26,819) |
| Wallingford: | 1.6% (48) |
| Connecticut: | 0.7% (2,646) |
Place of birth for U.S.-born residents:
- This state: 30,353
- Other state: 8,991
- Northeast: 6,673
- Midwest: 891
- South: 1,069
- West: 358
65% of Wallingford residents lived in the same house 5 years ago.
Out of people who lived in different houses, 82% lived in this county.
Out of people who lived in different counties, 47% lived in Connecticut.
Education attainment for males 25 years and older:
- No schooling: 64
- Nursery to 4th grade: 33
- 5th and 6th grade: 159
- 7th and 8th grade: 502
- 9th grade: 226
- 10th grade: 406
- 11th grade: 277
- 12th grade, no diploma: 333
- High school graduate (or equivalency): 4,238
- Less than 1 year of college: 845
- Some college more than 1 year, no degree: 1,703
- Associate degree: 986
- Bachelor's degree: 2,819
- Master's degree: 1,033
- Professional school degree: 327
- Doctorate degree: 176

Education attainment for females 25 years and older:
- No schooling: 94
- Nursery to 4th grade: 48
- 5th and 6th grade: 109
- 7th and 8th grade: 547
- 9th grade: 215
- 10th grade: 318
- 11th grade: 370
- 12th grade, no diploma: 419
- High school graduate (or equivalency): 5,356
- Less than 1 year of college: 1,177
- Some college more than 1 year, no degree: 1,888
- Associate degree: 1,192
- Bachelor's degree: 2,627
- Master's degree: 1,436
- Professional school degree: 171
- Doctorate degree: 104


Housing units in structures:
- One, detached: 10,731
- One, attached: 1,024
- Two: 1,516
- 3 or 4: 1,472
- 5 to 9: 573
- 10 to 19: 438
- 20 to 49: 478
- 50 or more: 805
- Mobile homes: 263
- Boats, RVs, vans, etc.: 6
Median worth of mobile homes: $64,449
Housing units lacking complete kitchen facilities: 0.4%

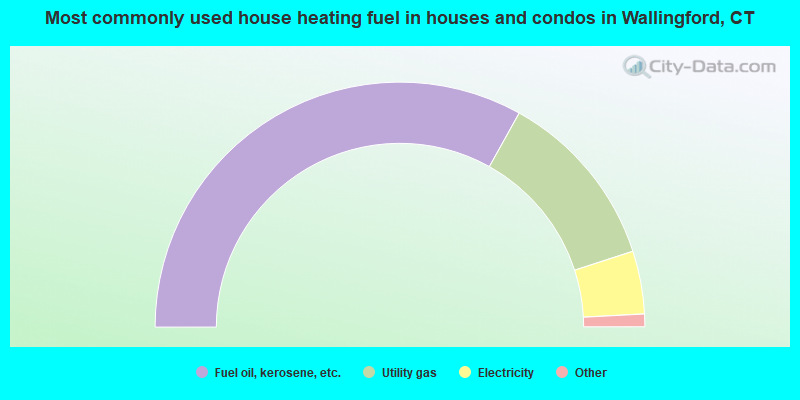
- 66.2%Fuel oil, kerosene, etc.
- 23.8%Utility gas
- 8.3%Electricity
- 0.7%Bottled, tank, or LP gas
- 0.5%Wood
- 0.1%Coal or coke
- 0.1%Other fuel
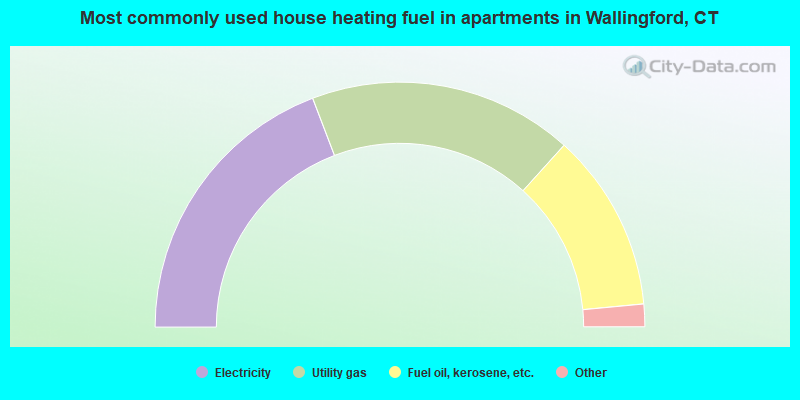
- 38.4%Electricity
- 35.0%Utility gas
- 23.6%Fuel oil, kerosene, etc.
- 1.7%Bottled, tank, or LP gas
- 0.5%Wood
- 0.5%No fuel used
- 0.3%Other fuel
Private vs. public school enrollment:
| Here: | 8.0% |
| Connecticut: | 9.9% |
| Here: | 7.5% |
| Connecticut: | 11.0% |
| Here: | 32.0% |
| Connecticut: | 33.4% |


