Uxbridge, MA (Massachusetts) Houses and Residents
| Uxbridge: | $448,203 |
| Massachusetts: | $534,700 |
Total population: 13,457 (Urban population: 7,487, Rural population: 3,649 (66 farm, 3,583 nonfarm))
Houses: 4,076 (3,985 occupied: 3,104 owner occupied, 881 renter occupied)
| % of renters here: | 22% |
| State: | 38% |
Housing density: 138 houses/condos per square mile
Median price asked for vacant for-sale houses and condos in 2022 in this county: $182,682.
Median contract rent in 2022: $1,091 (lower quartile is $686, upper quartile is $1,468)
Median rent asked for vacant for-rent units in 2022: $497
Median gross rent in Uxbridge, MA in 2022: $1,259
Housing units in Uxbridge with a mortgage: 2,010 (205 second mortgage, 354 home equity loan, 0 both second mortgage and home equity loan)
Houses without a mortgage: 507
Compare current foreclosures near Uxbridge, MA:
| Photo | Address | Area | Beds / Baths | Price | Details |
|---|---|---|---|---|---|

|
#1
Quaker Hwy Apt 25
Uxbridge, MA 01569
|
680 sq. feet
|
1 baths 1 beds |
show details | |

|
#2
W Hartford Ave
Uxbridge, MA 01569
|
1,992 sq. feet
|
2 baths 4 beds |
show details | |

|
#3
Loyalist Dr
Uxbridge, MA 01569
|
1,338 sq. feet
|
1 baths 2 beds |
show details | |

|
#4
W River Rd
Uxbridge, MA 01569
|
1,202 sq. feet
|
1 baths 3 beds |
show details | |

|
#5
Lincoln Ct
Uxbridge, MA 01569
|
2,367 sq. feet
|
2 baths 3 beds |
show details | |

|
#6
Chapin St
Uxbridge, MA 01569
|
3,028 sq. feet
|
2 baths 3 beds |
show details | |

|
#7
High St
Uxbridge, MA 01569
|
1,296 sq. feet
|
1 baths 3 beds |
show details | |

|
#8
Jodie Cir
Uxbridge, MA 01569
|
1,184 sq. feet
|
2 baths 3 beds |
show details | |

|
#9
E Hartford Ave
Uxbridge, MA 01569
|
1,872 sq. feet
|
2 baths 4 beds |
show details | |

|
#10
Millville Rd
Uxbridge, MA 01569
|
960 sq. feet
|
1 baths 3 beds |
show details |
| Photo | Address | Area | Beds / Baths | Price | Details |
|---|---|---|---|---|---|

|
#11
Glendale Ave
Uxbridge, MA 01569
|
1,302 sq. feet
|
2 baths 4 beds |
show details | |

|
#12
Hazel St
Uxbridge, MA 01569
|
1,144 sq. feet
|
1 baths 2 beds |
show details | |

|
#13
Blackstone St
Uxbridge, MA 01569
|
1,060 sq. feet
|
1 baths 2 beds |
show details | |

|
#14
E Hartford Ave Apt 109
Uxbridge, MA 01569
|
- sq. feet
|
- baths - beds |
show details | |

|
#15
Quaker Hwy
Uxbridge, MA 01569
|
- sq. feet
|
- baths - beds |
show details | |

|
#16
Carney St
Uxbridge, MA 01569
|
- sq. feet
|
- baths - beds |
show details | |

|
#17
Highland Park Apt 4
Uxbridge, MA 01569
|
- sq. feet
|
- baths - beds |
show details | |

|
#18
Clarence Dr
Oxford, MA 01540
|
3,010 sq. feet
|
3 baths 5 beds |
$569,900
|
show details |

|
#19
Cook Rd
Cumberland, RI 02864
|
2,050 sq. feet
|
2 baths 4 beds |
$724,900
|
show details |

|
#20
Mount Pleasant Rd
Harrisville, RI 02830
|
1,232 sq. feet
|
1 baths 3 beds |
$449,900
|
show details |
| Photo | Address | Area | Beds / Baths | Price | Details |
|---|---|---|---|---|---|

|
#21
Stoneland Rd
Worcester, MA 01603
|
3,197 sq. feet
|
3 baths 5 beds |
show details | |

|
#22
Broadway
North Attleboro, MA 02760
|
2,602 sq. feet
|
3 baths 5 beds |
show details | |

|
#23
Pine St
Dudley, MA 01571
|
1,414 sq. feet
|
2 baths 4 beds |
show details | |

|
#24
Lake Ave
Worcester, MA 01604
|
3,265 sq. feet
|
2 baths 3 beds |
show details | |

|
#25
Wilson St
Hopkinton, MA 01748
|
1,144 sq. feet
|
1 baths 3 beds |
show details | |

|
#26
North St
Grafton, MA 01519
|
892 sq. feet
|
1 baths 3 beds |
show details | |

|
#27
Wedgewood Dr
Hopkinton, MA 01748
|
4,903 sq. feet
|
5 baths 4 beds |
show details | |

|
#28
S Main St
Hopedale, MA 01747
|
1,411 sq. feet
|
3 baths 1 beds |
show details | |

|
#29
Hawkins St
Worcester, MA 01604
|
864 sq. feet
|
1 baths 3 beds |
show details | |

|
#30
Parkerville Rd
Southborough, MA 01772
|
2,060 sq. feet
|
3 baths 4 beds |
show details |
| Photo | Address | Area | Beds / Baths | Price | Details |
|---|---|---|---|---|---|

|
#31
Walker Rd
Thompson, CT 06277
|
2,324 sq. feet
|
3 baths 4 beds |
show details | |

|
#32
Johnson St
Ashland, MA 01721
|
1,356 sq. feet
|
2 baths 3 beds |
show details | |

|
#33
Kenberma Rd
Worcester, MA 01604
|
- sq. feet
|
2 baths 3 beds |
show details | |

|
#34
Olde Coach Rd
Westborough, MA 01581
|
2,740 sq. feet
|
3 baths 4 beds |
show details | |

|
#35
Auburn Hill Rd
Auburn, MA 01501
|
1,394 sq. feet
|
4 baths 4 beds |
show details | |

|
#36
S Main St
Bellingham, MA 02019
|
2,105 sq. feet
|
2 baths 3 beds |
show details | |

|
#37
Brookline St
Worcester, MA 01603
|
5,123 sq. feet
|
4 baths 7 beds |
show details | |

|
#38
Cedar St
Westborough, MA 01581
|
1,342 sq. feet
|
1 baths 3 beds |
show details | |

|
#39
Maple St
Norfolk, MA 02056
|
1,746 sq. feet
|
2 baths 3 beds |
show details | |

|
#40
Pleasant St
Upton, MA 01568
|
816 sq. feet
|
2 baths 2 beds |
show details |
| Photo | Address | Area | Beds / Baths | Price | Details |
|---|---|---|---|---|---|

|
#41
Piedmont St
Worcester, MA 01609
|
4,071 sq. feet
|
3 baths 9 beds |
show details | |

|
#42
Franklin St
Milford, MA 01757
|
2,060 sq. feet
|
2 baths 5 beds |
show details | |

|
#43
Briarwood Rd
Franklin, MA 02038
|
1,664 sq. feet
|
2 baths 2 beds |
show details | |

|
#44
Green Acres Ln
North Grosvenordale, CT 06255
|
1,040 sq. feet
|
1 baths 3 beds |
show details | |

|
#45
N Main St
Pascoag, RI 02859
|
- sq. feet
|
- baths - beds |
$100,000
|
show details |

|
#46
Exchange St
Millis, MA 02054
|
2,324 sq. feet
|
3 baths 4 beds |
show details | |

|
#47
Clement St
Worcester, MA 01603
|
3,036 sq. feet
|
3 baths 6 beds |
show details | |

|
#48
Bailey St
Woonsocket, RI 02895
|
1,333 sq. feet
|
2 baths 3 beds |
show details | |

|
#49
Alton Dr
Dudley, MA 01571
|
942 sq. feet
|
1 baths 3 beds |
show details | |

|
Check over 1 million property listings on Foreclosure.com!
|
browse all offers | |||
Latest news about housing in Uxbridge, MA collected exclusively by city-data.com from local newspapers, TV, and radio stations

 | How Much Massachusetts Households Make Per Year: Census Data (37 replies) |
| Uxbridge house #2 - thoughts/comments welcomed! (6 replies) |
| Why is the housing stock so crappy in Boston metro? (170 replies) |
| Is Massachusetts Real Estate Affordable? (132 replies) |
| Uxbridge (19 replies) |
| Uxbridge commute to Framingham? (10 replies) |

Household type by relationship:
Households: 771,507- In family households: 644,137 (138,415 male householders, 64,187 female householders)
151,406 spouses, 234,038 children (220,335 natural, 5,096 adopted, 8,607 stepchildren), 11,080 grandchildren, 6,742 brothers or sisters, 7,870 parents, foster children, 7,297 other relatives, 18,119 non-relatives
- In nonfamily households: 127,370 (47,312 male householders (35,337 living alone)), 53,166 female householders (44,100 living alone)), 26,892 nonrelatives
- In group quarters: 27,045 (11,315 institutionalized population)
135,695 married couples with children.
42,745 single-parent households (8,218 men, 34,527 women).
94.0% of residents of Uxbridge speak English at home.
1.4% of residents speak Spanish at home (79% speak English very well, 8% speak English well, 9% speak English not well, 3% don't speak English at all).
3.7% of residents speak other Indo-European language at home (82% speak English very well, 12% speak English well, 6% speak English not well).
0.4% of residents speak Asian or Pacific Island language at home (56% speak English very well, 44% speak English well).
0.5% of residents speak other language at home (100% speak English very well).
Foreign born population: 718 (5.6%)
(64.2% of them are naturalized citizens)
| Here: | 6.4 |
| State: | 6.5 |
| Here: | 4.3 |
| State: | 4.0 |
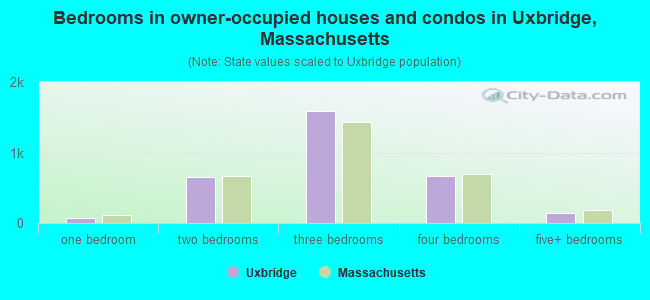
- Bedrooms in owner-occupied houses and condos in Uxbridge, Massachusetts
- 0no bedroom
- 641 bedroom
- 6542 bedrooms
- 1,5843 bedrooms
- 6644 bedrooms
- 1385+ bedrooms

- Bedrooms in renter-occupied apartments in Uxbridge, Massachusetts
- 11no bedroom
- 2741 bedroom
- 3392 bedrooms
- 2013 bedrooms
- 494 bedrooms
- 75+ bedrooms

- Cars and other vehicles available in Uxbridge in owner-occupied houses/condos
- 118no vehicle
- 6811 vehicle
- 1,5222 vehicles
- 5273 vehicles
- 1954 vehicles
- 615+ vehicles

- Cars and other vehicles available in Uxbridge in renter-occupied apartments
- 175no vehicle
- 3471 vehicle
- 2772 vehicles
- 653 vehicles
- 124 vehicles
- 55+ vehicles

- Rooms in owner-occupied houses in Uxbridge, Massachusetts
- 01 room
- 02 rooms
- 123 rooms
- 2224 rooms
- 6015 rooms
- 6766 rooms
- 6267 rooms
- 5608 rooms
- 4079+ rooms

- Rooms in renter-occupied apartments in Uxbridge, Massachusetts
- 51 room
- 1092 rooms
- 1413 rooms
- 2254 rooms
- 1385 rooms
- 1736 rooms
- 497 rooms
- 348 rooms
- 79+ rooms


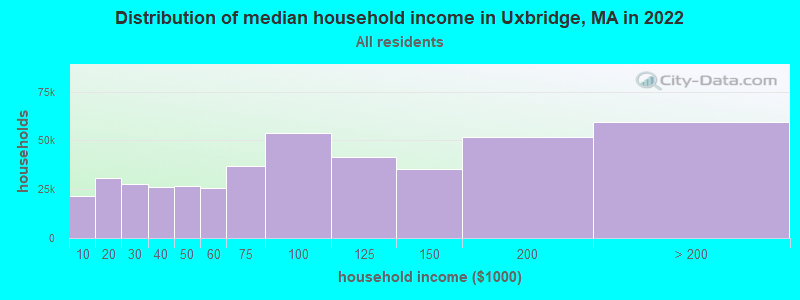
Uxbridge, MA household income distribution

- 21,439Less than $10,000
- 30,587$10,000 to $19,999
- 27,858$20,000 to $29,999
- 25,928$30,000 to $39,999
- 26,552$40,000 to $49,999
- 25,422$50,000 to $59,999
- 36,892$60,000 to $74,999
- 53,657$75,000 to $99,999
- 41,649$100,000 to $124,999
- 35,589$125,000 to $149,999
- 51,834$150,000 to $199,999
- 59,414$200,000 or more
Percentage of workers working in this county: 64.6%
Number of people working at home: 1,134 (16.0% of all workers)
Travel time to work (commute)
- Less than 5 minutes: 109
- 5 to 9 minutes: 550
- 10 to 14 minutes: 748
- 15 to 19 minutes: 576
- 20 to 24 minutes: 562
- 25 to 29 minutes: 364
- 30 to 34 minutes: 747
- 35 to 39 minutes: 252
- 40 to 44 minutes: 292
- 45 to 59 minutes: 789
- 60 to 89 minutes: 528
- 90 or more minutes: 148
Means of transportation to work:
- Drove a car alone: 5,010 (85.8%)
- Carpooled: 510 (8.7%)
- Bus or trolley bus: 5 (0.1%)
- Railroad: 20 (0.3%)
- Motorcycle: 5 (0.1%)
- Walked: 85 (1.5%)
- Other means: 30 (0.5%)
- Worked at home: 174 (3.0%)


- Year of entry for the foreign-born population in Uxbridge, Massachusetts
- 621995 to March 2000
- 461990 to 1994
- 581985 to 1989
- 181980 to 1984
- 261975 to 1979
- 51970 to 1974
- 451965 to 1969
- 93Before 1965

First ancestries reported:
- Irish: 2,864 (20.2%)
- Italian: 1,964 (13.8%)
- French: 1,951 (13.8%)
- English: 1,543 (10.9%)
- French Canadian: 1,255 (8.8%)
- Other: 756 (5.3%)
- Polish: 693 (4.9%)
- German: 629 (4.4%)
- Scottish: 513 (3.6%)
- United States: 438 (3.1%)
- Scotch-Irish: 365 (2.6%)
- Swedish: 276 (1.9%)
- Portuguese: 246 (1.7%)
- Dutch: 212 (1.5%)
- Greek: 84 (0.6%)
- Arab: 83 (0.6%)
- Czech: 72 (0.5%)
- Lithuanian: 61 (0.4%)
- Slovak: 59 (0.4%)
- Russian: 45 (0.3%)
- Norwegian: 35 (0.2%)
- Ukrainian: 13 (0.09%)
- Swiss: 7 (0.05%)
- Welsh: 6 (0.04%)
- Hungarian: 5 (0.04%)
- Subsaharan African: 5 (0.04%)
- West Indian: 5 (0.04%)
Most common places of birth for foreign-born residents (%):
| Uxbridge: | 13.6% (48) |
| Massachusetts: | 5.2% (40,247) |
| Uxbridge: | 13.3% (47) |
| Massachusetts: | 4.7% (36,669) |
| Uxbridge: | 11.3% (40) |
| Massachusetts: | 3.3% (25,403) |
| Uxbridge: | 7.6% (27) |
| Massachusetts: | 1.7% (12,975) |
| Uxbridge: | 7.6% (27) |
| Massachusetts: | 0.4% (2,726) |
| Uxbridge: | 7.1% (25) |
| Massachusetts: | 5.1% (39,255) |
| Uxbridge: | 5.4% (19) |
| Massachusetts: | 1.9% (14,883) |
| Uxbridge: | 4.8% (17) |
| Massachusetts: | 1.7% (12,868) |
| Uxbridge: | 4.5% (16) |
| Massachusetts: | 0.9% (6,691) |
| Uxbridge: | 3.4% (12) |
| Massachusetts: | 0.4% (2,780) |
| Uxbridge: | 3.1% (11) |
| Massachusetts: | 3.6% (28,086) |
| Uxbridge: | 2.5% (9) |
| Massachusetts: | 6.0% (46,744) |
| Uxbridge: | 2.3% (8) |
| Massachusetts: | 8.6% (66,627) |
| Uxbridge: | 2.0% (7) |
| Massachusetts: | 2.3% (17,449) |
| Uxbridge: | 2.0% (7) |
| Massachusetts: | 0.3% (2,426) |
| Uxbridge: | 1.7% (6) |
| Massachusetts: | 0.3% (1,943) |
| Uxbridge: | 1.7% (6) |
| Massachusetts: | 0.3% (2,058) |
| Uxbridge: | 1.7% (6) |
| Massachusetts: | 2.0% (15,286) |
Place of birth for U.S.-born residents:
- This state: 8,125
- Other state: 2,595
- Northeast: 1,969
- Midwest: 188
- South: 282
- West: 156
59% of Uxbridge residents lived in the same house 5 years ago.
Out of people who lived in different houses, 61% lived in this county.
Out of people who lived in different counties, 50% lived in Massachusetts.
Education attainment for males 25 years and older:
- No schooling: 42
- Nursery to 4th grade: 10
- 5th and 6th grade: 11
- 7th and 8th grade: 97
- 9th grade: 70
- 10th grade: 90
- 11th grade: 52
- 12th grade, no diploma: 71
- High school graduate (or equivalency): 1,120
- Less than 1 year of college: 213
- Some college more than 1 year, no degree: 416
- Associate degree: 329
- Bachelor's degree: 693
- Master's degree: 210
- Professional school degree: 48
- Doctorate degree: 8

Education attainment for females 25 years and older:
- No schooling: 24
- Nursery to 4th grade: 0
- 5th and 6th grade: 36
- 7th and 8th grade: 115
- 9th grade: 112
- 10th grade: 89
- 11th grade: 46
- 12th grade, no diploma: 58
- High school graduate (or equivalency): 1,229
- Less than 1 year of college: 185
- Some college more than 1 year, no degree: 520
- Associate degree: 354
- Bachelor's degree: 674
- Master's degree: 258
- Professional school degree: 46
- Doctorate degree: 6


Housing units in structures:
- One, detached: 2,782
- One, attached: 214
- Two: 501
- 3 or 4: 285
- 5 to 9: 162
- 10 to 19: 15
- 20 to 49: 75
- 50 or more: 42
Housing units lacking complete kitchen facilities: 1.0%

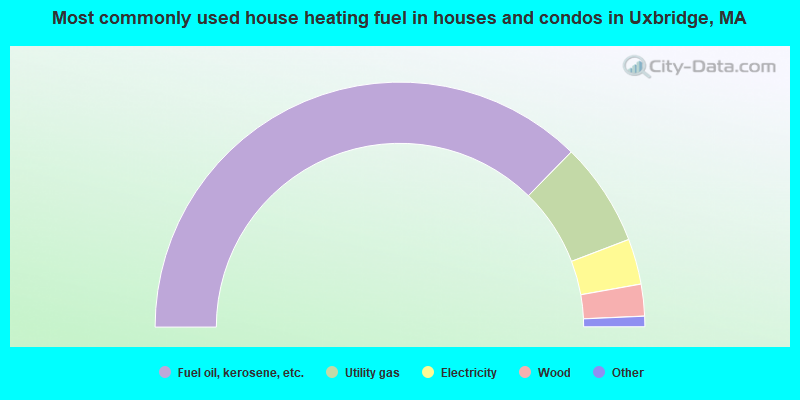
- 74.6%Fuel oil, kerosene, etc.
- 13.7%Utility gas
- 6.0%Electricity
- 4.2%Wood
- 0.7%Bottled, tank, or LP gas
- 0.5%Other fuel
- 0.2%Coal or coke
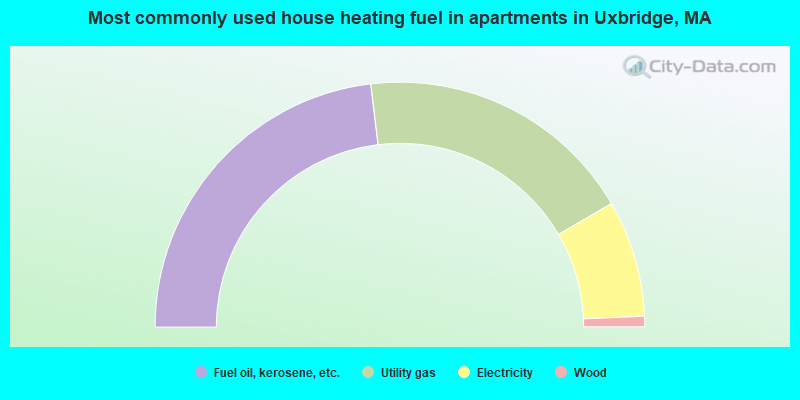
- 46.2%Fuel oil, kerosene, etc.
- 37.0%Utility gas
- 15.4%Electricity
- 1.4%Wood
Private vs. public school enrollment:
| Here: | 8.9% |
| Massachusetts: | 10.8% |
| Here: | 4.3% |
| Massachusetts: | 12.2% |
| Here: | 38.8% |
| Massachusetts: | 48.2% |


