Utica, NY (New York) Houses and Residents
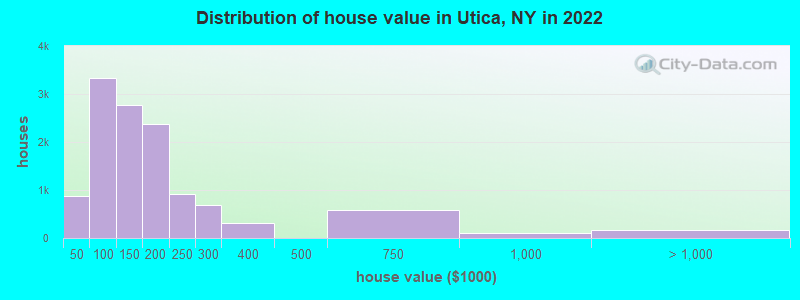
Estimated median house or condo value in 2022: $131,891 (it was $57,800 in 2000 )
Utica:
$131,891New York:
$400,400
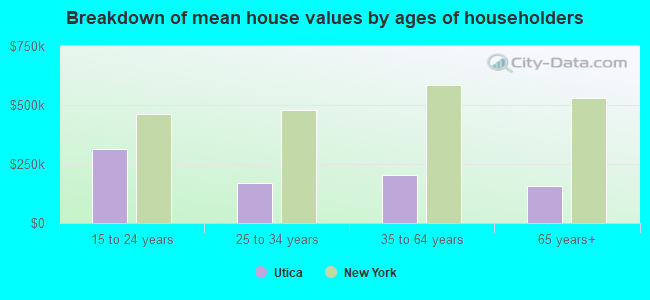
Lower value quartile - upper value quartile: $88,141 - $194,329Mean price in 2022: Detached houses: $152,500 Here:
$152,500State:
$476,719
Townhouses or other attached units: $163,146 Here:
$163,146State:
$699,270
In 2-unit structures: $281,932 Here:
$281,932State:
$713,077
In 3-to-4-unit structures: $109,636 Here:
$109,636State:
$764,568
In 5-or-more-unit structures: $861,175 Here:
$861,175State:
$912,009
Mobile homes: $58,687 Here:
$58,687State:
$88,925
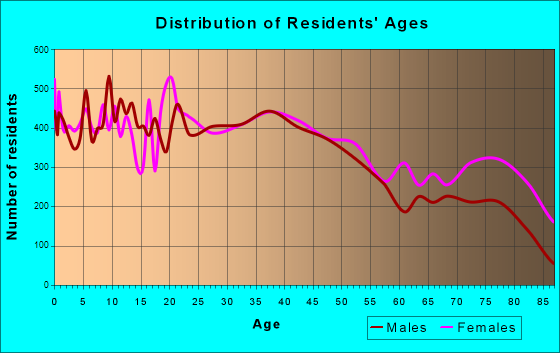
Total population: 61,332 (Urban population: 60,676, Rural population: 3 (all nonfarm) )
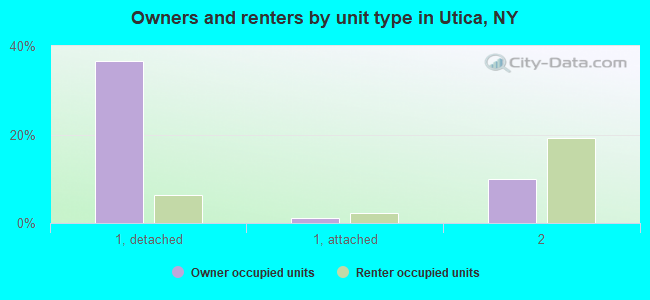
Houses: 28,471 (24,731 occupied: 12,859 owner occupied, 13,167 renter occupied )
% of renters here:
51%State:
46%
Housing density: 1,742 houses/condos per square mile
Median price asked for vacant for-sale houses and condos in 2022: $205,403.
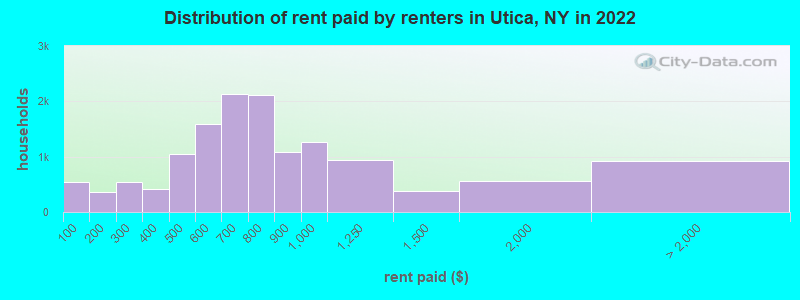
Median contract rent in 2022: $716 (lower quartile is $534, upper quartile is $923)
Median rent asked for vacant for-rent units in 2022: $562
Median gross rent in Utica, NY in 2022: $882
Housing units in Utica with a mortgage: 6,346 (546 second mortgage, 102 home equity loan, 443 both second mortgage and home equity loan )Houses without a mortgage: 495
Median household income for houses/condos with a mortgage: $80,715
Median household income for apartments without a mortgage: $55,316
Median monthly housing costs: $881
Data:
Median house or condo value ($)
Median house or condo value ($ change since 2000)
Median house or condo value ($) - White
Median house or condo value ($) - Black or African American
Median house or condo value ($) - Asian
Median house or condo value ($) - Hispanic or Latino
Median house or condo value ($) - American Indian and Alaska Native
Median house or condo value ($) - Multirace
Median house or condo value ($) - Other Race
Median price asked for mobile homes ($)
Household density (households per square mile)
Mean house or condo value by units in structure - 1, detached ($)
Mean house or condo value by units in structure - 1, attached ($)
Mean house or condo value by units in structure - 2 ($)
Mean house or condo value by units in structure by units in structure - 3 or 4 ($)
Mean house or condo value by units in structure - 5 or more ($)
Mean house or condo value by units in structure - Boat, RV, van, etc. ($)
Mean house or condo value by units in structure - Mobile home ($)
Median contract rent ($)
Median contract rent - Lower quartile ($)
Median contract rent - Upper quartile ($)
Median gross rent ($)
Urban houses (%)
Rural houses (%)
Houses occupied (%)
Houses occupied (% change since 2000)
Houses owner occupied (%)
Houses owner occupied (% change since 2000)
Houses renter occupied (%)
Houses renter occupied (% change since 2000)
Vacant housing units - For rent (%)
Vacant housing units - For rent (% change since 2000)
Vacant housing units - For sale only (%)
Vacant housing units - For sale only (% change since 2000)
Vacant housing units - Rented or sold, not occupied (%)
Vacant housing units - Rented or sold, not occupied (% change since 2000)
Vacant housing units - For seasonal, recreational, or occasional use (%)
Vacant housing units - For seasonal, recreational, or occasional use (% change since 2000)
Vacant housing units - For migrant workers (%)
Vacant housing units - For migrant workers (% change since 2000)
Vacant housing units - Other vacant (%)
Vacant housing units - Other vacant (% change since 2000)
Median monthly housing costs ($)
Median household income for houses/condos with a mortgage ($)
Median household income for houses/condos without a mortgage ($)
Median household income ($)
Median household income ($) - White
Median household income ($) - Black or African American
Median household income ($) - Asian
Median household income ($) - Hispanic or Latino
Median household income ($) - American Indian and Alaska Native
Median household income ($) - Multirace
Median household income ($) - Other Race
Mortgage status - with mortgage (%)
Mortgage status - with second mortgage (%)
Mortgage status - with home equity loan (%)
Mortgage status - with both second mortgage and home equity loan (%)
Mortgage status - without a mortgage (%)
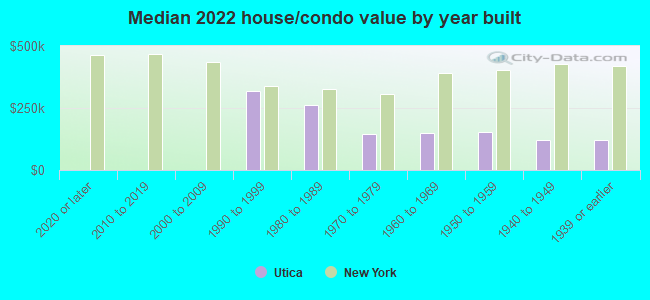
Median year house/condo built
Median year apartment built
Household type by relationship - Male householder living alone (%)
Household type by relationship - Male householder not living alone (%)
Household type by relationship - Female householder living alone (%)
Household type by relationship - Female householder not living alone (%)
Household type by relationship - Opposite-Sex spouse (%)
Household type by relationship - Same-Sex spouse (%)
Household type by relationship - Opposite-Sex unmarried partner (%)
Household type by relationship - Same-Sex unmarried partner (%)
Household type by relationship - In group quarters (%)
Size of family households - 2-person household (%)
Size of family households - 3-person household (%)
Size of family households - 4-person household (%)
Size of family households - 5-person household (%)
Size of family households - 6-person household (%)
Size of family households - 7-or-more-person household (%)
Size of nonfamily households - 1-person household (%)
Size of nonfamily households - 2-person household (%)
Size of nonfamily households - 3-person household (%)
Size of nonfamily households - 4-person household (%)
Size of nonfamily households - 5-person household (%)
Size of nonfamily households - 6-person household (%)
Size of nonfamily households - 7-or-moreperson household (%)
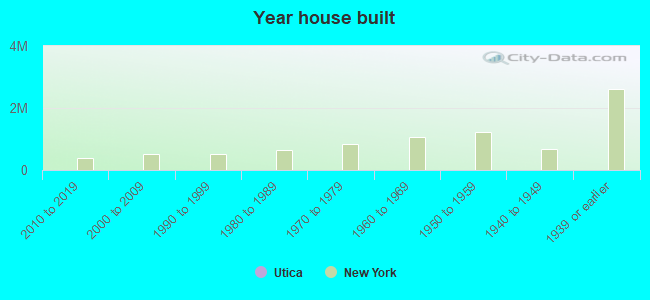
Year house built - Built 2010 or later (%)
Year house built - Built 2000 to 2009 (%)
Year house built - Built 1990 to 1999 (%)
Year house built - Built 1980 to 1989 (%)
Year house built - Built 1970 to 1979 (%)
Year house built - Built 1960 to 1969 (%)
Year house built - Built 1950 to 1959 (%)
Year house built - Built 1940 to 1949 (%)
Year house built - Built 1939 or earlier (%)
Median number of rooms in houses and condos
Median number of rooms in apartments
Median number of bedrooms in owner occupied houses
Mean number of bedrooms in owner occupied houses
Median number of bedrooms in renter occupied houses
Mean number of bedrooms in renter occupied houses
Median number of vehichles in owner occupied houses
Mean number of vehichles in owner occupied houses
Median number of vehichles in renter occupied houses
Mean number of vehichles in renter occupied houses
Rooms in owner-occupied houses - 1 room (%)
Rooms in owner-occupied houses - 2 rooms (%)
Rooms in owner-occupied houses - 3 rooms (%)
Rooms in owner-occupied houses - 4 rooms (%)
Rooms in owner-occupied houses - 5 rooms (%)
Rooms in owner-occupied houses - 6 rooms (%)
Rooms in owner-occupied houses - 7 rooms (%)
Rooms in owner-occupied houses - 8 rooms (%)
Rooms in owner-occupied houses - 9+ rooms (%)
Rooms in renter-occupied houses - 1 room (%)
Rooms in renter-occupied houses - 2 rooms (%)
Rooms in renter-occupied houses - 3 rooms (%)
Rooms in renter-occupied houses - 4 rooms (%)
Rooms in renter-occupied houses - 5 rooms (%)
Rooms in renter-occupied houses - 6 rooms (%)
Rooms in renter-occupied houses - 7 rooms (%)
Rooms in renter-occupied houses - 8 rooms (%)
Rooms in renter-occupied houses - 9+ rooms (%)
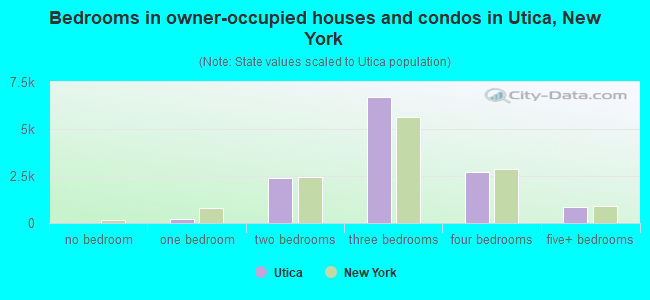
Bedrooms in owner-occupied houses - no bedrooms (%)
Bedrooms in owner-occupied houses - 1 bedroom (%)
Bedrooms in owner-occupied houses - 2 bedrooms (%)
Bedrooms in owner-occupied houses - 3 bedrooms (%)
Bedrooms in owner-occupied houses - 4 bedrooms (%)
Bedrooms in owner-occupied houses - 5+ bedrooms (%)
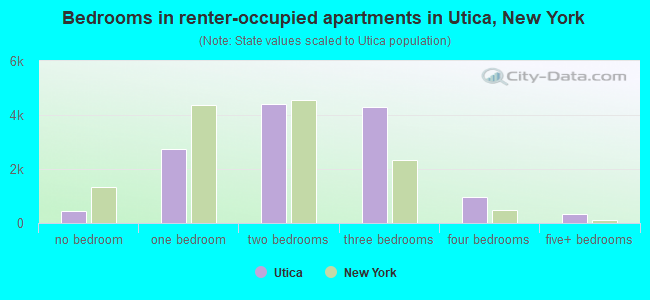
Bedrooms in renter-occupied houses - no bedrooms (%)
Bedrooms in renter-occupied houses - 1 bedroom (%)
Bedrooms in renter-occupied houses - 2 bedrooms (%)
Bedrooms in renter-occupied houses - 3 bedrooms (%)
Bedrooms in renter-occupied houses - 4 bedrooms (%)
Bedrooms in renter-occupied houses - 5+ bedrooms (%)
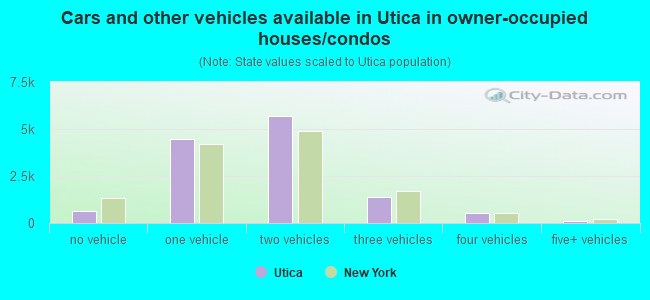
Vehicles available in owner-occupied houses - no vehicle available (%)
Vehicles available in owner-occupied houses - 1 vehicle available(%)
Vehicles available in owner-occupied houses - 2 Vehicles available (%)
Vehicles available in owner-occupied houses - 3 Vehicles available (%)
Vehicles available in owner-occupied houses - 4 Vehicles available (%)
Vehicles available in owner-occupied houses - 5+ Vehicles available (%)
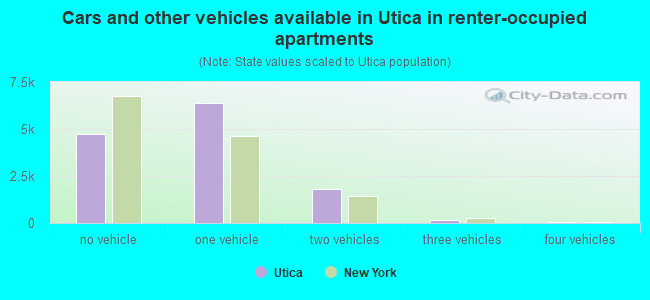
Vehicles available in renter-occupied houses - no vehicle available (%)
Vehicles available in renter-occupied houses - 1 vehicle available (%)
Vehicles available in renter-occupied houses - 2 Vehicles available (%)
Vehicles available in renter-occupied houses - 3 Vehicles available (%)
Vehicles available in renter-occupied houses - 4 Vehicles available (%)
Vehicles available in renter-occupied houses - 5+ Vehicles available (%)
Housing units in structures - 1, detached (%)
Housing units in structures - 1, attached (%)
Housing units in structures - 2 (%)
Housing units in structures - 3 or 4 (%)
Housing units in structures - 5 to 9 (%)
Housing units in structures - 10 to 19 (%)
Housing units in structures - 20 to 49 (%)
Housing units in structures - 50 or more (%)
Housing units in structures - Mobile home (%)
Housing units in structures - Boat, RV, van, etc. (%)
Housing units in structures - Owners - 1, detached (%)
Housing units in structures - Owners - 1, attached (%)
Housing units in structures - Owners - 2 (%)
Housing units in structures - Owners - 3 or 4 (%)
Housing units in structures - Owners - 5 to 9 (%)
Housing units in structures - Owners - 10 to 19 (%)
Housing units in structures - Owners - 20 to 49 (%)
Housing units in structures - Owners - 50 or more (%)
Housing units in structures - Owners - Mobile home (%)
Housing units in structures - Owners - Boat, RV, van, etc. (%)
Housing units in structures - Renters - 1, detached (%)
Housing units in structures - Renters - 1, attached (%)
Housing units in structures - Renters - 2 (%)
Housing units in structures - Renters - 3 or 4 (%)
Housing units in structures - Renters - 5 to 9 (%)
Housing units in structures - Renters - 10 to 19 (%)
Housing units in structures - Renters - 20 to 49 (%)
Housing units in structures - Renters - 50 or more (%)
Housing units in structures - Renters - Mobile home (%)
Housing units in structures - Renters - Boat, RV, van, etc. (%)
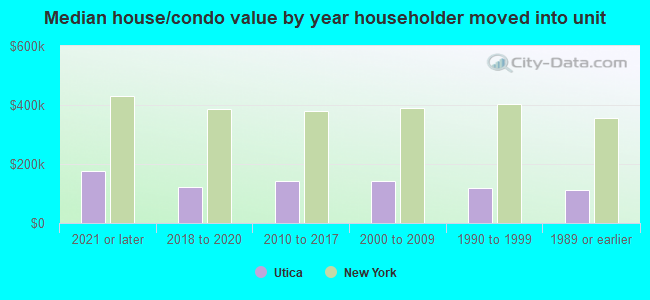
House/condo owner moved in on average (years ago)
Renter moved in on average (years ago)
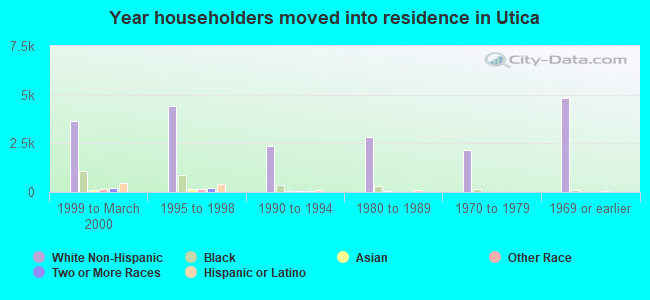
Year householder moved into unit - Moved in 1999 to March 2000 (%)
Year householder moved into unit - Moved in 1999 to March 2000 (%) - White
Year householder moved into unit - Moved in 1999 to March 2000 (%) - Black or African American
Year householder moved into unit - Moved in 1999 to March 2000 (%) - Asian
Year householder moved into unit - Moved in 1999 to March 2000 (%) - Hispanic or Latino
Year householder moved into unit - Moved in 1999 to March 2000 (%) - American Indian and Alaska Native
Year householder moved into unit - Moved in 1999 to March 2000 (%) - Multirace
Year householder moved into unit - Moved in 1999 to March 2000 (%) - Other Race
Year householder moved into unit - Moved in 1995 to 1998 (%)
Year householder moved into unit - Moved in 1995 to 1998 (%) - White
Year householder moved into unit - Moved in 1995 to 1998 (%) - Black or African American
Year householder moved into unit - Moved in 1995 to 1998 (%) - Asian
Year householder moved into unit - Moved in 1995 to 1998 (%) - Hispanic or Latino
Year householder moved into unit - Moved in 1995 to 1998 (%) - American Indian and Alaska Native
Year householder moved into unit - Moved in 1995 to 1998 (%) - Multirace
Year householder moved into unit - Moved in 1995 to 1998 (%) - Other Race
Year householder moved into unit - Moved in 1990 to 1994 (%)
Year householder moved into unit - Moved in 1990 to 1994 (%) - White
Year householder moved into unit - Moved in 1990 to 1994 (%) - Black or African American
Year householder moved into unit - Moved in 1990 to 1994 (%) - Asian
Year householder moved into unit - Moved in 1990 to 1994 (%) - Hispanic or Latino
Year householder moved into unit - Moved in 1990 to 1994 (%) - American Indian and Alaska Native
Year householder moved into unit - Moved in 1990 to 1994 (%) - Multirace
Year householder moved into unit - Moved in 1990 to 1994 (%) - Other Race
Year householder moved into unit - Moved in 1980 to 1989 (%)
Year householder moved into unit - Moved in 1980 to 1989 (%) - White
Year householder moved into unit - Moved in 1980 to 1989 (%) - Black or African American
Year householder moved into unit - Moved in 1980 to 1989 (%) - Asian
Year householder moved into unit - Moved in 1980 to 1989 (%) - Hispanic or Latino
Year householder moved into unit - Moved in 1980 to 1989 (%) - American Indian and Alaska Native
Year householder moved into unit - Moved in 1980 to 1989 (%) - Multirace
Year householder moved into unit - Moved in 1980 to 1989 (%) - Other Race
Year householder moved into unit - Moved in 1970 to 1979 (%)
Year householder moved into unit - Moved in 1970 to 1979 (%) - White
Year householder moved into unit - Moved in 1970 to 1979 (%) - Black or African American
Year householder moved into unit - Moved in 1970 to 1979 (%) - Asian
Year householder moved into unit - Moved in 1970 to 1979 (%) - Hispanic or Latino
Year householder moved into unit - Moved in 1970 to 1979 (%) - American Indian and Alaska Native
Year householder moved into unit - Moved in 1970 to 1979 (%) - Multirace
Year householder moved into unit - Moved in 1970 to 1979 (%) - Other Race
Year householder moved into unit - Moved in 1969 or earlier (%)
Year householder moved into unit - Moved in 1969 or earlier (%) - White
Year householder moved into unit - Moved in 1969 or earlier (%) - Black or African American
Year householder moved into unit - Moved in 1969 or earlier (%) - Asian
Year householder moved into unit - Moved in 1969 or earlier (%) - Hispanic or Latino
Year householder moved into unit - Moved in 1969 or earlier (%) - American Indian and Alaska Native
Year householder moved into unit - Moved in 1969 or earlier (%) - Multirace
Year householder moved into unit - Moved in 1969 or earlier (%) - Other Race
Housing units lacking complete plumbing facilities (%)
Housing units lacking complete kitchen facilities (%)
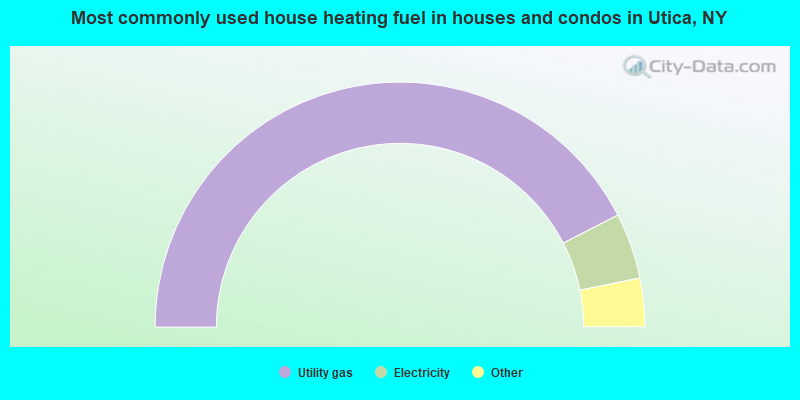
House heating fuel used in houses and condos - Utility gas (%)
House heating fuel used in houses and condos - Bottled, tank, or LP gas (%)
House heating fuel used in houses and condos - Electricity (%)
House heating fuel used in houses and condos - Fuel oil, kerosene, etc. (%)
House heating fuel used in houses and condos - Coal or coke (%)
House heating fuel used in houses and condos - Wood (%)
House heating fuel used in houses and condos - Solar energy (%)
House heating fuel used in houses and condos - Other fuel (%)
House heating fuel used in houses and condos - No fuel used (%)
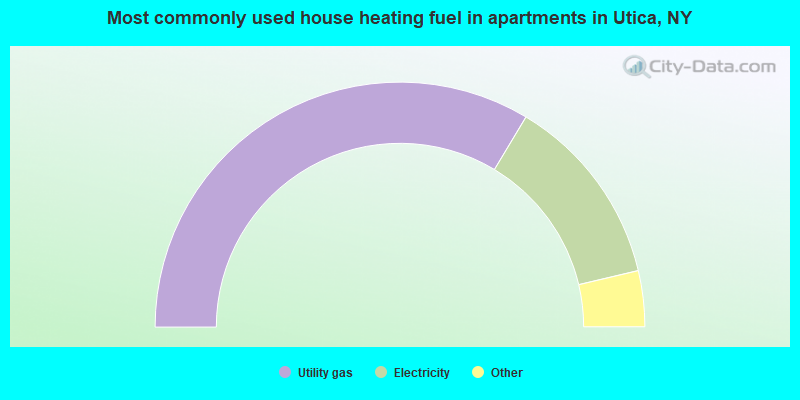
House heating fuel used in apartments - Utility gas (%)
House heating fuel used in apartments - Bottled, tank, or LP gas (%)
House heating fuel used in apartments - Electricity (%)
House heating fuel used in apartments - Fuel oil, kerosene, etc. (%)
House heating fuel used in apartments - Coal or coke (%)
House heating fuel used in apartments - Wood (%)
House heating fuel used in apartments - Solar energy (%)
House heating fuel used in apartments - Other fuel (%)
House heating fuel used in apartments - No fuel used (%)
Latest news about housing in Utica, NY collected exclusively by city-data.com from local newspapers, TV, and radio stations
Median year house/condo built: 1938Median year apartment built: 1950Household type by relationship:
Households: 64,109
Male householders: 11,908 (4,160 living alone ), Female householders: 12,473 (4,082 living alone )8,309 spouses (8,256 opposite-sex spouses ), 2,331 unmarried partners , (2,172 opposite-sex unmarried partners ), 20,434 children (19,847 natural , 386 adopted , 201 stepchildren ), 1,765 grandchildren , 582 brothers or sisters , 976 parents , 57 foster children , 956 other relatives , 1,497 non-relatives In group quarters: 2,814
Size of family households: 5,579 2-persons , 3,580 3-persons , 2,796 4-persons , 1,997 5-persons , 490 6-persons , 831 7-or-more-persons .
Size of nonfamily households: 8,782 1-person , 1,635 2-persons , 126 3-persons , 184 4-persons , 55 5-persons .
7,644 married couples with children. single-parent households (763 men , 5,812 women ).
65.9% of residents of Utica speak English at home. of residents speak Spanish at home (56% speak English very well , 31% speak English well , 9% speak English not well , 4% don't speak English at all ).of residents speak other Indo-European language at home (50% speak English very well , 18% speak English well , 26% speak English not well , 6% don't speak English at all ).of residents speak Asian or Pacific Island language at home (38% speak English very well , 30% speak English well , 20% speak English not well , 12% don't speak English at all ).of residents speak other language at home (63% speak English very well , 23% speak English well , 13% speak English not well , 1% don't speak English at all ).
Foreign born population: 14,249 (22.2%)of them are naturalized citizens )
Median number of rooms in houses and condos:
Median number of rooms in apartments
Owner-occupied Renter-occupied
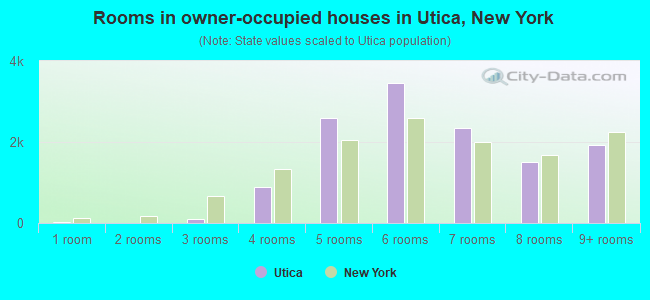
Rooms in owner-occupied houses in Utica, New York
19 1 room 6 2 rooms 92 3 rooms 892 4 rooms 2,590 5 rooms 3,469 6 rooms 2,351 7 rooms 1,511 8 rooms 1,928 9+ rooms
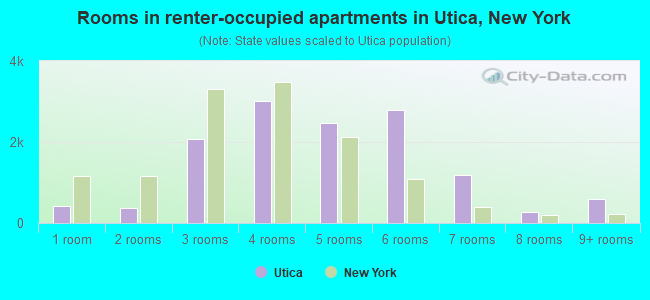
Rooms in renter-occupied apartments in Utica, New York
408 1 room 359 2 rooms 2,084 3 rooms 3,020 4 rooms 2,460 5 rooms 2,788 6 rooms 1,181 7 rooms 269 8 rooms 598 9+ rooms
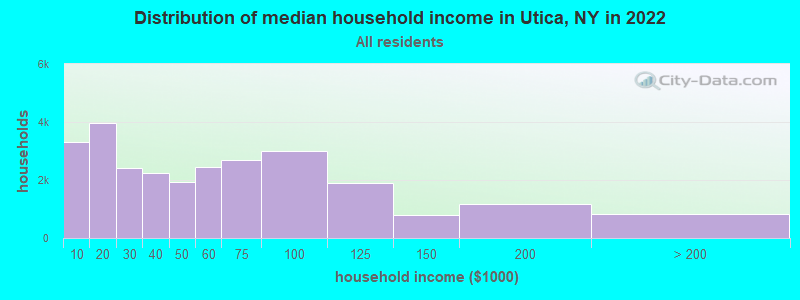
Utica, NY household income distribution 3,299 Less than $10,0003,973 $10,000 to $19,9992,409 $20,000 to $29,9992,249 $30,000 to $39,9991,915 $40,000 to $49,9992,458 $50,000 to $59,9992,699 $60,000 to $74,9992,989 $75,000 to $99,9991,890 $100,000 to $124,999789 $125,000 to $149,9991,179 $150,000 to $199,999826 $200,000 or more
Home value of owner - occupied houses in 2022 in Utica, NY 119 Less than $10,00095 $10,000 to $14,99951 $15,000 to $19,999140 $20,000 to $24,99944 $25,000 to $29,999104 $30,000 to $34,99982 $35,000 to $39,999244 $40,000 to $49,999285 $50,000 to $59,999361 $60,000 to $69,999734 $70,000 to $79,999909 $80,000 to $89,999788 $90,000 to $99,9991,790 $100,000 to $124,999990 $125,000 to $149,9991,658 $150,000 to $174,999721 $175,000 to $199,999918 $200,000 to $249,999694 $250,000 to $299,999320 $300,000 to $399,999580 $500,000 to $749,99998 $750,000 to $999,99914 $1,000,000 to $1,499,99925 $1,500,000 to $1,999,999136 $2,000,000 or moreRent paid by renters in 2022 in Utica, NY 540 Less than $10051 $100 to $149304 $150 to $199388 $200 to $249156 $250 to $299265 $300 to $349143 $350 to $399231 $400 to $449813 $450 to $499874 $500 to $549713 $550 to $599797 $600 to $6491,329 $650 to $6991,006 $700 to $7491,109 $750 to $7991,077 $800 to $8991,261 $900 to $999948 $1,000 to $1,249376 $1,250 to $1,499563 $1,500 to $1,999261 $2,000 to $2,499109 $2,500 to $2,99941 $3,000 to $3,49973 $3,500 or more439 No cash rent
Percentage of workers working in this county: 90.1%Number of people working at home: 2,356 (9.6% of all workers )
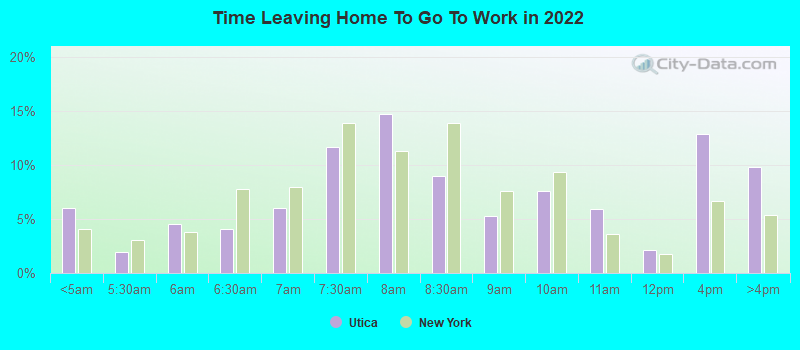
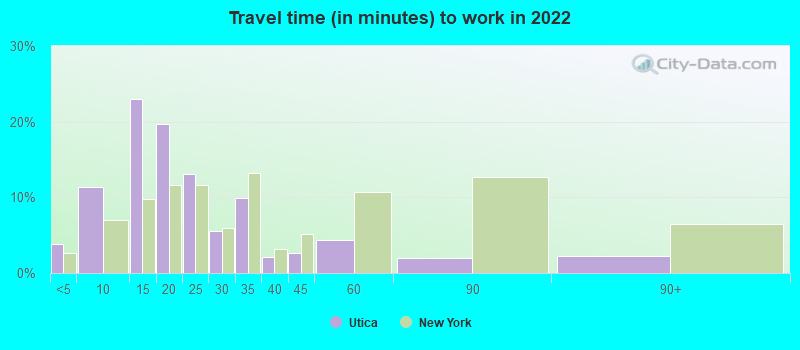
Travel time to work (commute)
Less than 5 minutes: 1,0795 to 9 minutes: 2,84810 to 14 minutes: 5,57015 to 19 minutes: 4,54820 to 24 minutes: 2,32125 to 29 minutes: 66730 to 34 minutes: 1,87435 to 39 minutes: 22240 to 44 minutes: 81445 to 59 minutes: 96860 to 89 minutes: 60290 or more minutes: 279
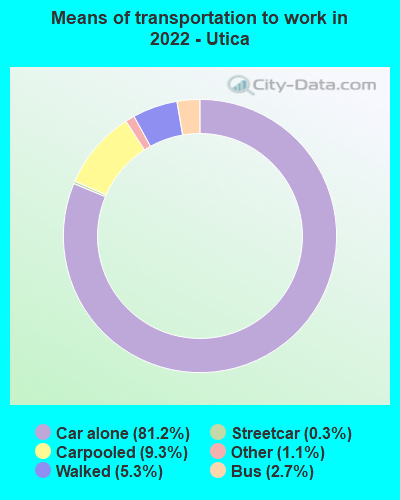
Means of transportation to work:
Drove a car alone: 23,035 (75.6%)Carpooled: 2,160 (7.1%)Bus : 791 (2.6%)Subway or elevated rail : 83 (0.3%)Ferryboat: 11 (0.0%)Taxi: 270 (0.9%)Bicycle: 16 (0.1%)Walked: 1,274 (4.2%)Worked at home: 2,356 (7.7%)
Unemployment by race in 2022
Unemployment rate for White non-Hispanic residents 4.6% Males3.4% FemalesUnemployment rate for Black residents 10.5% Males13.1% FemalesUnemployment rate for American Indian and Alaska Native residents 5.2% MalesUnemployment rate for Asian residents 2.8% Males2.6% FemalesUnemployment rate for other race residents 5.1% Males6.4% FemalesUnemployment rate for two or more race residents 7.2% Males8.1% FemalesUnemployment rate for Hispanic or Latino residents 7.4% Males4.6% Females
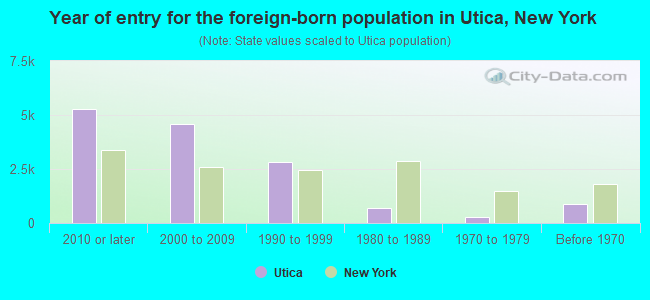
Year of entry for the foreign-born population in Utica, New York
5,263 2010 or later 4,606 2000 to 2009 2,822 1990 to 1999 691 1980 to 1989 266 1970 to 1979 872 Before 1970
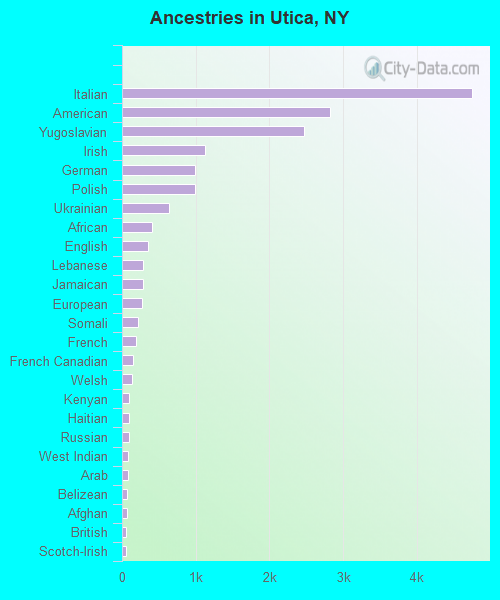
First ancestries reported:
Italian: 4,743 (13.0%)
American: 2,827 (7.8%)
Yugoslavian: 2,467 (6.8%)
Irish: 1,126 (3.1%)
German: 994 (2.7%)
Polish: 987 (2.7%)
Ukrainian: 641 (1.8%)
African: 413 (1.1%)
English: 357 (1.0%)
Lebanese: 286 (0.8%)
Jamaican: 279 (0.8%)
European: 267 (0.7%)
Somali: 211 (0.6%)
French: 186 (0.5%)
French Canadian: 149 (0.4%)
Welsh: 139 (0.4%)
Kenyan: 99 (0.3%)
Haitian: 99 (0.3%)
Russian: 96 (0.3%)
West Indian: 85 (0.2%)
Arab: 83 (0.2%)
Belizean: 66 (0.2%)
Afghan: 63 (0.2%)
British: 58 (0.2%)
Scotch-Irish: 58 (0.2%)
Dutch: 42 (0.1%)
Scottish: 39 (0.1%)
Croatian: 36 (0.10%)
Barbadian: 35 (0.10%)
Portuguese: 33 (0.09%)
Norwegian: 32 (0.09%)
Lithuanian: 29 (0.08%)
Guyanese: 29 (0.08%)
Swedish: 29 (0.08%)
Syrian: 28 (0.08%)
Slavic: 27 (0.07%)
Trinidadian and Tobagonian: 26 (0.07%)
Eastern European: 25 (0.07%)
Pennsylvania German: 25 (0.07%)
Sudanese: 22 (0.06%)
Northern European: 21 (0.06%)
Cajun: 21 (0.06%)
Hungarian: 15 (0.04%)
Ethiopian: 14 (0.04%)
Romanian: 14 (0.04%)
Iranian: 13 (0.04%)
Turkish: 10 (0.03%)
Serbian: 8 (0.02%)
Scandinavian: 4 (0.01%)
Ghanaian: 2 (0.01%)
Most common places of birth for foreign-born residents (%): Bosnia and Herzegovina Utica:
15.6% (2,217)New York:
0.2% (9,472)
Burma (Myanmar) Utica:
14.2% (2,021)New York:
0.4% (16,179)
Thailand Utica:
8.9% (1,261)New York:
0.3% (14,037)
Dominican Republic Utica:
8.7% (1,233)New York:
11.1% (501,040)
Vietnam Utica:
4.5% (638)New York:
0.6% (25,517)
Cambodia Utica:
3.5% (496)New York:
0.1% (3,044)
Yemen Utica:
3.2% (460)New York:
0.3% (14,772)
Belarus Utica:
2.5% (359)New York:
0.4% (17,813)
Jamaica Utica:
2.3% (321)New York:
5.0% (227,557)
Ukraine Utica:
2.2% (317)New York:
1.7% (78,421)
Somalia Utica:
2.1% (292)New York:
0.1% (3,340)
Kazakhstan Utica:
1.8% (259)New York:
0.1% (6,042)
Other Western Africa Utica:
1.8% (258)New York:
0.4% (19,133)
China, excluding Hong Kong and Taiwan Utica:
1.6% (223)New York:
9.1% (410,910)
Other Eastern Europe Utica:
1.5% (218)New York:
0.7% (30,173)
Place of birth for U.S.-born residents:
This state: 41,795Other state: 5,736Northeast: 1,805Midwest: 917South: 1,980West: 996 83.3% of Utica residents lived in the same house 1 years ago.
Out of people who lived in different houses, 39.3% lived in this county.
Out of people who lived in different counties, 86.0% lived in New York.
Utica:
83.3%State average:
89.6%
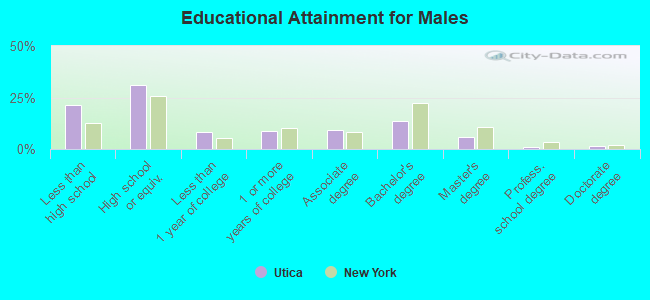
Education attainment for males 25 years and older:
No schooling: 1,156Nursery to 4th grade: 2965th and 6th grade: 777th and 8th grade: 4559th grade: 26210th grade: 57311th grade: 31412th grade, no diploma: 974High school graduate (or equivalency): 5,986Less than 1 year of college: 1,576Some college more than 1 year, no degree: 1,717Associate degree: 1,823Bachelor's degree: 2,610Master's degree: 1,107Professional school degree: 218Doctorate degree: 272
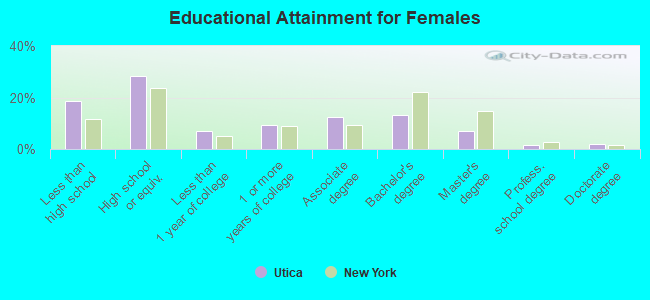
Education attainment for females 25 years and older:
No schooling: 1,439Nursery to 4th grade: 5385th and 6th grade: 2897th and 8th grade: 4879th grade: 17910th grade: 18011th grade: 43812th grade, no diploma: 373High school graduate (or equivalency): 5,977Less than 1 year of college: 1,501Some college more than 1 year, no degree: 1,984Associate degree: 2,640Bachelor's degree: 2,800Master's degree: 1,497Professional school degree: 302Doctorate degree: 371
Housing units in structures:
One, detached: 12,109One, attached: 952Two: 7,3653 or 4: 3,0005 to 9: 1,48010 to 19: 73020 to 49: 65450 or more: 1,997Mobile homes: 181Housing units lacking complete plumbing facilities in 2022: 1.6%Housing units lacking complete kitchen facilities in 2022: 2.6%House/condo owner moved in on average 14 years ago
Renter moved in on average 3 years ago
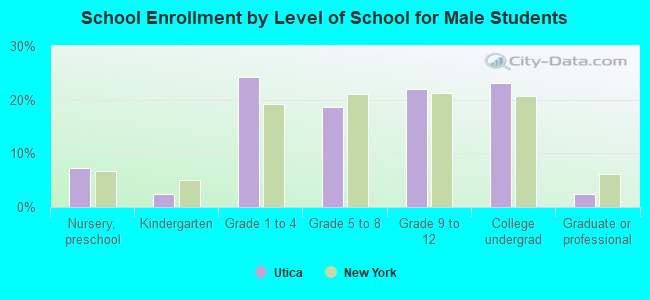
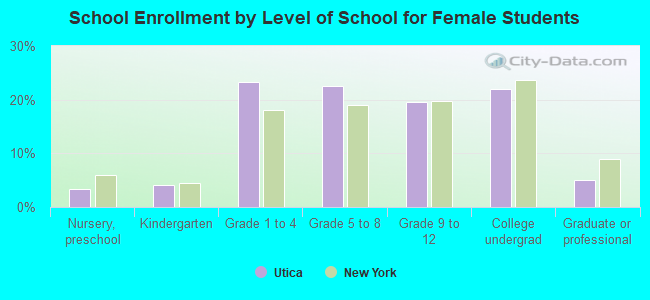
Private vs. public school enrollment:
Students in private schools in grades 1 to 8 (elementary and middle school): 305 Students in private schools in grades 9 to 12 (high school): 505 Students in private undergraduate colleges: 1,428