Urbana, OH (Ohio) Houses and Residents
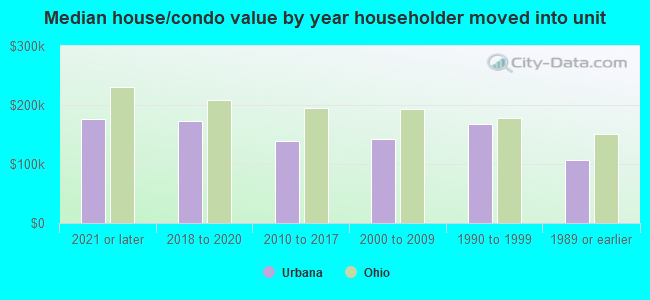
| Urbana: | $145,865 |
| Ohio: | $204,100 |
Total population: 11,524 (Urban population: 11,435 (all inside urban clusters), Rural population: 186 (all nonfarm))
Houses: 5,310 (4,729 occupied: 2,837 owner occupied, 1,941 renter occupied)
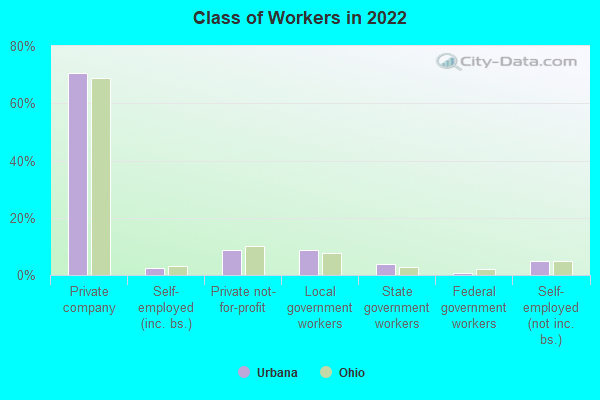
| % of renters here: | 41% |
| State: | 33% |
Housing density: 778 houses/condos per square mile
Median price asked for vacant for-sale houses and condos in 2022: $312,439.
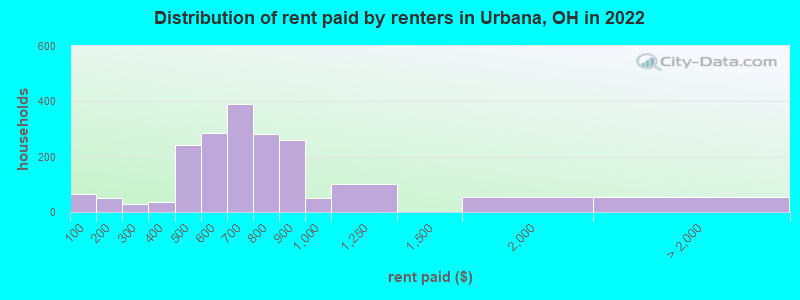
Median contract rent in 2022: $652 (lower quartile is $514, upper quartile is $840)
Median rent asked for vacant for-rent units in 2022: $668
Median gross rent in Urbana, OH in 2022: $848
Housing units in Urbana with a mortgage: 1,549 (140 second mortgage, 0 home equity loan, 90 both second mortgage and home equity loan)
Houses without a mortgage: 39
Median household income for houses/condos with a mortgage: $82,578
Median household income for apartments without a mortgage: $53,404
Median monthly housing costs: $835
Compare current foreclosures near Urbana, OH:
| Photo | Address | Area | Beds / Baths | Price | Details |
|---|---|---|---|---|---|

|
#1
W Water St
Urbana, OH 43078
|
1,344 sq. feet
|
1 baths 3 beds |
show details | |

|
#2
W Broadway St
Urbana, OH 43078
|
1,290 sq. feet
|
2 baths 3 beds |
show details | |

|
#3
Briarwood Dr
Urbana, OH 43078
|
1,952 sq. feet
|
2 baths 3 beds |
show details | |

|
#4
State Route 55
Urbana, OH 43078
|
1,960 sq. feet
|
2 baths 3 beds |
show details | |

|
#5
Lincoln Pl
Urbana, OH 43078
|
893 sq. feet
|
1 baths 2 beds |
show details | |

|
#6
Amherst Dr
Urbana, OH 43078
|
1,664 sq. feet
|
2 baths 3 beds |
show details | |

|
#7
Grimes Ave
Urbana, OH 43078
|
1,472 sq. feet
|
1 baths 3 beds |
show details | |

|
#8
Lincoln Pl
Urbana, OH 43078
|
1,422 sq. feet
|
1 baths 3 beds |
show details | |

|
#9
Players Ct
Urbana, OH 43078
|
1,644 sq. feet
|
2 baths 3 beds |
show details | |

|
#10
Millerstown Rd
Urbana, OH 43078
|
1,392 sq. feet
|
1 baths 3 beds |
show details |
| Photo | Address | Area | Beds / Baths | Price | Details |
|---|---|---|---|---|---|

|
#11
Parkway Blvd
Urbana, OH 43078
|
1,667 sq. feet
|
2 baths 3 beds |
show details | |

|
#12
State Route 54
Urbana, OH 43078
|
2,456 sq. feet
|
3 baths 4 beds |
show details | |

|
#13
N Oakland St
Urbana, OH 43078
|
1,982 sq. feet
|
1 baths 3 beds |
show details | |

|
#14
1/2 E Church St
Urbana, OH 43078
|
1,904 sq. feet
|
2 baths 4 beds |
show details | |

|
#15
Kennard Kingscreek Rd
Urbana, OH 43078
|
2,220 sq. feet
|
2 baths 3 beds |
show details | |

|
#16
S Walnut St
Urbana, OH 43078
|
3,248 sq. feet
|
3 baths 8 beds |
show details | |

|
#17
E Court St
Urbana, OH 43078
|
1,792 sq. feet
|
1 baths 3 beds |
show details | |

|
#18
Freeman Ave
Urbana, OH 43078
|
- sq. feet
|
- baths - beds |
show details | |

|
#19
Terry Ln
Urbana, OH 43078
|
- sq. feet
|
- baths - beds |
show details | |

|
#20
E Hickory Grove Rd Lot 47
Urbana, OH 43078
|
- sq. feet
|
- baths - beds |
show details |
| Photo | Address | Area | Beds / Baths | Price | Details |
|---|---|---|---|---|---|

|
#21
Lionel Dr
Urbana, OH 43078
|
- sq. feet
|
- baths - beds |
show details | |

|
#22
Concord St
Urbana, OH 43078
|
- sq. feet
|
- baths - beds |
show details | |

|
#23
W Court St
Urbana, OH 43078
|
- sq. feet
|
- baths - beds |
show details | |

|
#24
W County Line Rd
Urbana, OH 43078
|
- sq. feet
|
- baths - beds |
show details | |

|
#25
Lewis B Moore Dr Apt 106
Urbana, OH 43078
|
- sq. feet
|
- baths - beds |
show details | |

|
#26
N Rohrer St # 9
Urbana, OH 43078
|
- sq. feet
|
- baths - beds |
show details | |

|
#27
S High St
Urbana, OH 43078
|
- sq. feet
|
- baths - beds |
show details | |

|
#28
Jefferson Ave
Urbana, OH 43078
|
- sq. feet
|
- baths - beds |
show details | |

|
#29
E Water St
Urbana, OH 43078
|
319 sq. feet
|
- baths - beds |
show details | |

|
#30
W Main St
Saint Paris, OH 43072
|
1,571 sq. feet
|
1 baths 3 beds |
$38,900
|
show details |
| Photo | Address | Area | Beds / Baths | Price | Details |
|---|---|---|---|---|---|

|
#31
Pine St
Springfield, OH 45505
|
1,412 sq. feet
|
2 baths 3 beds |
$41,600
|
show details |

|
#32
Delaware Ave
Springfield, OH 45506
|
1,951 sq. feet
|
1 baths 4 beds |
$74,900
|
show details |

|
#33
Arthur Rd
Springfield, OH 45502
|
2,204 sq. feet
|
2 baths 3 beds |
$354,900
|
show details |

|
#34
Wren Ave
Bellefontaine, OH 43311
|
1,165 sq. feet
|
1 baths 3 beds |
show details | |

|
#35
Drew Ct
Springfield, OH 45503
|
1,008 sq. feet
|
1 baths 3 beds |
show details | |

|
#36
Gallagher St
Springfield, OH 45505
|
1,648 sq. feet
|
1 baths 2 beds |
show details | |

|
#37
State Route 56
Mechanicsburg, OH 43044
|
2,544 sq. feet
|
2 baths 3 beds |
show details | |

|
#38
Sunset Ave
Springfield, OH 45505
|
1,420 sq. feet
|
2 baths 3 beds |
show details | |

|
#39
Urbana St
Middleburg, OH 43336
|
1,334 sq. feet
|
1 baths 2 beds |
show details | |

|
#40
Heidi Rd
Bellefontaine, OH 43311
|
2,248 sq. feet
|
2 baths 5 beds |
show details |
| Photo | Address | Area | Beds / Baths | Price | Details |
|---|---|---|---|---|---|

|
#41
W 2nd St
Springfield, OH 45504
|
832 sq. feet
|
1 baths 2 beds |
show details | |

|
#42
Walker St
De Graff, OH 43318
|
1,758 sq. feet
|
1 baths 2 beds |
show details | |

|
#43
Nettlewood Ln
Springfield, OH 45502
|
1,974 sq. feet
|
2 baths 4 beds |
show details | |

|
#44
Harshman Blvd
Springfield, OH 45504
|
972 sq. feet
|
1 baths 3 beds |
show details | |

|
#45
Irwin Ave
Springfield, OH 45505
|
1,722 sq. feet
|
2 baths 4 beds |
show details | |

|
#46
Woodview Dr
Bellefontaine, OH 43311
|
2,000 sq. feet
|
2 baths 4 beds |
show details | |

|
#47
Spence Rd
New Carlisle, OH 45344
|
1,476 sq. feet
|
2 baths 2 beds |
show details | |

|
#48
Van Buren Ave
Springfield, OH 45505
|
928 sq. feet
|
1 baths 4 beds |
show details | |

|
#49
W High St
Springfield, OH 45506
|
866 sq. feet
|
1 baths 3 beds |
show details | |

|
Check over 1 million property listings on Foreclosure.com!
|
browse all offers | |||

Latest news about housing in Urbana, OH collected exclusively by city-data.com from local newspapers, TV, and radio stations

 | Excluding Cincinnati, how Appalachian-influenced is Southwestern Ohio on the whole? (60 replies) |
| Another string of positive media stories on Cleveland (485 replies) |
| What would be the best, most inexpensive way to buid a large home? (21 replies) |
| Opinions from transplants to Cincinnati wanted (137 replies) |
| Amazon takes a pass on Cincy (33 replies) |
| Urbana (6 replies) |

Median year apartment built: 1961
Household type by relationship:
Households: 11,138- Male householders: 2,017 (581 living alone), Female householders: 2,666 (935 living alone)
1,981 spouses (1,981 opposite-sex spouses), 487 unmarried partners, (475 opposite-sex unmarried partners), 2,746 children (2,447 natural, 57 adopted, 241 stepchildren), 256 grandchildren, 138 brothers or sisters, 24 parents, 11 foster children, 197 other relatives, 221 non-relatives
- In group quarters: 386
Size of family households: 1,318 2-persons, 816 3-persons, 256 4-persons, 180 5-persons, 161 6-persons, 119 7-or-more-persons.
Size of nonfamily households: 1,565 1-person, 300 2-persons, 47 3-persons, 27 5-persons.
1,293 married couples with children.
848 single-parent households (193 men, 655 women).
99.1% of residents of Urbana speak English at home.
0.5% of residents speak Spanish at home (76% speak English very well, 24% speak English well).
0.1% of residents speak Asian or Pacific Island language at home (80% speak English very well, 20% don't speak English at all).
Foreign born population: 31 (0.3%)
(25.8% of them are naturalized citizens)
| Here: | 6.7 |
| State: | 6.7 |
| Here: | 4.7 |
| State: | 4.4 |
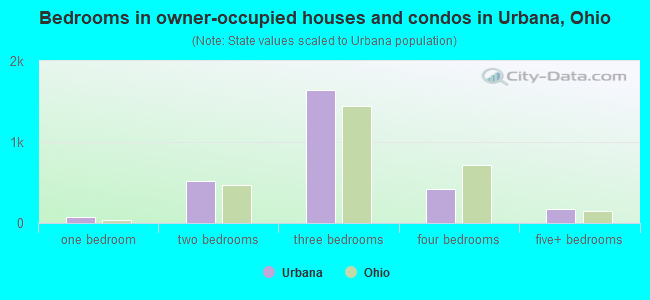
- Bedrooms in owner-occupied houses and condos in Urbana, Ohio
- 4no bedroom
- 781 bedroom
- 5192 bedrooms
- 1,6393 bedrooms
- 4204 bedrooms
- 1775+ bedrooms
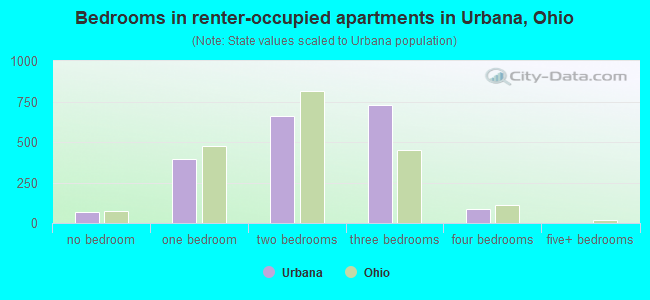
- Bedrooms in renter-occupied apartments in Urbana, Ohio
- 66no bedroom
- 3941 bedroom
- 6622 bedrooms
- 7303 bedrooms
- 894 bedrooms
- 05+ bedrooms
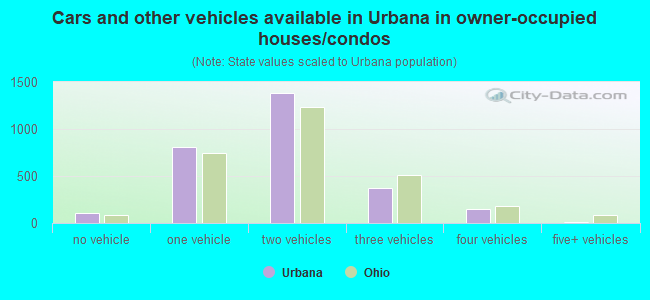
- Cars and other vehicles available in Urbana in owner-occupied houses/condos
- 111no vehicle
- 8091 vehicle
- 1,3802 vehicles
- 3773 vehicles
- 1484 vehicles
- 135+ vehicles
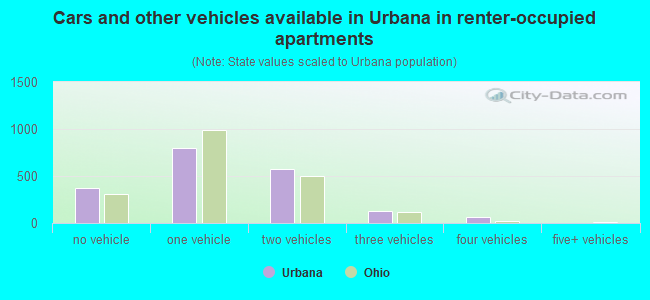
- Cars and other vehicles available in Urbana in renter-occupied apartments
- 377no vehicle
- 8031 vehicle
- 5752 vehicles
- 1263 vehicles
- 604 vehicles
- 05+ vehicles
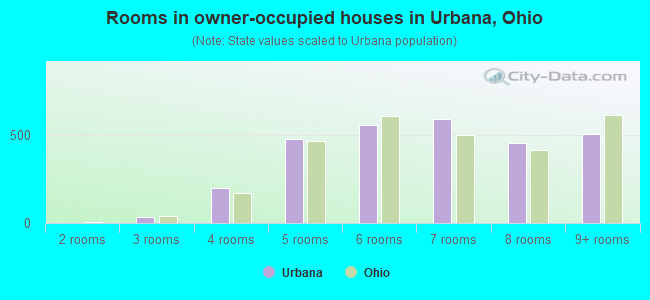
- Rooms in owner-occupied houses in Urbana, Ohio
- 41 room
- 02 rooms
- 373 rooms
- 2004 rooms
- 4795 rooms
- 5626 rooms
- 5937 rooms
- 4578 rooms
- 5069+ rooms
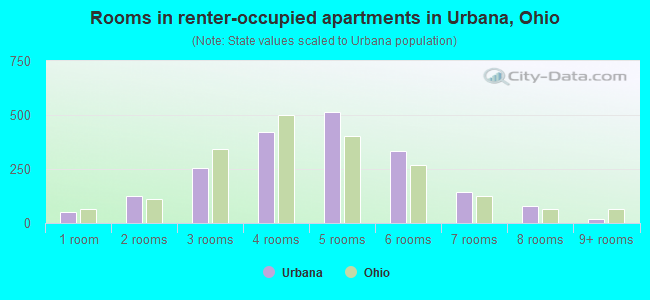
- Rooms in renter-occupied apartments in Urbana, Ohio
- 501 room
- 1272 rooms
- 2533 rooms
- 4224 rooms
- 5155 rooms
- 3336 rooms
- 1427 rooms
- 808 rooms
- 199+ rooms
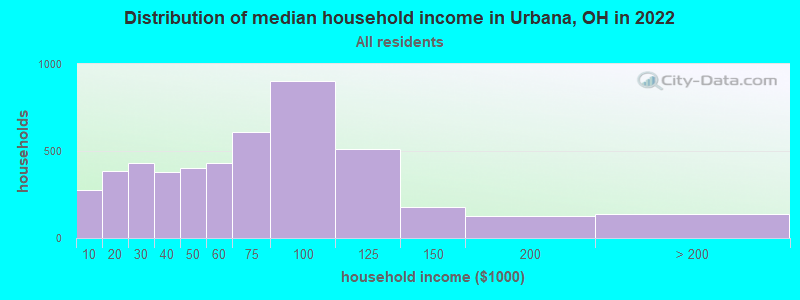
Urbana, OH household income distribution

- 274Less than $10,000
- 387$10,000 to $19,999
- 430$20,000 to $29,999
- 379$30,000 to $39,999
- 400$40,000 to $49,999
- 430$50,000 to $59,999
- 612$60,000 to $74,999
- 905$75,000 to $99,999
- 511$100,000 to $124,999
- 177$125,000 to $149,999
- 127$150,000 to $199,999
- 138$200,000 or more
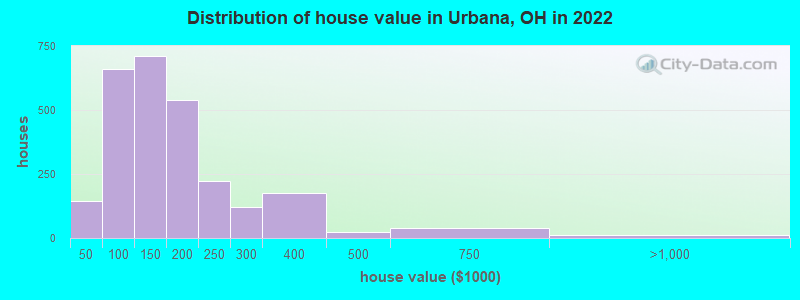
Home value of owner - occupied houses in 2022 in Urbana, OH
-
- 61Less than $10,000
- 19$10,000 to $14,999
- 14$30,000 to $34,999
- 50$40,000 to $49,999
- 19$50,000 to $59,999
- 17$60,000 to $69,999
- 71$70,000 to $79,999
- 282$80,000 to $89,999
- 216$90,000 to $99,999
- 376$100,000 to $124,999
- 334$125,000 to $149,999
- 338$150,000 to $174,999
- 198$175,000 to $199,999
- 221$200,000 to $249,999
- 122$250,000 to $299,999
- 174$300,000 to $399,999
- 22$400,000 to $499,999
- 40$500,000 to $749,999
- 13$750,000 to $999,999
Rent paid by renters in 2022 in Urbana, OH
-
- 64Less than $100
- 26$100 to $149
- 23$150 to $199
- 22$200 to $249
- 4$250 to $299
- 15$300 to $349
- 20$350 to $399
- 119$400 to $449
- 122$450 to $499
- 196$500 to $549
- 89$550 to $599
- 229$600 to $649
- 159$650 to $699
- 179$700 to $749
- 102$750 to $799
- 259$800 to $899
- 50$900 to $999
- 102$1,000 to $1,249
- 54$1,500 to $1,999
- 54No cash rent
Percentage of workers working in this county: 60.1%
Number of people working at home: 321 (6.2% of all workers)
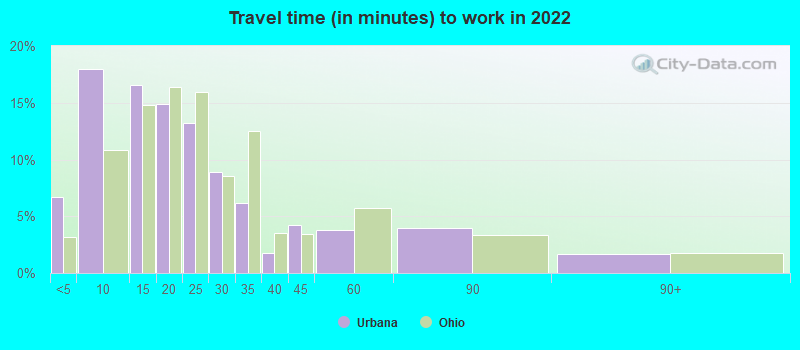
Travel time to work (commute)
- Less than 5 minutes: 433
- 5 to 9 minutes: 1,060
- 10 to 14 minutes: 715
- 15 to 19 minutes: 447
- 20 to 24 minutes: 403
- 25 to 29 minutes: 218
- 30 to 34 minutes: 534
- 35 to 39 minutes: 177
- 40 to 44 minutes: 87
- 45 to 59 minutes: 390
- 60 to 89 minutes: 131
- 90 or more minutes: 122
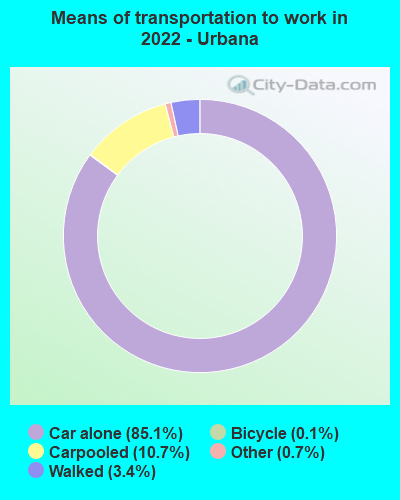
Means of transportation to work:
- Drove a car alone: 5,600 (78.7%)
- Carpooled: 757 (10.6%)
- Taxi: 55 (0.8%)
- Bicycle: 7 (0.1%)
- Walked: 226 (3.2%)
- Worked at home: 321 (4.5%)
- Unemployment by race in 2022
- Unemployment rate for White non-Hispanic residents
- 2.8%Males
- 3.5%Females
- Unemployment rate for two or more race residents
- 6.1%Females
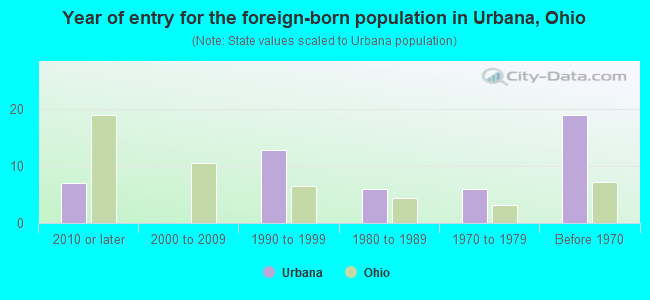
- Year of entry for the foreign-born population in Urbana, Ohio
- 72010 or later
- 02000 to 2009
- 131990 to 1999
- 61980 to 1989
- 61970 to 1979
- 19Before 1970
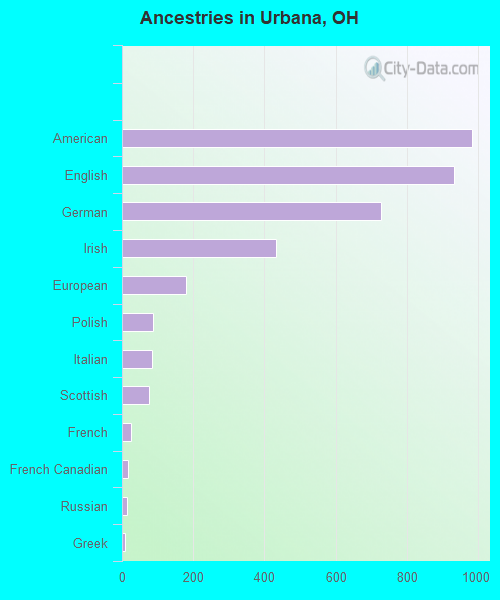
First ancestries reported:
- American: 982 (21.0%)
- English: 932 (19.9%)
- German: 729 (15.6%)
- Irish: 432 (9.2%)
- European: 180 (3.9%)
- Polish: 88 (1.9%)
- Italian: 84 (1.8%)
- Scottish: 77 (1.6%)
- French: 25 (0.5%)
- French Canadian: 17 (0.4%)
- Russian: 14 (0.3%)
- Greek: 9 (0.2%)
- Norwegian: 8 (0.2%)
- Slovak: 8 (0.2%)
- Swedish: 7 (0.1%)
- Swiss: 6 (0.1%)
- British: 4 (0.09%)
- Dutch: 3 (0.06%)
Most common places of birth for foreign-born residents (%):
| Urbana: | 25.8% (8) |
| Ohio: | 1.0% (5,979) |
| Urbana: | 22.6% (7) |
| Ohio: | 0.3% (1,763) |
| Urbana: | 19.4% (6) |
| Ohio: | 1.9% (10,960) |
| Urbana: | 16.1% (5) |
| Ohio: | 6.2% (35,703) |
| Urbana: | 9.7% (3) |
| Ohio: | 0.3% (1,793) |
Place of birth for U.S.-born residents:
- This state: 9,655
- Other state: 1,413
- Northeast: 191
- Midwest: 415
- South: 511
- West: 297
88.4% of Urbana residents lived in the same house 1 years ago.
Out of people who lived in different houses, 37.2% lived in this county.
Out of people who lived in different counties, 79.7% lived in Ohio.
| Urbana: | 88.4% |
| State average: | 87.8% |
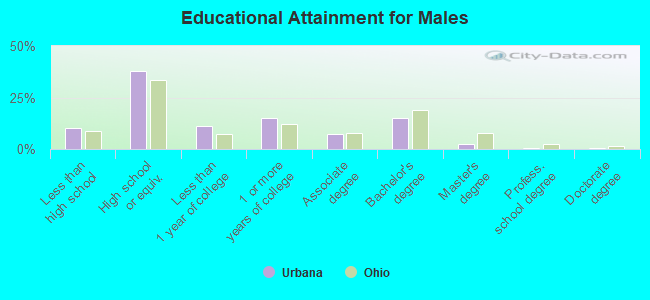
Education attainment for males 25 years and older:
- No schooling: 21
- Nursery to 4th grade: 55
- 5th and 6th grade: 0
- 7th and 8th grade: 15
- 9th grade: 52
- 10th grade: 28
- 11th grade: 120
- 12th grade, no diploma: 77
- High school graduate (or equivalency): 1,352
- Less than 1 year of college: 399
- Some college more than 1 year, no degree: 543
- Associate degree: 257
- Bachelor's degree: 548
- Master's degree: 90
- Professional school degree: 22
- Doctorate degree: 14
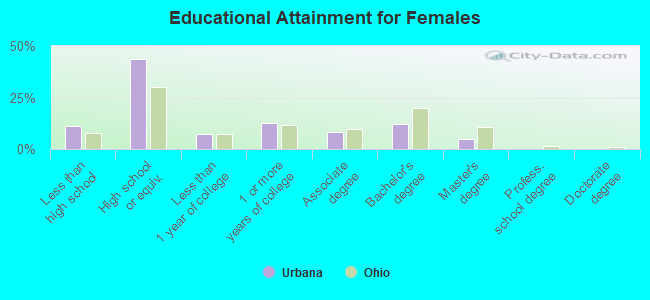
Education attainment for females 25 years and older:
- No schooling: 66
- Nursery to 4th grade: 10
- 5th and 6th grade: 0
- 7th and 8th grade: 62
- 9th grade: 44
- 10th grade: 65
- 11th grade: 103
- 12th grade, no diploma: 69
- High school graduate (or equivalency): 1,677
- Less than 1 year of college: 288
- Some college more than 1 year, no degree: 482
- Associate degree: 325
- Bachelor's degree: 456
- Master's degree: 184
- Professional school degree: 0
- Doctorate degree: 0


Housing units in structures:
- One, detached: 3,648
- One, attached: 173
- Two: 472
- 3 or 4: 323
- 5 to 9: 218
- 10 to 19: 191
- 20 to 49: 130
- 50 or more: 44
- Mobile homes: 106
Median worth of mobile homes: $11,069
Housing units lacking complete kitchen facilities in 2022: 3.1%
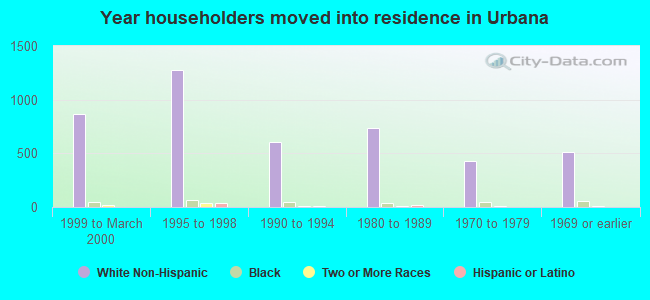
House/condo owner moved in on average 11 years ago
Renter moved in on average 2 years ago
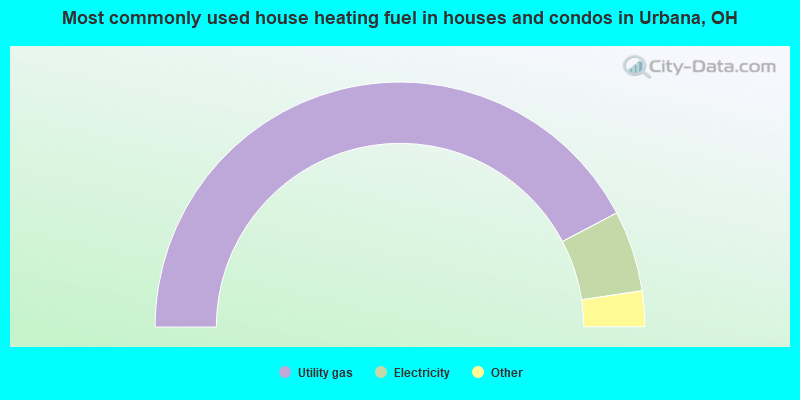
- 84.6%Utility gas
- 10.7%Electricity
- 2.7%Wood
- 1.5%Bottled, tank, or LP gas
- 0.5%No fuel used
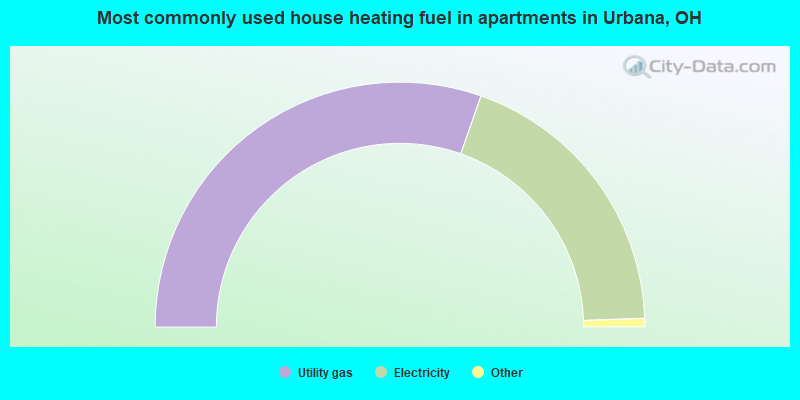
- 60.8%Utility gas
- 38.2%Electricity
- 0.6%Bottled, tank, or LP gas
- 0.5%No fuel used
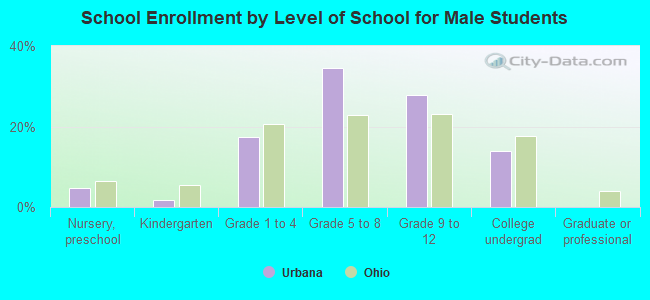
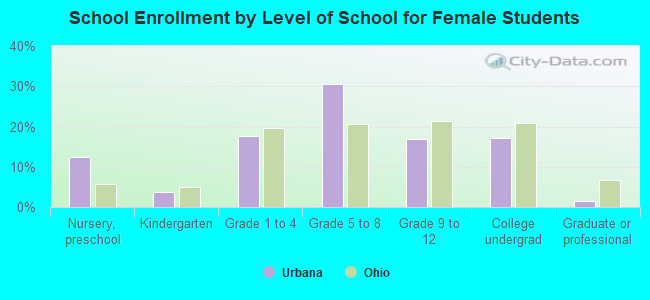
Private vs. public school enrollment:
| Here: | 4.2% |
| Ohio: | 16.0% |
| Here: | 0.0% |
| Ohio: | 13.1% |
| Here: | 48.3% |
| Ohio: | 22.3% |