Tucker, GA (Georgia) Houses and Residents
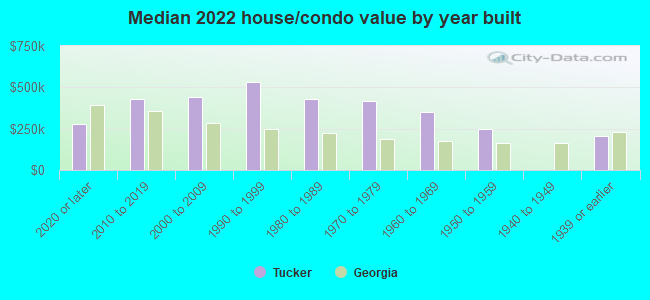
| Tucker: | $387,291 |
| Georgia: | $297,400 |
Mean price in 2022:
Detached houses: $351,325
Here: $351,325 State: $376,364 Townhouses or other attached units: $241,906
Here: $241,906 State: $341,709 In 3-to-4-unit structures: $146,675
Here: $146,675 State: $250,092 In 5-or-more-unit structures: $387,840
Here: $387,840 State: $370,730
Total population: 27,581 (Urban population: 26,616, Rural population: 0)
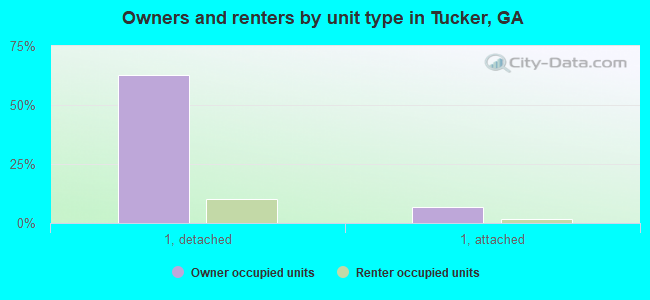
Houses: 16,942 (15,124 occupied: 9,455 owner occupied, 5,195 renter occupied)
| % of renters here: | 35% |
| State: | 34% |
Housing density: 1,410 houses/condos per square mile
Median price asked for vacant for-sale houses and condos in 2022: $413,269.
Median contract rent in 2022: $1,256 (lower quartile is $1,030, upper quartile is $1,603)
Median rent asked for vacant for-rent units in 2022: $1,453
Median gross rent in Tucker, GA in 2022: $1,477
Housing units in Tucker with a mortgage: 6,127 (413 second mortgage, 0 home equity loan, 426 both second mortgage and home equity loan)
Houses without a mortgage: 52
Median household income for houses/condos with a mortgage: $121,294
Median household income for apartments without a mortgage: $93,687
Median monthly housing costs: $1,420
Compare current foreclosures in Tucker, GA:
| Photo | Address | Area | Beds / Baths | Price | Details |
|---|---|---|---|---|---|

|
#1
Wedgeview Ct
Tucker, GA 30084
|
1,054 sq. feet
|
2 baths 2 beds |
show details | |

|
#2
Woodridge Way
Tucker, GA 30084
|
1,182 sq. feet
|
2 baths 2 beds |
show details | |

|
#3
Jonathan Ln
Tucker, GA 30084
|
2,239 sq. feet
|
2 baths 4 beds |
show details | |

|
#4
Triple Oaks Dr
Tucker, GA 30084
|
1,390 sq. feet
|
2 baths 2 beds |
show details | |

|
#5
Dillard Xing
Tucker, GA 30084
|
1,196 sq. feet
|
2 baths 2 beds |
show details | |

|
#6
Braxton Pl
Tucker, GA 30084
|
1,302 sq. feet
|
2 baths 2 beds |
show details | |

|
#7
Lavista Cir
Tucker, GA 30084
|
2,200 sq. feet
|
2 baths 4 beds |
show details | |

|
#8
Sterling Acres Ct
Tucker, GA 30084
|
2,208 sq. feet
|
3 baths 3 beds |
show details | |

|
#9
Maribee Dr
Tucker, GA 30084
|
3,515 sq. feet
|
2 baths 3 beds |
show details | |

|
#10
Brookside Manor Dr
Tucker, GA 30084
|
2,221 sq. feet
|
2 baths 3 beds |
show details |
| Photo | Address | Area | Beds / Baths | Price | Details |
|---|---|---|---|---|---|

|
#11
Lake Erin Dr
Tucker, GA 30084
|
1,555 sq. feet
|
2 baths 3 beds |
show details | |

|
#12
Emperor Way
Tucker, GA 30084
|
2,930 sq. feet
|
2 baths 4 beds |
show details | |

|
#13
Ivey Crest Cir
Tucker, GA 30084
|
1,376 sq. feet
|
2 baths 4 beds |
show details | |

|
#14
Allenwood Way
Tucker, GA 30084
|
2,204 sq. feet
|
2 baths 3 beds |
show details | |

|
#15
Old Norcross Rd
Tucker, GA 30084
|
2,303 sq. feet
|
2 baths 4 beds |
show details | |

|
#16
Idlevale Dr
Tucker, GA 30084
|
1,544 sq. feet
|
2 baths 3 beds |
show details | |

|
#17
Cana Of Galilee Ct
Tucker, GA 30084
|
1,805 sq. feet
|
2 baths 3 beds |
show details | |

|
#18
Lashley Dr
Tucker, GA 30084
|
2,075 sq. feet
|
2 baths 3 beds |
show details | |

|
#19
Robinhill Ct
Tucker, GA 30084
|
1,128 sq. feet
|
2 baths 3 beds |
show details | |

|
#20
Chamblee Tucker Rd
Tucker, GA 30084
|
1,382 sq. feet
|
1 baths 3 beds |
show details |
| Photo | Address | Area | Beds / Baths | Price | Details |
|---|---|---|---|---|---|

|
#21
Pine Meadows Ct
Tucker, GA 30084
|
2,305 sq. feet
|
2 baths 4 beds |
show details | |

|
#22
Cedar Cir
Tucker, GA 30084
|
1,513 sq. feet
|
2 baths 2 beds |
show details | |

|
#23
Cedar Cir
Tucker, GA 30084
|
784 sq. feet
|
1 baths 1 beds |
show details | |

|
#24
Ronald Rd
Tucker, GA 30084
|
1,496 sq. feet
|
2 baths 2 beds |
show details | |

|
#25
Pine Cove Dr
Tucker, GA 30084
|
2,676 sq. feet
|
2 baths 4 beds |
show details | |

|
#26
Timothy Ter
Tucker, GA 30084
|
2,381 sq. feet
|
2 baths 3 beds |
show details | |

|
#27
Hudson Xing Apt 4
Tucker, GA 30084
|
- sq. feet
|
- baths - beds |
show details | |

|
#28
Five Oaks Way
Tucker, GA 30084
|
- sq. feet
|
- baths - beds |
show details | |

|
#29
1st Ave Unit 2549
Tucker, GA 30085
|
- sq. feet
|
- baths - beds |
show details | |

|
#30
Northlake Pkwy Apt 14
Tucker, GA 30084
|
- sq. feet
|
- baths - beds |
show details |
| Photo | Address | Area | Beds / Baths | Price | Details |
|---|---|---|---|---|---|

|
#31
Dupont Ln
Tucker, GA 30084
|
- sq. feet
|
- baths - beds |
show details | |

|
#32
Oak Chase Dr Apt E
Tucker, GA 30084
|
- sq. feet
|
- baths - beds |
show details | |

|
#33
Pine Valley Rd Apt H4
Tucker, GA 30084
|
- sq. feet
|
- baths - beds |
show details | |

|
#34
Hugh Howell Rd # 1135
Tucker, GA 30084
|
- sq. feet
|
- baths - beds |
show details | |

|
#35
Montreal Cir # B
Tucker, GA 30084
|
- sq. feet
|
- baths - beds |
show details | |

|
#36
Wedgeview Dr
Tucker, GA 30084
|
- sq. feet
|
- baths - beds |
show details | |

|
#37
Hugh Howell Rd
Tucker, GA 30084
|
- sq. feet
|
- baths - beds |
show details | |

|
#38
Staley Dr
Tucker, GA 30084
|
- sq. feet
|
- baths - beds |
show details | |

|
#39
Five Oaks Way
Tucker, GA 30084
|
- sq. feet
|
- baths - beds |
show details | |

|
#40
Southern Woods Dr Apt D
Tucker, GA 30084
|
- sq. feet
|
- baths - beds |
show details |
| Photo | Address | Area | Beds / Baths | Price | Details |
|---|---|---|---|---|---|

|
#41
Cherokee Dr
Tucker, GA 30084
|
- sq. feet
|
- baths - beds |
show details | |

|
#42
Southern Woods Dr Apt F
Tucker, GA 30084
|
- sq. feet
|
- baths - beds |
show details | |

|
#43
Pine Valley Rd Apt C3
Tucker, GA 30084
|
- sq. feet
|
- baths - beds |
show details | |

|
#44
Northlake Pkwy # 1001
Tucker, GA 30084
|
- sq. feet
|
- baths - beds |
show details | |

|
#45
Hammermill Rd # B
Tucker, GA 30084
|
- sq. feet
|
- baths - beds |
show details | |

|
#46
Hugh Howell Rd # B308
Tucker, GA 30084
|
- sq. feet
|
- baths - beds |
show details | |

|
#47
Dogwood Point Ln
Tucker, GA 30084
|
- sq. feet
|
- baths - beds |
show details | |

|
#48
1st Ave # 1171
Tucker, GA 30084
|
- sq. feet
|
- baths - beds |
show details | |

|
#49
Lawrenceville Hwy Apt D6
Tucker, GA 30084
|
- sq. feet
|
- baths - beds |
show details | |

|
Check over 1 million property listings on Foreclosure.com!
|
browse all offers | |||

Latest news about housing in Tucker, GA collected exclusively by city-data.com from local newspapers, TV, and radio stations


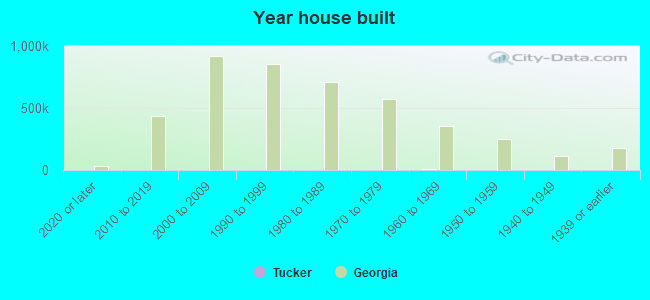
Median year apartment built: 1985
Household type by relationship:
Households: 37,072- Male householders: 6,770 (1,976 living alone), Female householders: 8,167 (2,867 living alone)
6,023 spouses (5,695 opposite-sex spouses), 1,170 unmarried partners, (884 opposite-sex unmarried partners), 9,370 children (8,703 natural, 222 adopted, 444 stepchildren), 678 grandchildren, 1,089 brothers or sisters, 981 parents, 0 foster children, 1,196 other relatives, 1,119 non-relatives
- In group quarters: 505
Size of family households: 4,802 2-persons, 2,117 3-persons, 1,071 4-persons, 449 5-persons, 237 6-persons, 202 7-or-more-persons.
Size of nonfamily households: 4,505 1-person, 1,084 2-persons, 196 3-persons, 21 5-persons.
3,629 married couples with children.
2,295 single-parent households (210 men, 2,085 women).
79.3% of residents of Tucker speak English at home.
8.1% of residents speak Spanish at home (53% speak English very well, 21% speak English well, 20% speak English not well, 7% don't speak English at all).
5.3% of residents speak other Indo-European language at home (58% speak English very well, 34% speak English well, 3% speak English not well, 5% don't speak English at all).
3.1% of residents speak Asian or Pacific Island language at home (42% speak English very well, 33% speak English well, 5% speak English not well, 20% don't speak English at all).
3.9% of residents speak other language at home (64% speak English very well, 27% speak English well, 7% speak English not well, 1% don't speak English at all).
Foreign born population: 5,924 (16.0%)
(55.0% of them are naturalized citizens)
| Here: | 7.3 |
| State: | 6.8 |
| Here: | 4.2 |
| State: | 4.6 |
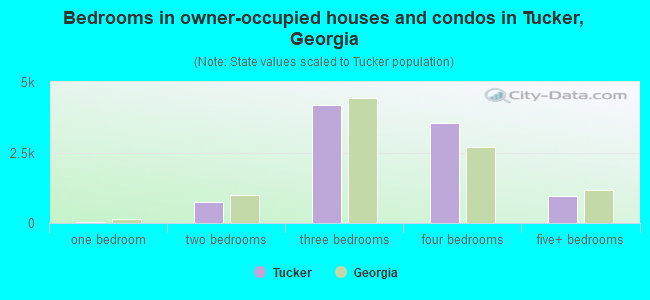
- Bedrooms in owner-occupied houses and condos in Tucker, Georgia
- 0no bedroom
- 271 bedroom
- 7292 bedrooms
- 4,1753 bedrooms
- 3,5514 bedrooms
- 9735+ bedrooms

- Bedrooms in renter-occupied apartments in Tucker, Georgia
- 131no bedroom
- 1,2561 bedroom
- 2,6262 bedrooms
- 8623 bedrooms
- 2994 bedrooms
- 225+ bedrooms
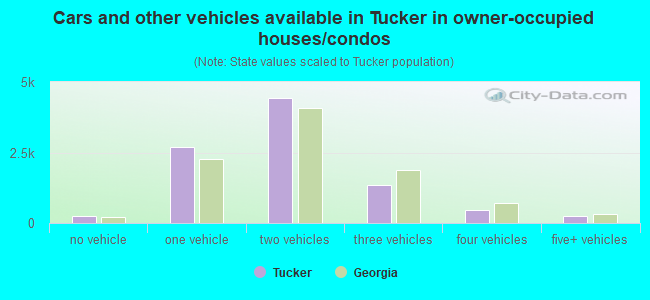
- Cars and other vehicles available in Tucker in owner-occupied houses/condos
- 263no vehicle
- 2,6981 vehicle
- 4,4402 vehicles
- 1,3593 vehicles
- 4574 vehicles
- 2385+ vehicles
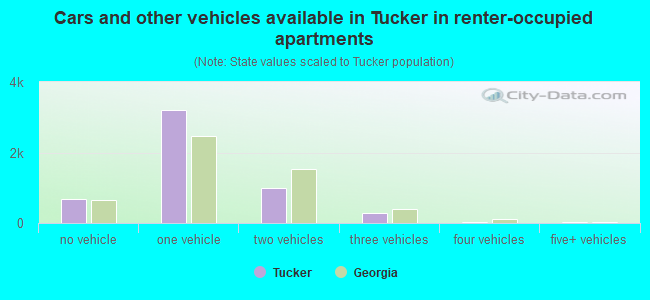
- Cars and other vehicles available in Tucker in renter-occupied apartments
- 680no vehicle
- 3,1951 vehicle
- 9912 vehicles
- 2763 vehicles
- 164 vehicles
- 375+ vehicles
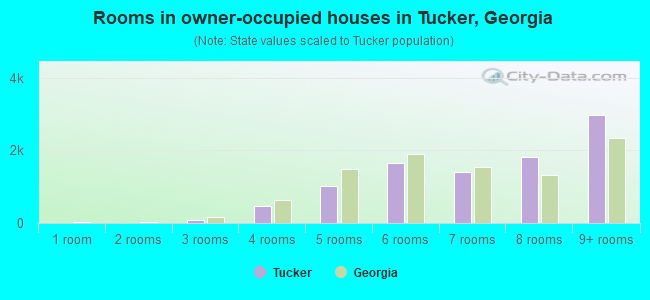
- Rooms in owner-occupied houses in Tucker, Georgia
- 01 room
- 02 rooms
- 793 rooms
- 4754 rooms
- 1,0155 rooms
- 1,6626 rooms
- 1,4187 rooms
- 1,8288 rooms
- 2,9789+ rooms
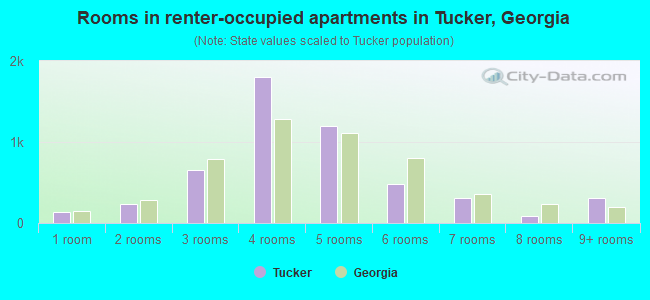
- Rooms in renter-occupied apartments in Tucker, Georgia
- 1311 room
- 2302 rooms
- 6523 rooms
- 1,7984 rooms
- 1,2035 rooms
- 4776 rooms
- 3127 rooms
- 878 rooms
- 3079+ rooms

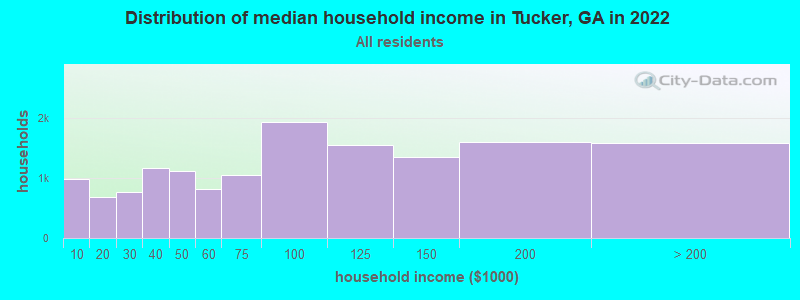
Tucker, GA household income distribution

- 983Less than $10,000
- 684$10,000 to $19,999
- 772$20,000 to $29,999
- 1,168$30,000 to $39,999
- 1,128$40,000 to $49,999
- 812$50,000 to $59,999
- 1,052$60,000 to $74,999
- 1,939$75,000 to $99,999
- 1,558$100,000 to $124,999
- 1,356$125,000 to $149,999
- 1,600$150,000 to $199,999
- 1,593$200,000 or more
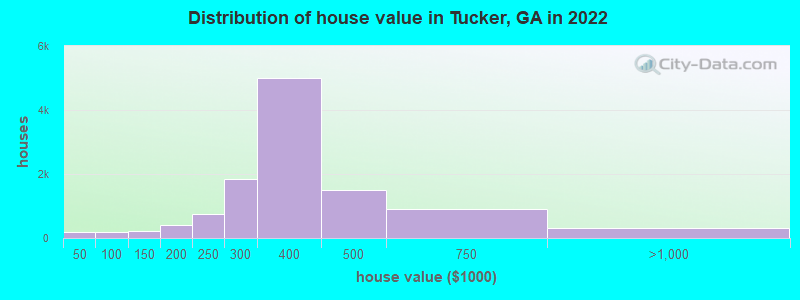
Home value of owner - occupied houses in 2022 in Tucker, GA
-
- 46Less than $10,000
- 57$30,000 to $34,999
- 94$40,000 to $49,999
- 3$50,000 to $59,999
- 18$60,000 to $69,999
- 60$70,000 to $79,999
- 17$90,000 to $99,999
- 162$100,000 to $124,999
- 60$125,000 to $149,999
- 137$150,000 to $174,999
- 257$175,000 to $199,999
- 734$200,000 to $249,999
- 1,830$250,000 to $299,999
- 5,014$300,000 to $399,999
- 1,511$400,000 to $499,999
- 909$500,000 to $749,999
- 266$750,000 to $999,999
- 17$1,000,000 to $1,499,999
- 40$2,000,000 or more
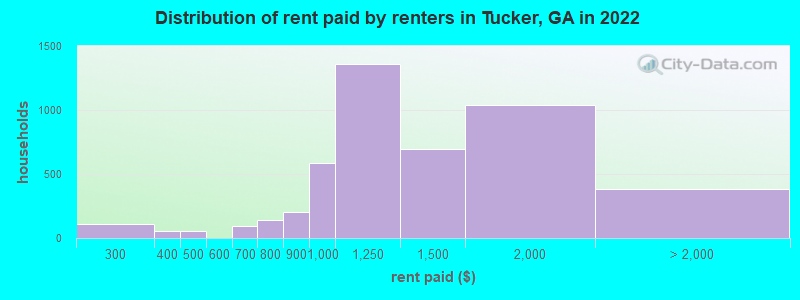
Rent paid by renters in 2022 in Tucker, GA
-
- 64$200 to $249
- 41$250 to $299
- 54$350 to $399
- 31$400 to $449
- 23$450 to $499
- 9$600 to $649
- 86$650 to $699
- 8$700 to $749
- 131$750 to $799
- 202$800 to $899
- 582$900 to $999
- 1,363$1,000 to $1,249
- 699$1,250 to $1,499
- 1,040$1,500 to $1,999
- 221$2,000 to $2,499
- 40$2,500 to $2,999
- 20$3,000 to $3,499
- 99No cash rent
Percentage of workers working in this county: 61.3%
Number of people working at home: 4,677 (26.4% of all workers)
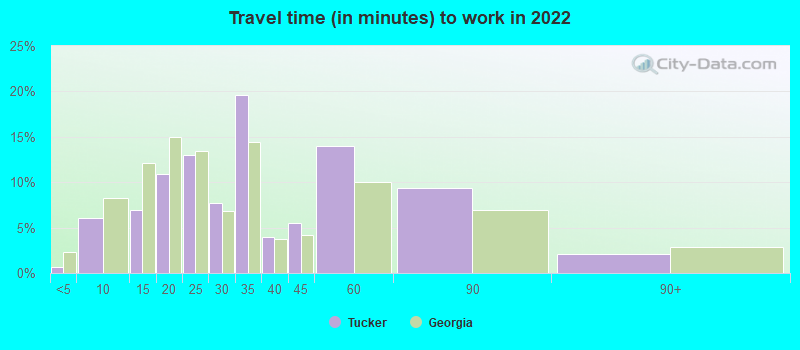
Travel time to work (commute)
- Less than 5 minutes: 147
- 5 to 9 minutes: 697
- 10 to 14 minutes: 1,339
- 15 to 19 minutes: 1,632
- 20 to 24 minutes: 1,562
- 25 to 29 minutes: 760
- 30 to 34 minutes: 2,720
- 35 to 39 minutes: 727
- 40 to 44 minutes: 799
- 45 to 59 minutes: 1,838
- 60 to 89 minutes: 663
- 90 or more minutes: 348
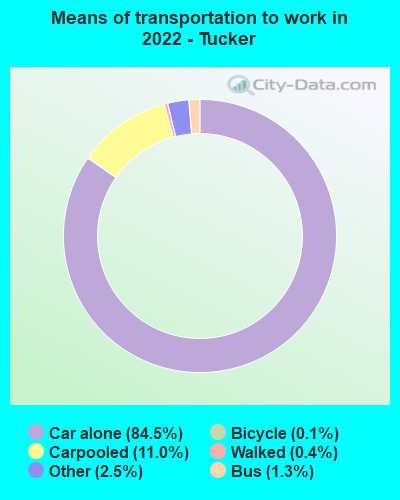
Means of transportation to work:
- Drove a car alone: 23,849 (71.1%)
- Carpooled: 2,792 (8.3%)
- Bus: 309 (0.9%)
- Subway or elevated rail: 12 (0.0%)
- Long-distance train or commuter rail: 11 (0.0%)
- Taxi: 602 (1.8%)
- Bicycle: 54 (0.2%)
- Walked: 143 (0.4%)
- Worked at home: 4,677 (13.9%)

- Unemployment by race in 2022
- Unemployment rate for White non-Hispanic residents
- 2.9%Males
- 2.3%Females
- Unemployment rate for Black residents
- 5.5%Males
- 5.8%Females
- Unemployment rate for Asian residents
- 1.9%Males
- 7.4%Females
- Unemployment rate for other race residents
- 2.0%Males
- 4.0%Females
- Unemployment rate for two or more race residents
- 13.3%Males
- 15.7%Females
- Unemployment rate for Hispanic or Latino residents
- 3.2%Males
- 2.4%Females

- Year of entry for the foreign-born population in Tucker, Georgia
- 1,7962010 or later
- 1,7392000 to 2009
- 1,1101990 to 1999
- 1,1391980 to 1989
- 4471970 to 1979
- 332Before 1970
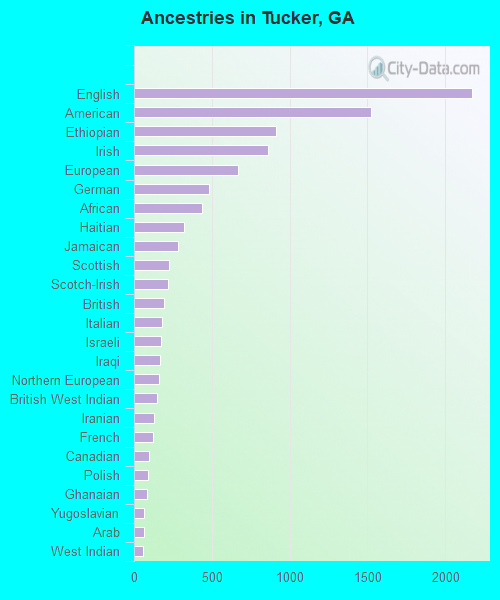
First ancestries reported:
- English: 2,173 (9.5%)
- American: 1,521 (6.7%)
- Ethiopian: 910 (4.0%)
- Irish: 860 (3.8%)
- European: 668 (2.9%)
- German: 483 (2.1%)
- African: 437 (1.9%)
- Haitian: 321 (1.4%)
- Jamaican: 286 (1.3%)
- Scottish: 228 (1.0%)
- Scotch-Irish: 217 (1.0%)
- British: 194 (0.9%)
- Italian: 183 (0.8%)
- Israeli: 173 (0.8%)
- Iraqi: 167 (0.7%)
- Northern European: 160 (0.7%)
- British West Indian: 146 (0.6%)
- Iranian: 131 (0.6%)
- French: 125 (0.5%)
- Canadian: 99 (0.4%)
- Polish: 87 (0.4%)
- Ghanaian: 81 (0.4%)
- Yugoslavian: 65 (0.3%)
- Arab: 63 (0.3%)
- West Indian: 55 (0.2%)
- Swedish: 52 (0.2%)
- Turkish: 45 (0.2%)
- Lebanese: 44 (0.2%)
- Egyptian: 31 (0.1%)
- Welsh: 26 (0.1%)
- Guyanese: 21 (0.09%)
- Russian: 17 (0.07%)
- Romanian: 16 (0.07%)
- Brazilian: 16 (0.07%)
- Lithuanian: 15 (0.07%)
- Bahamian: 13 (0.06%)
- Palestinian: 12 (0.05%)
- Eastern European: 11 (0.05%)
- Hungarian: 9 (0.04%)
- Swiss: 8 (0.04%)
- Greek: 7 (0.03%)
- Scandinavian: 5 (0.02%)
- Croatian: 4 (0.02%)
- French Canadian: 3 (0.01%)
- Ugandan: 3 (0.01%)
Most common places of birth for foreign-born residents (%):
| Tucker: | 13.3% (847) |
| Georgia: | 1.6% (17,643) |
| Tucker: | 9.0% (576) |
| Georgia: | 0.5% (5,046) |
| Tucker: | 7.6% (485) |
| Georgia: | 20.0% (223,400) |
| Tucker: | 7.4% (473) |
| Georgia: | 9.2% (103,325) |
| Tucker: | 5.4% (345) |
| Georgia: | 3.6% (39,974) |
| Tucker: | 4.8% (307) |
| Georgia: | 1.6% (17,476) |
| Tucker: | 4.3% (272) |
| Georgia: | 4.6% (51,270) |
| Tucker: | 4.3% (271) |
| Georgia: | 2.5% (27,794) |
| Tucker: | 3.2% (201) |
| Georgia: | 1.2% (12,946) |
| Tucker: | 2.5% (160) |
| Georgia: | 1.8% (20,700) |
| Tucker: | 2.5% (158) |
| Georgia: | 0.6% (6,388) |
| Tucker: | 2.3% (147) |
| Georgia: | 0.4% (4,775) |
| Tucker: | 2.2% (139) |
| Georgia: | 3.9% (43,756) |
| Tucker: | 2.1% (134) |
| Georgia: | 0.6% (6,717) |
| Tucker: | 2.0% (129) |
| Georgia: | 0.4% (4,066) |
| Tucker: | 2.0% (127) |
| Georgia: | 3.5% (39,227) |
| Tucker: | 1.8% (115) |
| Georgia: | 1.7% (19,012) |
| Tucker: | 1.7% (110) |
| Georgia: | 1.1% (11,847) |
| Tucker: | 1.7% (106) |
| Georgia: | 0.4% (3,921) |
| Tucker: | 1.6% (104) |
| Georgia: | 1.1% (12,223) |
| Tucker: | 1.5% (97) |
| Georgia: | 0.3% (3,330) |
Place of birth for U.S.-born residents:
- This state: 15,697
- Other state: 14,900
- Northeast: 2,991
- Midwest: 2,727
- South: 7,903
- West: 1,253
86.6% of Tucker residents lived in the same house 1 years ago.
Out of people who lived in different houses, 30.5% lived in this county.
Out of people who lived in different counties, 63.0% lived in Georgia.
| Tucker: | 86.6% |
| State average: | 86.6% |
Education attainment for males 25 years and older:
- No schooling: 387
- Nursery to 4th grade: 59
- 5th and 6th grade: 44
- 7th and 8th grade: 53
- 9th grade: 0
- 10th grade: 115
- 11th grade: 97
- 12th grade, no diploma: 265
- High school graduate (or equivalency): 2,758
- Less than 1 year of college: 519
- Some college more than 1 year, no degree: 1,522
- Associate degree: 798
- Bachelor's degree: 3,647
- Master's degree: 1,208
- Professional school degree: 400
- Doctorate degree: 445

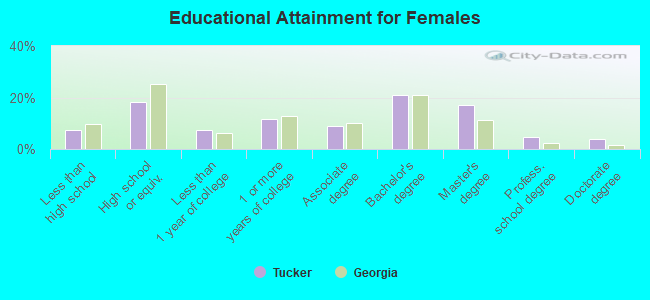
Education attainment for females 25 years and older:
- No schooling: 337
- Nursery to 4th grade: 78
- 5th and 6th grade: 36
- 7th and 8th grade: 85
- 9th grade: 42
- 10th grade: 141
- 11th grade: 52
- 12th grade, no diploma: 349
- High school graduate (or equivalency): 2,817
- Less than 1 year of college: 1,151
- Some college more than 1 year, no degree: 1,803
- Associate degree: 1,367
- Bachelor's degree: 3,264
- Master's degree: 2,609
- Professional school degree: 718
- Doctorate degree: 585


Housing units in structures:
- One, detached: 10,196
- One, attached: 1,585
- Two: 253
- 3 or 4: 632
- 5 to 9: 1,228
- 10 to 19: 1,741
- 20 to 49: 788
- 50 or more: 417
- Mobile homes: 89
- Boats, RVs, vans, etc.: 9
Housing units lacking complete kitchen facilities in 2022: 1.5%
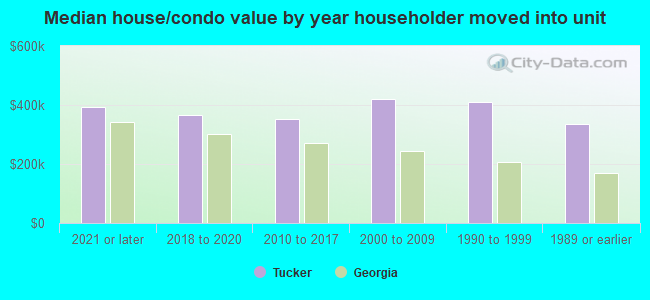
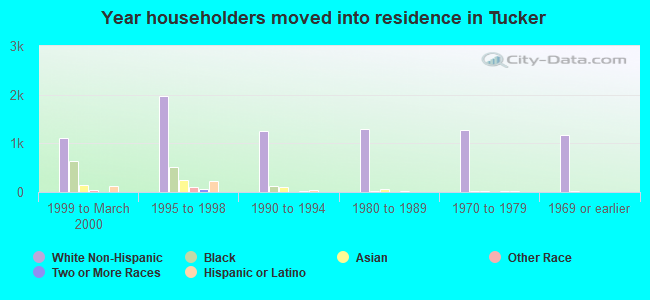
House/condo owner moved in on average 12 years ago
Renter moved in on average 2 years ago
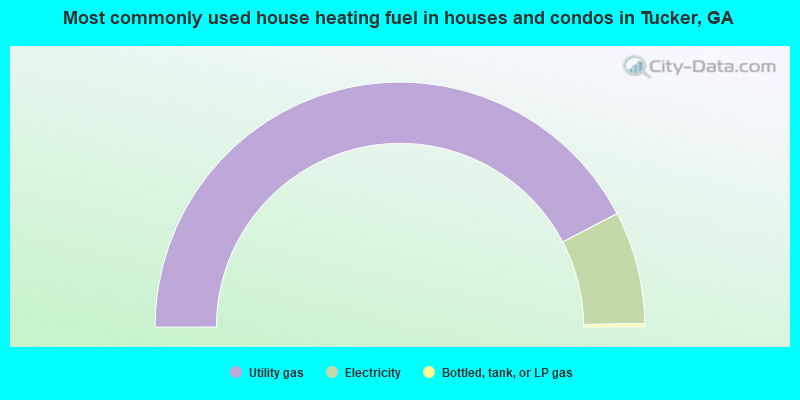
- 84.6%Utility gas
- 14.9%Electricity
- 0.4%Bottled, tank, or LP gas
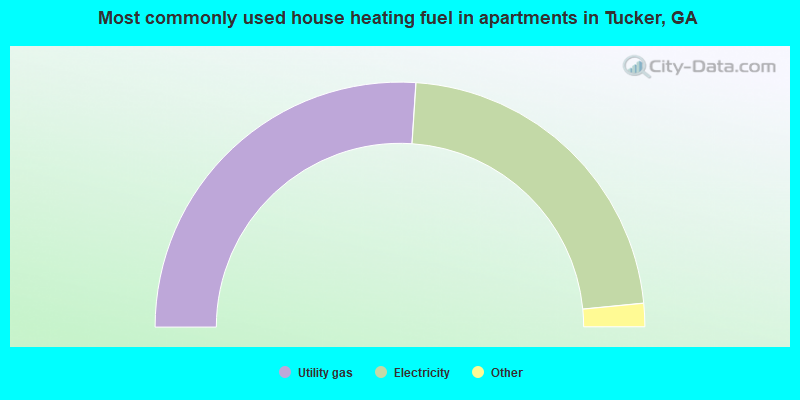
- 52.1%Utility gas
- 44.8%Electricity
- 1.6%Bottled, tank, or LP gas
- 1.0%No fuel used
- 0.3%Other fuel
- 0.2%Fuel oil, kerosene, etc.
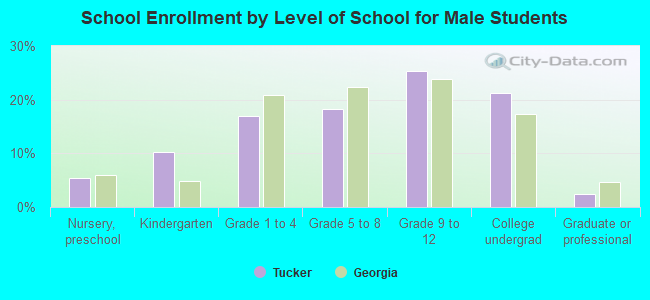
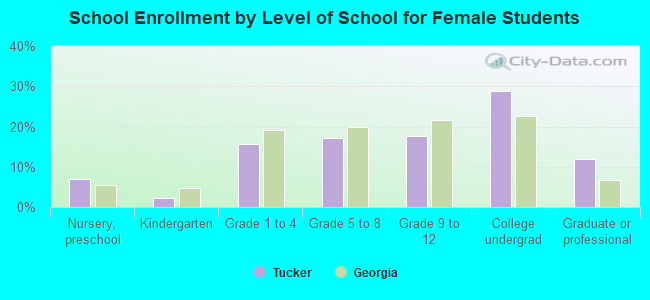
Private vs. public school enrollment:
| Here: | 20.2% |
| Georgia: | 12.1% |
| Here: | 9.6% |
| Georgia: | 10.8% |
| Here: | 9.9% |
| Georgia: | 17.1% |