Tinton Falls, NJ (New Jersey) Houses and Residents
Estimated median house or condo value in 2022: $484,277 (it was $172,500 in 2000 )
Tinton Falls:
$484,277New Jersey:
$428,900
Lower value quartile - upper value quartile: $335,833 - $672,841Mean price in 2022: Detached houses: $614,423 Here:
$614,423State:
$537,591
Townhouses or other attached units: $350,772 Here:
$350,772State:
$381,113
In 3-to-4-unit structures: $303,722 Here:
$303,722State:
$457,463
In 5-or-more-unit structures: $317,295 Here:
$317,295State:
$368,745
Total population: 17,898 (Urban population: 14,757, Rural population: 298 (all nonfarm) )
Houses: 8,972 (8,841 occupied: 7,101 owner occupied, 1,894 renter occupied )
% of renters here:
21%State:
35%
Housing density: 576 houses/condos per square mile
Median price asked for vacant for-sale houses and condos in 2022: $1,716,454.
Median contract rent in 2022: over $2,000 (lower quartile is $1,180, upper quartile is over $2,000)
Median rent asked for vacant for-rent units in 2022: $2,081
Median gross rent in Tinton Falls, NJ in 2022: over $2,000
Housing units in Tinton Falls with a mortgage: 4,407 (493 second mortgage, 0 home equity loan, 479 both second mortgage and home equity loan )Houses without a mortgage: 438
Median household income for houses/condos with a mortgage: $137,256
Median household income for apartments without a mortgage: $94,487
Median monthly housing costs: $1,901
Data:
Median house or condo value ($)
Median house or condo value ($ change since 2000)
Median house or condo value ($) - White
Median house or condo value ($) - Black or African American
Median house or condo value ($) - Asian
Median house or condo value ($) - Hispanic or Latino
Median house or condo value ($) - American Indian and Alaska Native
Median house or condo value ($) - Multirace
Median house or condo value ($) - Other Race
Median price asked for mobile homes ($)
Household density (households per square mile)
Mean house or condo value by units in structure - 1, detached ($)
Mean house or condo value by units in structure - 1, attached ($)
Mean house or condo value by units in structure - 2 ($)
Mean house or condo value by units in structure by units in structure - 3 or 4 ($)
Mean house or condo value by units in structure - 5 or more ($)
Mean house or condo value by units in structure - Boat, RV, van, etc. ($)
Mean house or condo value by units in structure - Mobile home ($)
Median contract rent ($)
Median contract rent - Lower quartile ($)
Median contract rent - Upper quartile ($)
Median gross rent ($)
Urban houses (%)
Rural houses (%)
Houses occupied (%)
Houses occupied (% change since 2000)
Houses owner occupied (%)
Houses owner occupied (% change since 2000)
Houses renter occupied (%)
Houses renter occupied (% change since 2000)
Vacant housing units - For rent (%)
Vacant housing units - For rent (% change since 2000)
Vacant housing units - For sale only (%)
Vacant housing units - For sale only (% change since 2000)
Vacant housing units - Rented or sold, not occupied (%)
Vacant housing units - Rented or sold, not occupied (% change since 2000)
Vacant housing units - For seasonal, recreational, or occasional use (%)
Vacant housing units - For seasonal, recreational, or occasional use (% change since 2000)
Vacant housing units - For migrant workers (%)
Vacant housing units - For migrant workers (% change since 2000)
Vacant housing units - Other vacant (%)
Vacant housing units - Other vacant (% change since 2000)
Median monthly housing costs ($)
Median household income for houses/condos with a mortgage ($)
Median household income for houses/condos without a mortgage ($)
Median household income ($)
Median household income ($) - White
Median household income ($) - Black or African American
Median household income ($) - Asian
Median household income ($) - Hispanic or Latino
Median household income ($) - American Indian and Alaska Native
Median household income ($) - Multirace
Median household income ($) - Other Race
Mortgage status - with mortgage (%)
Mortgage status - with second mortgage (%)
Mortgage status - with home equity loan (%)
Mortgage status - with both second mortgage and home equity loan (%)
Mortgage status - without a mortgage (%)
Median year house/condo built
Median year apartment built
Household type by relationship - Male householder living alone (%)
Household type by relationship - Male householder not living alone (%)
Household type by relationship - Female householder living alone (%)
Household type by relationship - Female householder not living alone (%)
Household type by relationship - Opposite-Sex spouse (%)
Household type by relationship - Same-Sex spouse (%)
Household type by relationship - Opposite-Sex unmarried partner (%)
Household type by relationship - Same-Sex unmarried partner (%)
Household type by relationship - In group quarters (%)
Size of family households - 2-person household (%)
Size of family households - 3-person household (%)
Size of family households - 4-person household (%)
Size of family households - 5-person household (%)
Size of family households - 6-person household (%)
Size of family households - 7-or-more-person household (%)
Size of nonfamily households - 1-person household (%)
Size of nonfamily households - 2-person household (%)
Size of nonfamily households - 3-person household (%)
Size of nonfamily households - 4-person household (%)
Size of nonfamily households - 5-person household (%)
Size of nonfamily households - 6-person household (%)
Size of nonfamily households - 7-or-moreperson household (%)
Year house built - Built 2010 or later (%)
Year house built - Built 2000 to 2009 (%)
Year house built - Built 1990 to 1999 (%)
Year house built - Built 1980 to 1989 (%)
Year house built - Built 1970 to 1979 (%)
Year house built - Built 1960 to 1969 (%)
Year house built - Built 1950 to 1959 (%)
Year house built - Built 1940 to 1949 (%)
Year house built - Built 1939 or earlier (%)
Median number of rooms in houses and condos
Median number of rooms in apartments
Median number of bedrooms in owner occupied houses
Mean number of bedrooms in owner occupied houses
Median number of bedrooms in renter occupied houses
Mean number of bedrooms in renter occupied houses
Median number of vehichles in owner occupied houses
Mean number of vehichles in owner occupied houses
Median number of vehichles in renter occupied houses
Mean number of vehichles in renter occupied houses
Rooms in owner-occupied houses - 1 room (%)
Rooms in owner-occupied houses - 2 rooms (%)
Rooms in owner-occupied houses - 3 rooms (%)
Rooms in owner-occupied houses - 4 rooms (%)
Rooms in owner-occupied houses - 5 rooms (%)
Rooms in owner-occupied houses - 6 rooms (%)
Rooms in owner-occupied houses - 7 rooms (%)
Rooms in owner-occupied houses - 8 rooms (%)
Rooms in owner-occupied houses - 9+ rooms (%)
Rooms in renter-occupied houses - 1 room (%)
Rooms in renter-occupied houses - 2 rooms (%)
Rooms in renter-occupied houses - 3 rooms (%)
Rooms in renter-occupied houses - 4 rooms (%)
Rooms in renter-occupied houses - 5 rooms (%)
Rooms in renter-occupied houses - 6 rooms (%)
Rooms in renter-occupied houses - 7 rooms (%)
Rooms in renter-occupied houses - 8 rooms (%)
Rooms in renter-occupied houses - 9+ rooms (%)
Bedrooms in owner-occupied houses - no bedrooms (%)
Bedrooms in owner-occupied houses - 1 bedroom (%)
Bedrooms in owner-occupied houses - 2 bedrooms (%)
Bedrooms in owner-occupied houses - 3 bedrooms (%)
Bedrooms in owner-occupied houses - 4 bedrooms (%)
Bedrooms in owner-occupied houses - 5+ bedrooms (%)
Bedrooms in renter-occupied houses - no bedrooms (%)
Bedrooms in renter-occupied houses - 1 bedroom (%)
Bedrooms in renter-occupied houses - 2 bedrooms (%)
Bedrooms in renter-occupied houses - 3 bedrooms (%)
Bedrooms in renter-occupied houses - 4 bedrooms (%)
Bedrooms in renter-occupied houses - 5+ bedrooms (%)
Vehicles available in owner-occupied houses - no vehicle available (%)
Vehicles available in owner-occupied houses - 1 vehicle available(%)
Vehicles available in owner-occupied houses - 2 Vehicles available (%)
Vehicles available in owner-occupied houses - 3 Vehicles available (%)
Vehicles available in owner-occupied houses - 4 Vehicles available (%)
Vehicles available in owner-occupied houses - 5+ Vehicles available (%)
Vehicles available in renter-occupied houses - no vehicle available (%)
Vehicles available in renter-occupied houses - 1 vehicle available (%)
Vehicles available in renter-occupied houses - 2 Vehicles available (%)
Vehicles available in renter-occupied houses - 3 Vehicles available (%)
Vehicles available in renter-occupied houses - 4 Vehicles available (%)
Vehicles available in renter-occupied houses - 5+ Vehicles available (%)
Housing units in structures - 1, detached (%)
Housing units in structures - 1, attached (%)
Housing units in structures - 2 (%)
Housing units in structures - 3 or 4 (%)
Housing units in structures - 5 to 9 (%)
Housing units in structures - 10 to 19 (%)
Housing units in structures - 20 to 49 (%)
Housing units in structures - 50 or more (%)
Housing units in structures - Mobile home (%)
Housing units in structures - Boat, RV, van, etc. (%)
Housing units in structures - Owners - 1, detached (%)
Housing units in structures - Owners - 1, attached (%)
Housing units in structures - Owners - 2 (%)
Housing units in structures - Owners - 3 or 4 (%)
Housing units in structures - Owners - 5 to 9 (%)
Housing units in structures - Owners - 10 to 19 (%)
Housing units in structures - Owners - 20 to 49 (%)
Housing units in structures - Owners - 50 or more (%)
Housing units in structures - Owners - Mobile home (%)
Housing units in structures - Owners - Boat, RV, van, etc. (%)
Housing units in structures - Renters - 1, detached (%)
Housing units in structures - Renters - 1, attached (%)
Housing units in structures - Renters - 2 (%)
Housing units in structures - Renters - 3 or 4 (%)
Housing units in structures - Renters - 5 to 9 (%)
Housing units in structures - Renters - 10 to 19 (%)
Housing units in structures - Renters - 20 to 49 (%)
Housing units in structures - Renters - 50 or more (%)
Housing units in structures - Renters - Mobile home (%)
Housing units in structures - Renters - Boat, RV, van, etc. (%)
House/condo owner moved in on average (years ago)
Renter moved in on average (years ago)
Year householder moved into unit - Moved in 1999 to March 2000 (%)
Year householder moved into unit - Moved in 1999 to March 2000 (%) - White
Year householder moved into unit - Moved in 1999 to March 2000 (%) - Black or African American
Year householder moved into unit - Moved in 1999 to March 2000 (%) - Asian
Year householder moved into unit - Moved in 1999 to March 2000 (%) - Hispanic or Latino
Year householder moved into unit - Moved in 1999 to March 2000 (%) - American Indian and Alaska Native
Year householder moved into unit - Moved in 1999 to March 2000 (%) - Multirace
Year householder moved into unit - Moved in 1999 to March 2000 (%) - Other Race
Year householder moved into unit - Moved in 1995 to 1998 (%)
Year householder moved into unit - Moved in 1995 to 1998 (%) - White
Year householder moved into unit - Moved in 1995 to 1998 (%) - Black or African American
Year householder moved into unit - Moved in 1995 to 1998 (%) - Asian
Year householder moved into unit - Moved in 1995 to 1998 (%) - Hispanic or Latino
Year householder moved into unit - Moved in 1995 to 1998 (%) - American Indian and Alaska Native
Year householder moved into unit - Moved in 1995 to 1998 (%) - Multirace
Year householder moved into unit - Moved in 1995 to 1998 (%) - Other Race
Year householder moved into unit - Moved in 1990 to 1994 (%)
Year householder moved into unit - Moved in 1990 to 1994 (%) - White
Year householder moved into unit - Moved in 1990 to 1994 (%) - Black or African American
Year householder moved into unit - Moved in 1990 to 1994 (%) - Asian
Year householder moved into unit - Moved in 1990 to 1994 (%) - Hispanic or Latino
Year householder moved into unit - Moved in 1990 to 1994 (%) - American Indian and Alaska Native
Year householder moved into unit - Moved in 1990 to 1994 (%) - Multirace
Year householder moved into unit - Moved in 1990 to 1994 (%) - Other Race
Year householder moved into unit - Moved in 1980 to 1989 (%)
Year householder moved into unit - Moved in 1980 to 1989 (%) - White
Year householder moved into unit - Moved in 1980 to 1989 (%) - Black or African American
Year householder moved into unit - Moved in 1980 to 1989 (%) - Asian
Year householder moved into unit - Moved in 1980 to 1989 (%) - Hispanic or Latino
Year householder moved into unit - Moved in 1980 to 1989 (%) - American Indian and Alaska Native
Year householder moved into unit - Moved in 1980 to 1989 (%) - Multirace
Year householder moved into unit - Moved in 1980 to 1989 (%) - Other Race
Year householder moved into unit - Moved in 1970 to 1979 (%)
Year householder moved into unit - Moved in 1970 to 1979 (%) - White
Year householder moved into unit - Moved in 1970 to 1979 (%) - Black or African American
Year householder moved into unit - Moved in 1970 to 1979 (%) - Asian
Year householder moved into unit - Moved in 1970 to 1979 (%) - Hispanic or Latino
Year householder moved into unit - Moved in 1970 to 1979 (%) - American Indian and Alaska Native
Year householder moved into unit - Moved in 1970 to 1979 (%) - Multirace
Year householder moved into unit - Moved in 1970 to 1979 (%) - Other Race
Year householder moved into unit - Moved in 1969 or earlier (%)
Year householder moved into unit - Moved in 1969 or earlier (%) - White
Year householder moved into unit - Moved in 1969 or earlier (%) - Black or African American
Year householder moved into unit - Moved in 1969 or earlier (%) - Asian
Year householder moved into unit - Moved in 1969 or earlier (%) - Hispanic or Latino
Year householder moved into unit - Moved in 1969 or earlier (%) - American Indian and Alaska Native
Year householder moved into unit - Moved in 1969 or earlier (%) - Multirace
Year householder moved into unit - Moved in 1969 or earlier (%) - Other Race
Housing units lacking complete plumbing facilities (%)
Housing units lacking complete kitchen facilities (%)
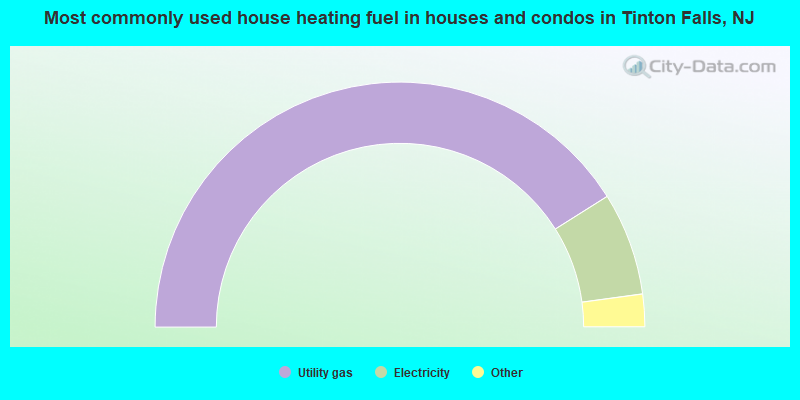
House heating fuel used in houses and condos - Utility gas (%)
House heating fuel used in houses and condos - Bottled, tank, or LP gas (%)
House heating fuel used in houses and condos - Electricity (%)
House heating fuel used in houses and condos - Fuel oil, kerosene, etc. (%)
House heating fuel used in houses and condos - Coal or coke (%)
House heating fuel used in houses and condos - Wood (%)
House heating fuel used in houses and condos - Solar energy (%)
House heating fuel used in houses and condos - Other fuel (%)
House heating fuel used in houses and condos - No fuel used (%)
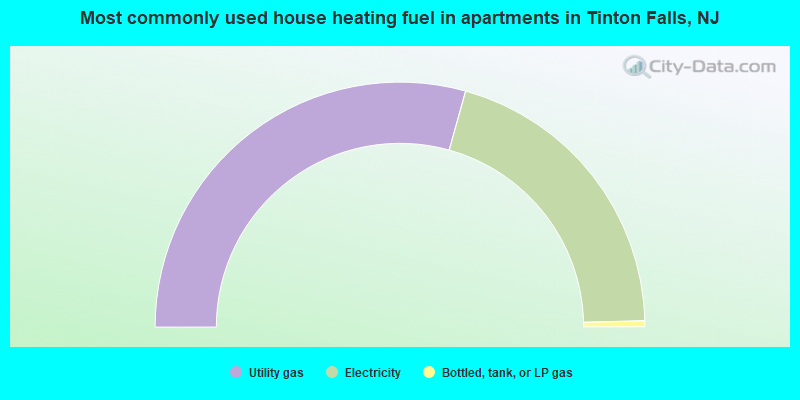
House heating fuel used in apartments - Utility gas (%)
House heating fuel used in apartments - Bottled, tank, or LP gas (%)
House heating fuel used in apartments - Electricity (%)
House heating fuel used in apartments - Fuel oil, kerosene, etc. (%)
House heating fuel used in apartments - Coal or coke (%)
House heating fuel used in apartments - Wood (%)
House heating fuel used in apartments - Solar energy (%)
House heating fuel used in apartments - Other fuel (%)
House heating fuel used in apartments - No fuel used (%)
Median year house/condo built: 1989Median year apartment built: 1997Household type by relationship:
Households: 19,210
Male householders: 4,174 (1,362 living alone ), Female householders: 4,634 (2,308 living alone )4,044 spouses (3,907 opposite-sex spouses ), 291 unmarried partners , (291 opposite-sex unmarried partners ), 4,807 children (4,563 natural , 197 adopted , 47 stepchildren ), 313 grandchildren , 22 brothers or sisters , 145 parents , 0 foster children , 254 other relatives , 250 non-relatives In group quarters: 272
Size of family households: 2,371 2-persons , 1,026 3-persons , 1,124 4-persons , 365 5-persons , 113 6-persons .
Size of nonfamily households: 3,660 1-person , 278 2-persons , 54 6-persons .
2,506 married couples with children. single-parent households (63 men , 395 women ).
84.4% of residents of Tinton Falls speak English at home. of residents speak Spanish at home (72% speak English very well , 15% speak English well , 11% speak English not well , 2% don't speak English at all ).of residents speak other Indo-European language at home (56% speak English very well , 24% speak English well , 18% speak English not well , 2% don't speak English at all ).of residents speak Asian or Pacific Island language at home (65% speak English very well , 29% speak English well , 5% speak English not well ).of residents speak other language at home (62% speak English very well , 18% speak English well , 20% speak English not well ).
Foreign born population: 2,612 (13.6%)of them are naturalized citizens )
Median number of rooms in houses and condos:
Median number of rooms in apartments
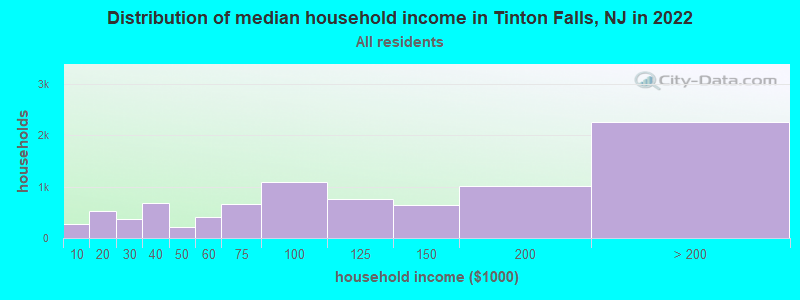
Tinton Falls, NJ household income distribution 280 Less than $10,000525 $10,000 to $19,999367 $20,000 to $29,999686 $30,000 to $39,999206 $40,000 to $49,999410 $50,000 to $59,999656 $60,000 to $74,9991,091 $75,000 to $99,999765 $100,000 to $124,999639 $125,000 to $149,9991,002 $150,000 to $199,9992,253 $200,000 or more
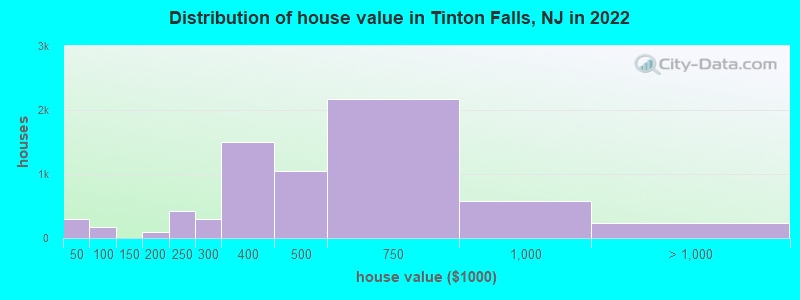
Home value of owner - occupied houses in 2022 in Tinton Falls, NJ 292 Less than $10,00076 $60,000 to $69,99949 $70,000 to $79,99942 $90,000 to $99,9994 $125,000 to $149,99995 $150,000 to $174,9993 $175,000 to $199,999427 $200,000 to $249,999292 $250,000 to $299,9991,497 $300,000 to $399,9991,040 $400,000 to $499,9992,175 $500,000 to $749,999580 $750,000 to $999,999197 $1,000,000 to $1,499,9994 $1,500,000 to $1,999,99935 $2,000,000 or moreRent paid by renters in 2022 in Tinton Falls, NJ 11 $650 to $69982 $700 to $74927 $800 to $899212 $900 to $999194 $1,000 to $1,24958 $1,250 to $1,499279 $1,500 to $1,999223 $2,000 to $2,499138 $2,500 to $2,999191 $3,000 to $3,499369 $3,500 or more148 No cash rent
Percentage of workers working in this county: 76.4%Number of people working at home: 1,894 (19.9% of all workers )
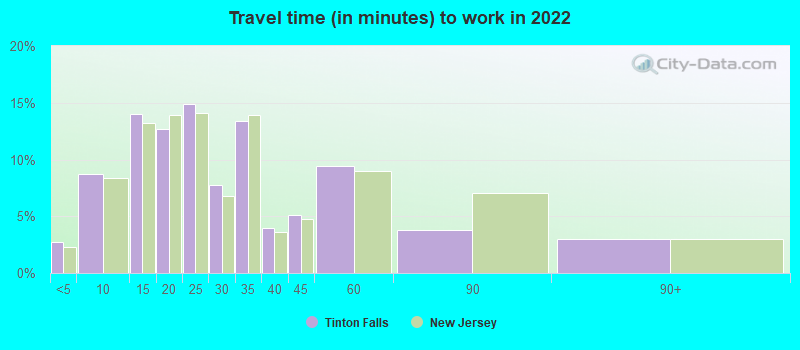
Travel time to work (commute)
Less than 5 minutes: 2785 to 9 minutes: 80010 to 14 minutes: 1,18215 to 19 minutes: 1,22920 to 24 minutes: 65425 to 29 minutes: 55730 to 34 minutes: 70035 to 39 minutes: 37940 to 44 minutes: 31945 to 59 minutes: 56560 to 89 minutes: 65390 or more minutes: 334
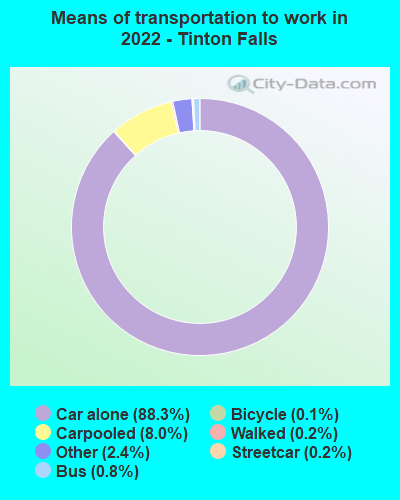
Means of transportation to work:
Drove a car alone: 9,252 (70.5%)Carpooled: 995 (7.6%)Bus : 131 (1.0%)Subway or elevated rail : 17 (0.1%)Ferryboat: 22 (0.2%)Taxi: 390 (3.0%)Bicycle: 10 (0.1%)Walked: 26 (0.2%)Worked at home: 1,894 (14.4%)
Unemployment by race in 2022
Unemployment rate for White non-Hispanic residents 3.5% Males3.4% FemalesUnemployment rate for Black residents 1.0% FemalesUnemployment rate for Asian residents 2.4% Males6.4% FemalesUnemployment rate for other race residents 8.5% MalesUnemployment rate for two or more race residents 19.4% Males2.3% FemalesUnemployment rate for Hispanic or Latino residents 16.9% Males
Year of entry for the foreign-born population in Tinton Falls, New Jersey
230 2010 or later 561 2000 to 2009 580 1990 to 1999 479 1980 to 1989 314 1970 to 1979 283 Before 1970
First ancestries reported:
Italian: 1,307 (13.2%)
Irish: 1,107 (11.1%)
American: 1,014 (10.2%)
Egyptian: 868 (8.7%)
German: 457 (4.6%)
Greek: 331 (3.3%)
Polish: 316 (3.2%)
English: 288 (2.9%)
Russian: 221 (2.2%)
European: 113 (1.1%)
Jamaican: 109 (1.1%)
Scottish: 102 (1.0%)
Lithuanian: 99 (1.0%)
British: 82 (0.8%)
Portuguese: 55 (0.6%)
Scotch-Irish: 52 (0.5%)
Brazilian: 40 (0.4%)
Hungarian: 33 (0.3%)
African: 33 (0.3%)
Ukrainian: 33 (0.3%)
Eastern European: 32 (0.3%)
Austrian: 30 (0.3%)
Latvian: 27 (0.3%)
Maltese: 26 (0.3%)
Norwegian: 25 (0.3%)
Haitian: 19 (0.2%)
Cypriot: 19 (0.2%)
Guyanese: 18 (0.2%)
Syrian: 17 (0.2%)
French: 15 (0.2%)
Slavic: 13 (0.1%)
Nigerian: 13 (0.1%)
Barbadian: 5 (0.05%)
West Indian: 4 (0.04%)
Scandinavian: 3 (0.03%) Most common places of birth for foreign-born residents (%): Egypt Tinton Falls:
16.4% (427)New Jersey:
1.6% (33,678)
Philippines Tinton Falls:
9.1% (236)New Jersey:
4.0% (85,934)
India Tinton Falls:
7.2% (187)New Jersey:
12.8% (274,609)
Nepal Tinton Falls:
6.7% (175)New Jersey:
0.1% (2,890)
Korea Tinton Falls:
5.9% (153)New Jersey:
3.3% (70,512)
Jamaica Tinton Falls:
4.6% (119)New Jersey:
2.2% (47,365)
Latvia Tinton Falls:
4.4% (115)New Jersey:
0.1% (1,789)
Cuba Tinton Falls:
3.7% (97)New Jersey:
2.1% (45,435)
Germany Tinton Falls:
3.5% (91)New Jersey:
0.8% (17,217)
China, excluding Hong Kong and Taiwan Tinton Falls:
3.4% (89)New Jersey:
3.7% (78,969)
Peru Tinton Falls:
3.1% (81)New Jersey:
2.7% (58,563)
Brazil Tinton Falls:
2.6% (68)New Jersey:
2.1% (46,020)
Argentina Tinton Falls:
2.4% (63)New Jersey:
0.5% (10,607)
Colombia Tinton Falls:
1.9% (50)New Jersey:
4.2% (90,817)
United Kingdom, excluding England and Scotland Tinton Falls:
1.8% (48)New Jersey:
0.6% (12,793)
Greece Tinton Falls:
1.8% (47)New Jersey:
0.3% (7,501)
Poland Tinton Falls:
1.7% (44)New Jersey:
2.3% (48,811)
El Salvador Tinton Falls:
1.7% (43)New Jersey:
2.3% (48,885)
Dominican Republic Tinton Falls:
1.5% (40)New Jersey:
9.7% (209,055)
Place of birth for U.S.-born residents:
This state: 11,558Other state: 4,815Northeast: 3,585Midwest: 251South: 723West: 276 93.9% of Tinton Falls residents lived in the same house 1 years ago.
Out of people who lived in different houses, 34.8% lived in this county.
Out of people who lived in different counties, 69.1% lived in New Jersey.
Tinton Falls:
93.9%State average:
90.4%
Education attainment for males 25 years and older:
No schooling: 5Nursery to 4th grade: 135th and 6th grade: 137th and 8th grade: 299th grade: 1210th grade: 1011th grade: 2712th grade, no diploma: 2High school graduate (or equivalency): 1,033Less than 1 year of college: 278Some college more than 1 year, no degree: 519Associate degree: 533Bachelor's degree: 2,808Master's degree: 929Professional school degree: 206Doctorate degree: 317
Education attainment for females 25 years and older:
No schooling: 37Nursery to 4th grade: 05th and 6th grade: 567th and 8th grade: 199th grade: 310th grade: 1311th grade: 3212th grade, no diploma: 60High school graduate (or equivalency): 1,782Less than 1 year of college: 447Some college more than 1 year, no degree: 615Associate degree: 549Bachelor's degree: 2,121Master's degree: 1,331Professional school degree: 227Doctorate degree: 279
Housing units in structures:
One, detached: 4,100One, attached: 1,8413 or 4: 2695 to 9: 40210 to 19: 23620 to 49: 23050 or more: 1,892Housing units lacking complete plumbing facilities in 2022: 1.1%Housing units lacking complete kitchen facilities in 2022: 5.1%House/condo owner moved in on average 10 years ago
Renter moved in on average 5 years ago
Private vs. public school enrollment:
Students in private schools in grades 1 to 8 (elementary and middle school): 53 Here:
4.1%New Jersey:
12.3%
Students in private schools in grades 9 to 12 (high school): 318 Here:
23.5%New Jersey:
13.1%
Students in private undergraduate colleges: 157 Here:
21.1%New Jersey:
33.2%