Terryville, NY (New York) Houses and Residents
| Terryville: | $483,881 |
| New York: | $400,400 |
Total population: 11,849 (Urban population: 10,592, Rural population: 0)
Houses: 4,046 (3,831 occupied: 2,924 owner occupied, 905 renter occupied)
| % of renters here: | 24% |
| State: | 46% |
Housing density: 1,259 houses/condos per square mile
Median price asked for vacant for-sale houses and condos in 2022: $737,127.
Median contract rent in 2022: $1,911 (lower quartile is $1,298, upper quartile is over $2,000)
Median rent asked for vacant for-rent units in 2022: $1,485
Median gross rent in Terryville, NY in 2022: over $2,000
Housing units in Terryville with a mortgage: 2,216 (273 second mortgage, 0 home equity loan, 258 both second mortgage and home equity loan)
Houses without a mortgage: 84
Median household income for houses/condos with a mortgage: $145,838
Median household income for apartments without a mortgage: $85,053
Median monthly housing costs: $2,524
Compare current foreclosures near Terryville, NY:
| Photo | Address | Area | Beds / Baths | Price | Details |
|---|---|---|---|---|---|

|
#1
Bayview Ave
Patchogue, NY 11772
|
1,488 sq. feet
|
1 baths 4 beds |
$585,000
|
show details |

|
#2
Laurel Ln
Shirley, NY 11967
|
1,032 sq. feet
|
1 baths 3 beds |
$479,900
|
show details |

|
#3
Lorring St
Patchogue, NY 11772
|
1,230 sq. feet
|
2 baths 3 beds |
$342,400
|
show details |

|
#4
Messina Ave
Center Moriches, NY 11934
|
2,600 sq. feet
|
2 baths 4 beds |
$820,000
|
show details |

|
#5
Silverleaf Ln
Islandia, NY 11749
|
1,932 sq. feet
|
3 baths 3 beds |
$655,000
|
show details |

|
#6
Timber Ridge Dr
Commack, NY 11725
|
2,564 sq. feet
|
2 baths 4 beds |
$884,000
|
show details |

|
#7
Jillit Dr
Smithtown, NY 11787
|
1,480 sq. feet
|
1 baths 3 beds |
$775,000
|
show details |

|
#8
Rocky Point Yaphank Rd
Rocky Point, NY 11778
|
1,000 sq. feet
|
1 baths 2 beds |
$189,900
|
show details |

|
#9
Rocky Point Yaphank Rd
Rocky Point, NY 11778
|
850 sq. feet
|
1 baths 1 beds |
$192,900
|
show details |

|
#10
Lincoln Blvd
Bay Shore, NY 11706
|
- sq. feet
|
2 baths 3 beds |
$490,000
|
show details |
| Photo | Address | Area | Beds / Baths | Price | Details |
|---|---|---|---|---|---|

|
#11
Mill Dr
Mastic Beach, NY 11951
|
- sq. feet
|
1 baths 1 beds |
$244,900
|
show details |

|
#12
Meadowbrook Dr
Sound Beach, NY 11789
|
- sq. feet
|
1 baths 3 beds |
$249,900
|
show details |

|
#13
Rocky Point Yaphank Rd Apt 146
Rocky Point, NY 11778
|
- sq. feet
|
1 baths 1 beds |
$199,900
|
show details |

|
#14
Whiskey Rd
Coram, NY 11727
|
- sq. feet
|
3 baths 4 beds |
$549,900
|
show details |

|
#15
Victor Dr
East Northport, NY 11731
|
- sq. feet
|
2 baths 4 beds |
$624,000
|
show details |

|
#16
Kirby Ln
Central Islip, NY 11722
|
- sq. feet
|
1 baths 3 beds |
$395,200
|
show details |

|
#17
Hayfield Ct
Commack, NY 11725
|
- sq. feet
|
1 baths 3 beds |
$603,250
|
show details |

|
#18
Brentwood Pkwy
Brentwood, NY 11717
|
- sq. feet
|
4 baths 5 beds |
$468,000
|
show details |

|
#19
Superior St
Port Jefferson Station, NY 11776
|
- sq. feet
|
1 baths 3 beds |
$265,200
|
show details |

|
#20
Pearl St
Bohemia, NY 11716
|
- sq. feet
|
2 baths 4 beds |
$475,000
|
show details |
| Photo | Address | Area | Beds / Baths | Price | Details |
|---|---|---|---|---|---|

|
#21
River Rd
Shirley, NY 11967
|
2,166 sq. feet
|
2 baths 3 beds |
show details | |

|
#22
Dourland Rd
Medford, NY 11763
|
960 sq. feet
|
1 baths 3 beds |
show details | |

|
#23
Debra Dr
Nesconset, NY 11767
|
1,824 sq. feet
|
2 baths 4 beds |
show details | |

|
#24
Brian St
Holbrook, NY 11741
|
1,456 sq. feet
|
3 baths 4 beds |
show details | |

|
#25
Turnpike Blvd
Middle Island, NY 11953
|
2,211 sq. feet
|
2 baths 4 beds |
show details | |

|
#26
Central Woods Ln
Brookhaven, NY 11719
|
1,262 sq. feet
|
1 baths 3 beds |
show details | |

|
#27
Browns Rd
Nesconset, NY 11767
|
1,848 sq. feet
|
3 baths 4 beds |
show details | |

|
#28
Astor Ave
Saint James, NY 11780
|
1,200 sq. feet
|
2 baths 3 beds |
show details | |

|
#29
Wendy Dr
Holtsville, NY 11742
|
1,348 sq. feet
|
1 baths 3 beds |
show details | |

|
#30
Park Ln
Medford, NY 11763
|
1,104 sq. feet
|
1 baths 3 beds |
show details |
| Photo | Address | Area | Beds / Baths | Price | Details |
|---|---|---|---|---|---|

|
#31
Bloomington St
Medford, NY 11763
|
3,298 sq. feet
|
3 baths 4 beds |
show details | |

|
#32
Cody Pl
Lake Grove, NY 11755
|
2,318 sq. feet
|
3 baths 4 beds |
show details | |

|
#33
Laurel Rd
Ronkonkoma, NY 11779
|
1,292 sq. feet
|
2 baths 4 beds |
show details | |

|
#34
Auborn Ave
Shirley, NY 11967
|
1,160 sq. feet
|
2 baths 4 beds |
show details | |

|
#35
Kirby Ln
Ronkonkoma, NY 11779
|
1,558 sq. feet
|
2 baths 4 beds |
show details | |

|
#36
Fulton St
Lake Grove, NY 11755
|
1,670 sq. feet
|
1 baths 3 beds |
show details | |

|
#37
Mannes St
Ronkonkoma, NY 11779
|
1,430 sq. feet
|
2 baths 3 beds |
show details | |

|
#38
Lakeside Dr
Farmingville, NY 11738
|
2,064 sq. feet
|
3 baths 5 beds |
show details | |

|
#39
Chestnut Ave
Medford, NY 11763
|
1,467 sq. feet
|
1 baths 3 beds |
show details | |

|
#40
Lakeside Dr
Ronkonkoma, NY 11779
|
2,648 sq. feet
|
1 baths 4 beds |
show details |
| Photo | Address | Area | Beds / Baths | Price | Details |
|---|---|---|---|---|---|

|
#41
Beach Plum Ln
Saint James, NY 11780
|
3,232 sq. feet
|
4 baths 5 beds |
show details | |

|
#42
Fairview Cir
Middle Island, NY 11953
|
947 sq. feet
|
2 baths 2 beds |
show details | |

|
#43
Artist Lake Blvd
Middle Island, NY 11953
|
1,942 sq. feet
|
1 baths 3 beds |
show details | |

|
#44
Annandale Rd
Commack, NY 11725
|
3,120 sq. feet
|
3 baths 5 beds |
show details | |

|
#45
Beech St
Lake Grove, NY 11755
|
2,208 sq. feet
|
2 baths 3 beds |
show details | |

|
#46
Dellmarie Ln
Nesconset, NY 11767
|
1,185 sq. feet
|
2 baths 3 beds |
show details | |

|
#47
Artist Lake Dr
Middle Island, NY 11953
|
947 sq. feet
|
1 baths 1 beds |
show details | |

|
#48
Blossom Ave
Holtsville, NY 11742
|
3,125 sq. feet
|
3 baths 4 beds |
show details | |

|
#49
Blossom Ave
Holtsville, NY 11742
|
1,126 sq. feet
|
1 baths 3 beds |
show details | |

|
Check over 1 million property listings on Foreclosure.com!
|
browse all offers | |||

Latest news about housing in Terryville, NY collected exclusively by city-data.com from local newspapers, TV, and radio stations

 | Best Christmas Light Houses? (9 replies) |
| Mushroom houses/critter section/E. Setauket (26 replies) |
| Stonington Condos in Port Jeff Station (31 replies) |
| Is Port Jeff Station becoming comparable to Brentwod and CI?? (282 replies) |
| Making offers on a house in this economy....... (41 replies) |
| Terryville (Comsewogue) Area (21 replies) |

Median year apartment built: 1994
Household type by relationship:
Households: 10,896- Male householders: 1,811 (202 living alone), Female householders: 2,011 (777 living alone)
2,195 spouses (2,162 opposite-sex spouses), 160 unmarried partners, (160 opposite-sex unmarried partners), 3,605 children (3,509 natural, 0 adopted, 96 stepchildren), 178 grandchildren, 246 brothers or sisters, 401 parents, 0 foster children, 104 other relatives, 111 non-relatives
- In group quarters: 73
Size of family households: 904 2-persons, 502 3-persons, 874 4-persons, 291 5-persons, 70 6-persons.
Size of nonfamily households: 987 1-person, 192 2-persons.
1,826 married couples with children.
323 single-parent households (0 men, 323 women).
83.0% of residents of Terryville speak English at home.
8.8% of residents speak Spanish at home (53% speak English very well, 28% speak English well, 10% speak English not well, 9% don't speak English at all).
4.5% of residents speak other Indo-European language at home (51% speak English very well, 8% speak English well, 19% speak English not well, 22% don't speak English at all).
2.7% of residents speak Asian or Pacific Island language at home (30% speak English very well, 17% speak English well, 40% speak English not well, 13% don't speak English at all).
Foreign born population: 1,380 (12.7%)
(52.8% of them are naturalized citizens)
| Here: | 7.1 |
| State: | 6.3 |
| Here: | 3.9 |
| State: | 3.8 |

- Bedrooms in owner-occupied houses and condos in Terryville, New York
- 0no bedroom
- 271 bedroom
- 1562 bedrooms
- 1,4193 bedrooms
- 1,1594 bedrooms
- 1635+ bedrooms

- Bedrooms in renter-occupied apartments in Terryville, New York
- 17no bedroom
- 4021 bedroom
- 2792 bedrooms
- 1573 bedrooms
- 504 bedrooms
- 05+ bedrooms

- Cars and other vehicles available in Terryville in owner-occupied houses/condos
- 26no vehicle
- 5021 vehicle
- 1,3372 vehicles
- 8413 vehicles
- 1804 vehicles
- 375+ vehicles

- Cars and other vehicles available in Terryville in renter-occupied apartments
- 198no vehicle
- 5201 vehicle
- 1262 vehicles
- 233 vehicles
- 374 vehicles
- 05+ vehicles

- Rooms in owner-occupied houses in Terryville, New York
- 01 room
- 02 rooms
- 423 rooms
- 1294 rooms
- 1335 rooms
- 5576 rooms
- 8407 rooms
- 5198 rooms
- 7039+ rooms

- Rooms in renter-occupied apartments in Terryville, New York
- 171 room
- 592 rooms
- 2743 rooms
- 2954 rooms
- 545 rooms
- 1086 rooms
- 637 rooms
- 218 rooms
- 149+ rooms


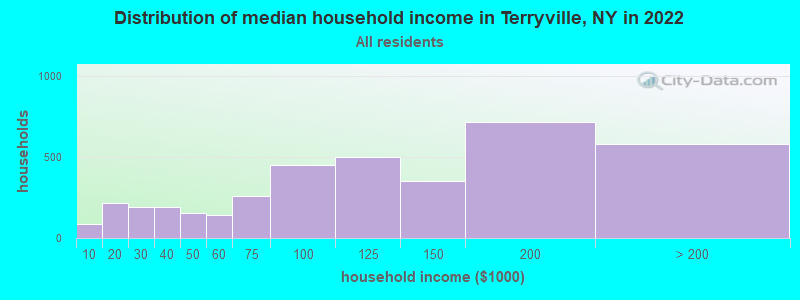
Terryville, NY household income distribution

- 87Less than $10,000
- 214$10,000 to $19,999
- 192$20,000 to $29,999
- 191$30,000 to $39,999
- 153$40,000 to $49,999
- 142$50,000 to $59,999
- 258$60,000 to $74,999
- 453$75,000 to $99,999
- 501$100,000 to $124,999
- 353$125,000 to $149,999
- 716$150,000 to $199,999
- 582$200,000 or more
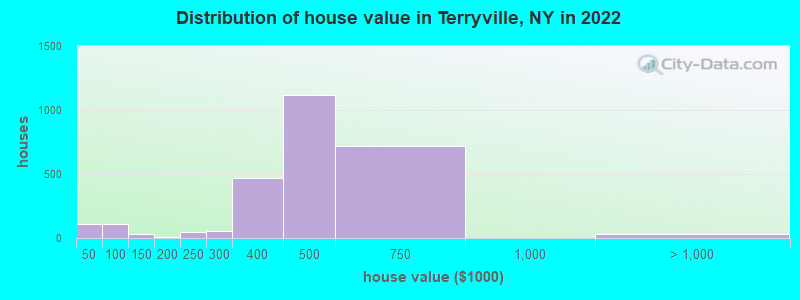
Home value of owner - occupied houses in 2022 in Terryville, NY
-
- 61Less than $10,000
- 11$15,000 to $19,999
- 12$35,000 to $39,999
- 24$40,000 to $49,999
- 28$50,000 to $59,999
- 59$80,000 to $89,999
- 28$125,000 to $149,999
- 4$175,000 to $199,999
- 48$200,000 to $249,999
- 50$250,000 to $299,999
- 468$300,000 to $399,999
- 1,118$400,000 to $499,999
- 721$500,000 to $749,999
- 14$1,500,000 to $1,999,999
- 16$2,000,000 or more
Rent paid by renters in 2022 in Terryville, NY
-
- 28$100 to $149
- 135$500 to $549
- 4$650 to $699
- 31$750 to $799
- 84$1,000 to $1,249
- 16$1,250 to $1,499
- 214$1,500 to $1,999
- 49$2,000 to $2,499
- 110$2,500 to $2,999
- 125$3,000 to $3,499
- 16$3,500 or more
- 113No cash rent


Percentage of workers working in this county: 89.0%
Number of people working at home: 298 (5.6% of all workers)
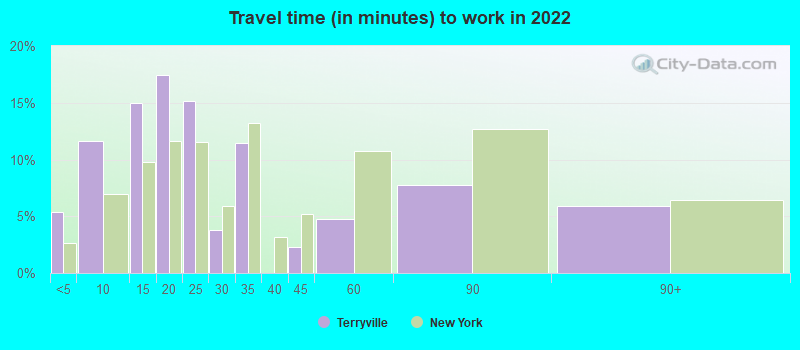
Travel time to work (commute)
- Less than 5 minutes: 298
- 5 to 9 minutes: 736
- 10 to 14 minutes: 479
- 15 to 19 minutes: 465
- 20 to 24 minutes: 583
- 25 to 29 minutes: 175
- 30 to 34 minutes: 647
- 35 to 39 minutes: 60
- 40 to 44 minutes: 200
- 45 to 59 minutes: 327
- 60 to 89 minutes: 699
- 90 or more minutes: 306
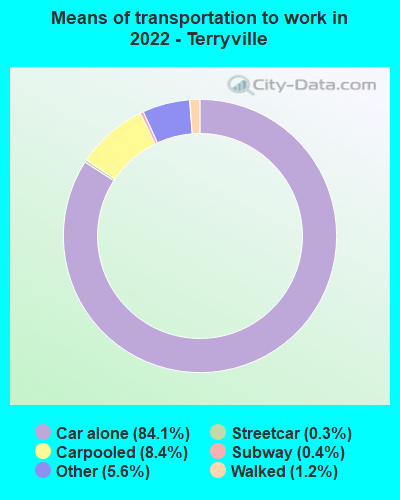
Means of transportation to work:
- Drove a car alone: 1,809 (72.3%)
- Carpooled: 208 (8.3%)
- Subway or elevated rail: 7 (0.3%)
- Long-distance train or commuter rail: 8 (0.3%)
- Taxi: 150 (6.0%)
- Walked: 28 (1.1%)
- Worked at home: 298 (11.9%)

- Unemployment by race in 2022
- Unemployment rate for White non-Hispanic residents
- 3.6%Males
- 6.3%Females
- Unemployment rate for Black residents
- 25.0%Females
- Unemployment rate for two or more race residents
- 3.2%Males
- Unemployment rate for Hispanic or Latino residents
- 0.4%Males

- Year of entry for the foreign-born population in Terryville, New York
- 3622010 or later
- 4222000 to 2009
- 2371990 to 1999
- 2051980 to 1989
- 2351970 to 1979
- 367Before 1970
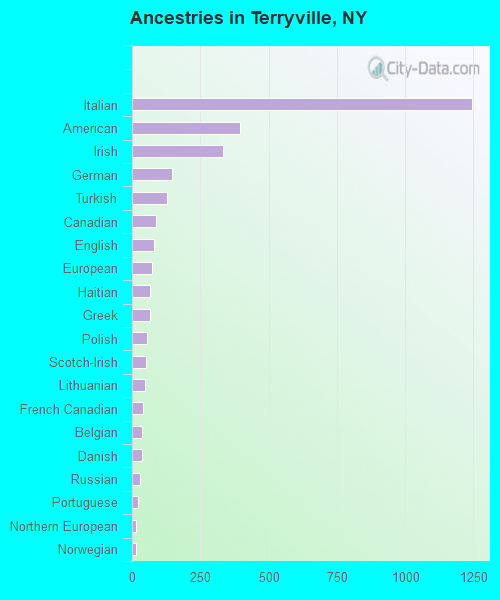
First ancestries reported:
- Italian: 1,245 (24.9%)
- American: 397 (7.9%)
- Irish: 334 (6.7%)
- German: 148 (3.0%)
- Turkish: 129 (2.6%)
- Canadian: 87 (1.7%)
- English: 81 (1.6%)
- European: 73 (1.5%)
- Haitian: 67 (1.3%)
- Greek: 66 (1.3%)
- Polish: 54 (1.1%)
- Scotch-Irish: 51 (1.0%)
- Lithuanian: 46 (0.9%)
- French Canadian: 42 (0.8%)
- Belgian: 36 (0.7%)
- Danish: 36 (0.7%)
- Russian: 31 (0.6%)
- Portuguese: 21 (0.4%)
- Northern European: 16 (0.3%)
- Norwegian: 14 (0.3%)
- Welsh: 11 (0.2%)
- African: 8 (0.2%)
- British: 7 (0.1%)
Most common places of birth for foreign-born residents (%):
| Terryville: | 35.7% (454) |
| New York: | 11.1% (501,040) |
| Terryville: | 12.3% (156) |
| New York: | 1.3% (59,107) |
| Terryville: | 10.5% (134) |
| New York: | 1.8% (81,374) |
| Terryville: | 7.5% (95) |
| New York: | 3.5% (158,432) |
| Terryville: | 5.8% (74) |
| New York: | 9.1% (410,910) |
| Terryville: | 3.6% (46) |
| New York: | 0.3% (12,762) |
| Terryville: | 3.5% (44) |
| New York: | 0.6% (28,604) |
| Terryville: | 3.5% (44) |
| New York: | 3.9% (177,448) |
| Terryville: | 2.1% (27) |
| New York: | 0.2% (10,519) |
| Terryville: | 2.0% (25) |
| New York: | 2.8% (126,936) |
| Terryville: | 1.6% (21) |
| New York: | 0.4% (19,652) |
Place of birth for U.S.-born residents:
- This state: 8,466
- Other state: 746
- Northeast: 168
- Midwest: 184
- South: 150
- West: 292
97.1% of Terryville residents lived in the same house 1 years ago.
Out of people who lived in different houses, 31.1% lived in this county.
Out of people who lived in different counties, 65.4% lived in New York.
| Terryville: | 97.1% |
| State average: | 89.6% |
Education attainment for males 25 years and older:
- No schooling: 26
- Nursery to 4th grade: 0
- 5th and 6th grade: 119
- 7th and 8th grade: 0
- 9th grade: 14
- 10th grade: 58
- 11th grade: 30
- 12th grade, no diploma: 171
- High school graduate (or equivalency): 950
- Less than 1 year of college: 271
- Some college more than 1 year, no degree: 538
- Associate degree: 177
- Bachelor's degree: 744
- Master's degree: 181
- Professional school degree: 80
- Doctorate degree: 80

Education attainment for females 25 years and older:
- No schooling: 40
- Nursery to 4th grade: 0
- 5th and 6th grade: 22
- 7th and 8th grade: 0
- 9th grade: 11
- 10th grade: 47
- 11th grade: 36
- 12th grade, no diploma: 298
- High school graduate (or equivalency): 1,187
- Less than 1 year of college: 336
- Some college more than 1 year, no degree: 268
- Associate degree: 347
- Bachelor's degree: 815
- Master's degree: 391
- Professional school degree: 134
- Doctorate degree: 32


Housing units in structures:
- One, detached: 3,272
- One, attached: 241
- Two: 161
- 3 or 4: 75
- 5 to 9: 191
- 10 to 19: 36
- 50 or more: 50
- Mobile homes: 18
Housing units lacking complete kitchen facilities in 2022: 2.1%
House/condo owner moved in on average 16 years ago
Renter moved in on average 11 years ago

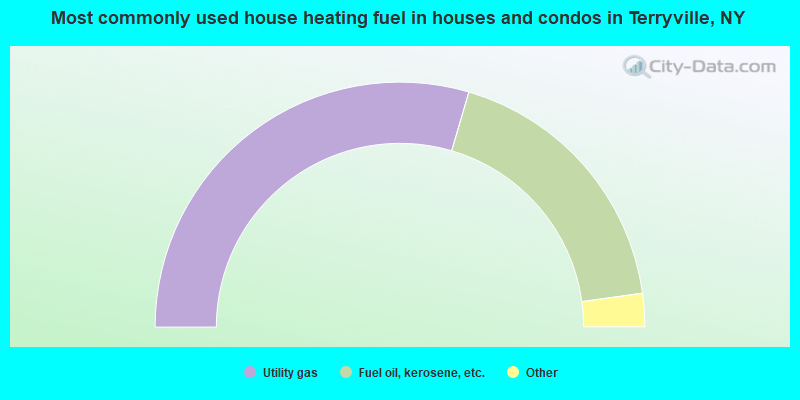
- 59.1%Utility gas
- 36.5%Fuel oil, kerosene, etc.
- 3.5%Bottled, tank, or LP gas
- 0.6%Wood
- 0.3%Electricity
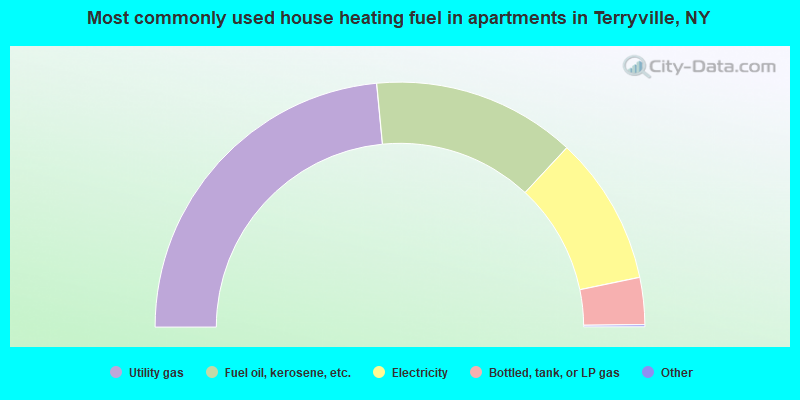
- 47.1%Utility gas
- 27.0%Fuel oil, kerosene, etc.
- 19.7%Electricity
- 6.2%Bottled, tank, or LP gas
Private vs. public school enrollment:
| Here: | 0.2% |
| New York: | 15.6% |
| Here: | 0.0% |
| New York: | 15.0% |
| Here: | 30.5% |
| New York: | 39.2% |


