Housing density: 205 houses/condos per square mile
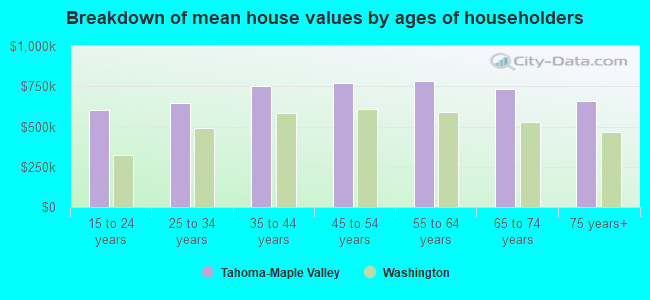
Median price asked for vacant for-sale houses and condos in 2022 in this county: $843,880.
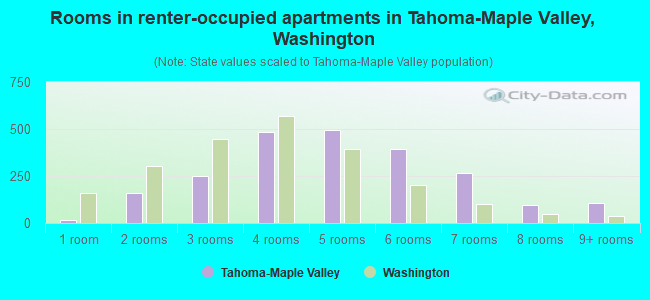
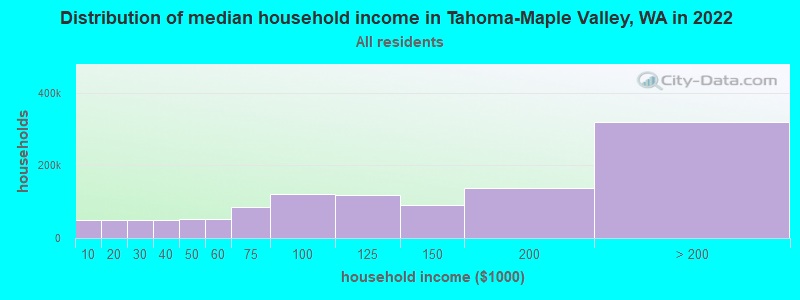
Median contract rent in 2022: $1,911 (lower quartile is $1,494, upper quartile is over $2,000)
Median rent asked for vacant for-rent units in 2022: $1,803
Median gross rent in Tahoma-Maple Valley, WA in 2022: over $2,000
Housing units in Tahoma-Maple Valley with a mortgage: 11,901 (1,613 second mortgage, 1,345 home equity loan, 66 both second mortgage and home equity loan) Houses without a mortgage: 1,985
Compare current foreclosures near Tahoma-Maple Valley, WA:
In family households: 1,455,162 (324,509 male householders, 137,001 female householders)
357,491 spouses, 491,900 children (462,739 natural, 12,743 adopted, 16,418 stepchildren), 22,208 grandchildren, 21,116 brothers or sisters, 17,956 parents, foster children, 25,527 other relatives, 45,636 non-relatives
In nonfamily households: 438,956 (162,683 male householders (115,616 living alone)), 165,039 female householders (129,083 living alone)), 111,234 nonrelatives
In group quarters: 37,131 (10,490 institutionalized population)
277,933 married couples with children.
81,653 single-parent households (19,170 men, 62,483 women).
92.9% of residents of Tahoma-Maple Valley speak English at home.
1.9% of residents speak Spanish at home (69% speak English very well, 22% speak English well, 7% speak English not well, 2% don't speak English at all).
3.1% of residents speak other Indo-European language at home (67% speak English very well, 21% speak English well, 10% speak English not well, 2% don't speak English at all).
1.7% of residents speak Asian or Pacific Island language at home (50% speak English very well, 36% speak English well, 13% speak English not well, 2% don't speak English at all).
0.4% of residents speak other language at home (61% speak English very well, 29% speak English well, 10% speak English not well).
Foreign born population: 6,375 (9.3%)
(68.5% of them are naturalized citizens)
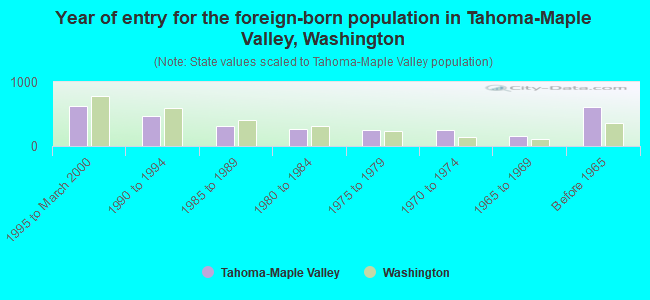
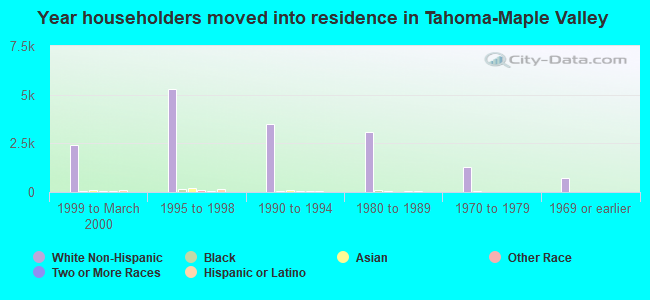
Year of entry for the foreign-born population in Tahoma-Maple Valley, Washington
6221995 to March 2000
4741990 to 1994
3151985 to 1989
2711980 to 1984
2511975 to 1979
2441970 to 1974
1541965 to 1969
617Before 1965
Most common places of birth for foreign-born residents (%):
Canada
Tahoma-Maple Valley:
13.1% (386)
Washington:
7.7% (47,568)
United Kingdom
Tahoma-Maple Valley:
7.2% (211)
Washington:
3.3% (20,321)
Mexico
Tahoma-Maple Valley:
7.1% (209)
Washington:
24.1% (148,115)
Korea
Tahoma-Maple Valley:
6.8% (199)
Washington:
6.2% (38,172)
Philippines
Tahoma-Maple Valley:
6.5% (192)
Washington:
7.6% (46,733)
Germany
Tahoma-Maple Valley:
5.3% (155)
Washington:
3.4% (21,167)
Russia
Tahoma-Maple Valley:
4.2% (123)
Washington:
2.5% (15,491)
Ukraine
Tahoma-Maple Valley:
3.7% (109)
Washington:
3.0% (18,572)
Japan
Tahoma-Maple Valley:
3.3% (97)
Washington:
2.8% (16,936)
Vietnam
Tahoma-Maple Valley:
3.3% (96)
Washington:
6.7% (40,879)
Poland
Tahoma-Maple Valley:
3.2% (94)
Washington:
0.7% (4,092)
China, excluding Hong Kong and Taiwan
Tahoma-Maple Valley:
2.6% (78)
Washington:
3.3% (20,530)
Taiwan
Tahoma-Maple Valley:
2.5% (75)
Washington:
1.4% (8,353)
Indonesia
Tahoma-Maple Valley:
2.4% (72)
Washington:
0.4% (2,467)
Other Eastern Africa
Tahoma-Maple Valley:
2.1% (61)
Washington:
1.0% (6,438)
India
Tahoma-Maple Valley:
2.0% (58)
Washington:
2.4% (14,714)
Hungary
Tahoma-Maple Valley:
1.8% (54)
Washington:
0.2% (1,367)
Bosnia and Herzegovina
Tahoma-Maple Valley:
1.8% (54)
Washington:
0.4% (2,755)
Czechoslovakia (includes Czech Republic and Slovakia)
Tahoma-Maple Valley:
1.8% (52)
Washington:
0.3% (2,041)
Other Northern Europe
Tahoma-Maple Valley:
1.7% (51)
Washington:
1.0% (6,393)
Place of birth for U.S.-born residents:
This state: 27,407
Other state: 21,725
Northeast: 2,023
Midwest: 6,032
South: 3,120
West: 10,550
57% of Tahoma-Maple Valley residents lived in the same house 5 years ago. Out of people who lived in different houses, 71% lived in this county. Out of people who lived in different counties, 31% lived in Washington.
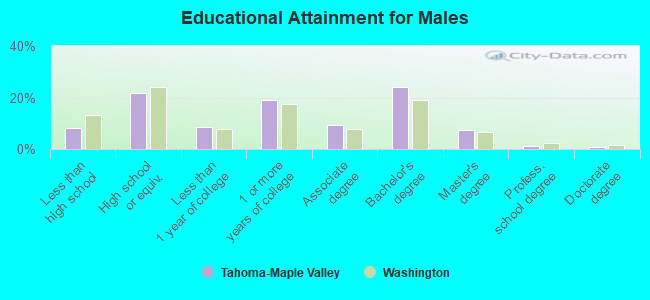
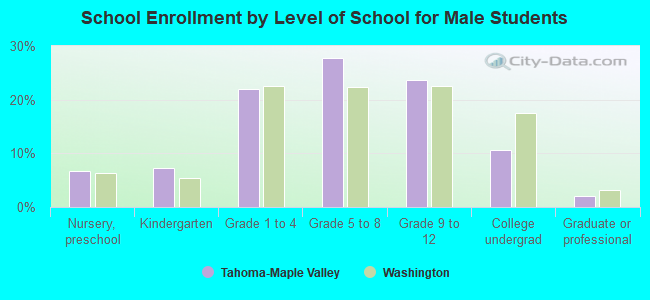
Education attainment for males 25 years and older:
No schooling: 35
Nursery to 4th grade: 33
5th and 6th grade: 30
7th and 8th grade: 148
9th grade: 78
10th grade: 316
11th grade: 241
12th grade, no diploma: 440
High school graduate (or equivalency): 3,574
Less than 1 year of college: 1,426
Some college more than 1 year, no degree: 3,122
Associate degree: 1,506
Bachelor's degree: 3,953
Master's degree: 1,201
Professional school degree: 186
Doctorate degree: 121
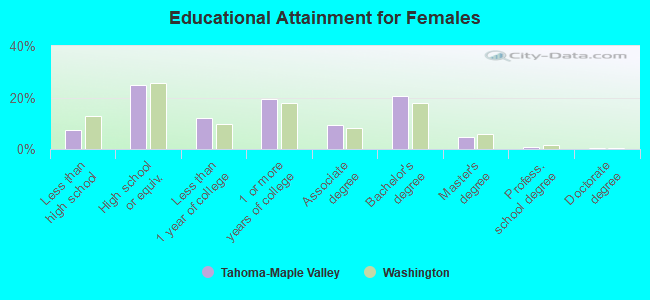
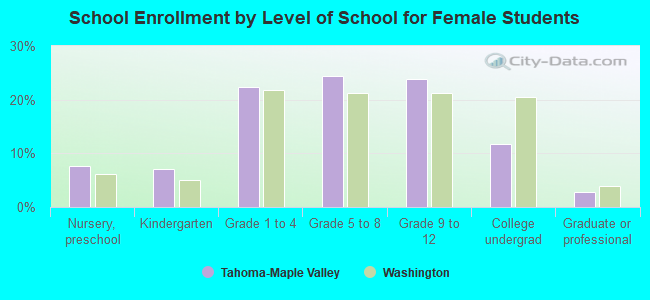
Education attainment for females 25 years and older:
No schooling: 91
Nursery to 4th grade: 49
5th and 6th grade: 24
7th and 8th grade: 162
9th grade: 94
10th grade: 200
11th grade: 292
12th grade, no diploma: 339
High school graduate (or equivalency): 4,212
Less than 1 year of college: 2,036
Some college more than 1 year, no degree: 3,276
Associate degree: 1,597
Bachelor's degree: 3,456
Master's degree: 788
Professional school degree: 162
Doctorate degree: 71
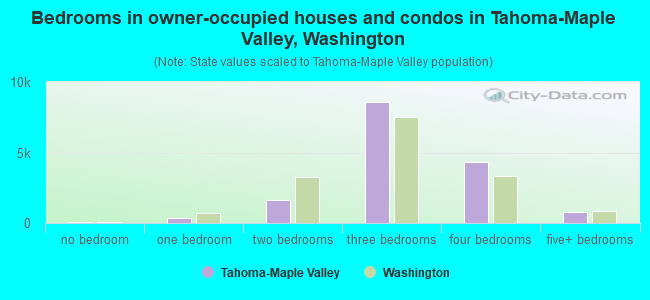
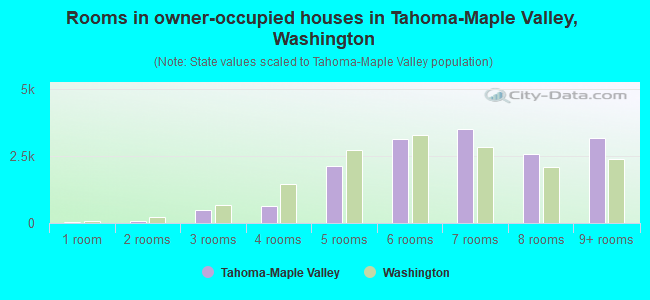
Housing units in structures:
One, detached: 15,649
One, attached: 537
Two: 65
3 or 4: 154
5 to 9: 306
10 to 19: 307
20 to 49: 75
50 or more: 155
Mobile homes: 1,136
Boats, RVs, vans, etc.: 42
Median worth of mobile homes: $190,775
Housing units lacking complete plumbing facilities: 0.4%
Housing units lacking complete kitchen facilities: 0.4%