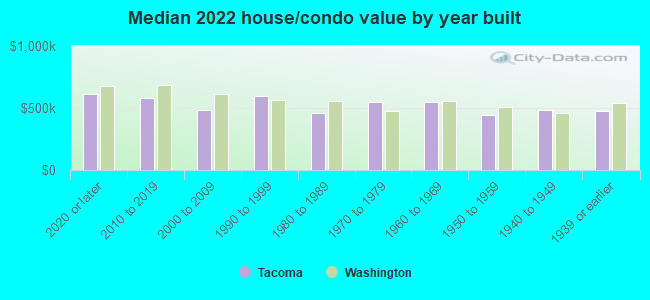
Tacoma, WA (Washington) Houses and Residents
| Tacoma: | $492,800 |
| Washington: | $569,500 |
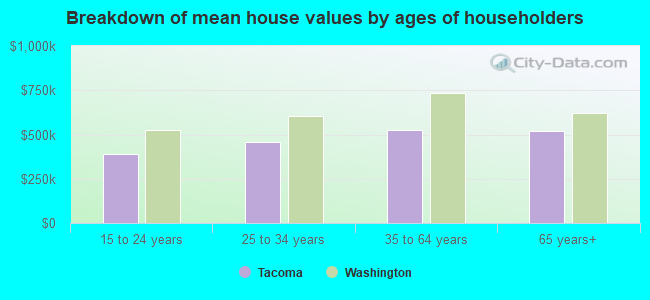
Mean price in 2022:
Detached houses: $539,563
Here: $539,563 State: $734,307 Townhouses or other attached units: $464,187
Here: $464,187 State: $657,697 In 2-unit structures: $365,361
Here: $365,361 State: $534,634 In 3-to-4-unit structures: $539,874
Here: $539,874 State: $510,239 In 5-or-more-unit structures: $615,661
Here: $615,661 State: $503,183 Mobile homes: $199,021
Here: $199,021 State: $218,362 Occupied boats, RVs, vans, etc.: $166,575
Here: $166,575 State: $159,523
Total population: 205,159 (Urban population: 193,050, Rural population: 127 (all nonfarm))
Houses: 97,934 (91,951 occupied: 51,688 owner occupied, 40,263 renter occupied)
| % of renters here: | 44% |
| State: | 36% |
Housing density: 1,956 houses/condos per square mile
Median price asked for vacant for-sale houses and condos in 2022: $492,358.
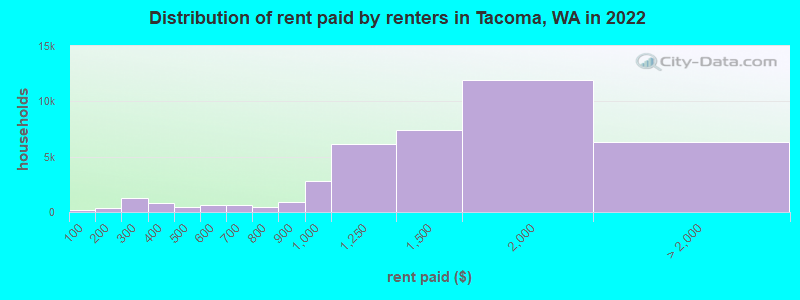
Median contract rent in 2022: $1,426 (lower quartile is $1,059, upper quartile is $1,823)
Median rent asked for vacant for-rent units in 2022: $1,841
Median gross rent in Tacoma, WA in 2022: $1,575
Housing units in Tacoma with a mortgage: 37,404 (3,535 second mortgage, 198 home equity loan, 2,502 both second mortgage and home equity loan)
Houses without a mortgage: 1,051
Median household income for houses/condos with a mortgage: $122,337
Median household income for apartments without a mortgage: $75,649
Median monthly housing costs: $1,655
Compare current foreclosures in Tacoma, WA:
| Photo | Address | Area | Beds / Baths | Price | Details |
|---|---|---|---|---|---|

|
#1
N 31st St Apt 401
Tacoma, WA 98403
|
2,110 sq. feet
|
2 baths 2 beds |
show details | |

|
#2
155th St E
Tacoma, WA 98445
|
2,376 sq. feet
|
1 baths 3 beds |
show details | |

|
#3
63rd Ave NE
Tacoma, WA 98422
|
1,904 sq. feet
|
2 baths 2 beds |
show details | |

|
#4
Yakima Ave S
Tacoma, WA 98444
|
1,153 sq. feet
|
1 baths 3 beds |
show details | |

|
#5
E 64th St
Tacoma, WA 98404
|
3,092 sq. feet
|
4 baths 8 beds |
show details | |

|
#6
E 64th St
Tacoma, WA 98404
|
3,092 sq. feet
|
4 baths 8 beds |
show details | |

|
#7
E 82nd St
Tacoma, WA 98404
|
836 sq. feet
|
1 baths 2 beds |
show details | |

|
#8
Violet Meadow St S
Tacoma, WA 98444
|
804 sq. feet
|
1 baths 2 beds |
show details | |

|
#9
184th St E
Tacoma, WA 98445
|
2,344 sq. feet
|
2 baths 4 beds |
show details | |

|
#10
136th St E
Tacoma, WA 98445
|
1,312 sq. feet
|
2 baths 3 beds |
show details |
| Photo | Address | Area | Beds / Baths | Price | Details |
|---|---|---|---|---|---|

|
#11
S 91st St
Tacoma, WA 98444
|
1,152 sq. feet
|
1 baths 3 beds |
show details | |

|
#12
E 59th St
Tacoma, WA 98404
|
1,016 sq. feet
|
1 baths 3 beds |
show details | |

|
#13
S 7th St
Tacoma, WA 98405
|
1,092 sq. feet
|
1 baths 2 beds |
show details | |

|
#14
Cypress Point Ave
Tacoma, WA 98466
|
3,056 sq. feet
|
3 baths 4 beds |
show details | |

|
#15
Viewmont St
Tacoma, WA 98407
|
1,488 sq. feet
|
1 baths 3 beds |
show details | |

|
#16
S Thompson Ave
Tacoma, WA 98418
|
1,396 sq. feet
|
1 baths 3 beds |
show details | |

|
#17
S Lawrence St
Tacoma, WA 98409
|
660 sq. feet
|
1 baths 2 beds |
show details | |

|
#18
Cliff Side Dr NE
Tacoma, WA 98422
|
1,955 sq. feet
|
2 baths 3 beds |
show details | |

|
#19
S M St
Tacoma, WA 98408
|
1,040 sq. feet
|
2 baths 2 beds |
show details | |

|
#20
S Howard St
Tacoma, WA 98465
|
1,082 sq. feet
|
1 baths 2 beds |
show details |
| Photo | Address | Area | Beds / Baths | Price | Details |
|---|---|---|---|---|---|

|
#21
52nd St E
Tacoma, WA 98443
|
1,186 sq. feet
|
1 baths 3 beds |
show details | |

|
#22
S Alaska St
Tacoma, WA 98408
|
1,987 sq. feet
|
1 baths 2 beds |
show details | |

|
#23
Paradise Pkwy
Tacoma, WA 98466
|
1,692 sq. feet
|
1 baths 3 beds |
show details | |

|
#24
E 63rd St
Tacoma, WA 98404
|
1,360 sq. feet
|
1 baths 3 beds |
show details | |

|
#25
Fawcett Ave
Tacoma, WA 98408
|
1,616 sq. feet
|
2 baths 3 beds |
show details | |

|
#26
E D St
Tacoma, WA 98404
|
1,618 sq. feet
|
2 baths 4 beds |
show details | |

|
#27
27th St W Apt 9b
Tacoma, WA 98466
|
1,500 sq. feet
|
2 baths 3 beds |
show details | |

|
#28
S 43rd St
Tacoma, WA 98418
|
1,800 sq. feet
|
1 baths 4 beds |
show details | |

|
#29
E 56th St
Tacoma, WA 98404
|
805 sq. feet
|
1 baths 2 beds |
show details | |

|
#30
S Trafton St
Tacoma, WA 98405
|
1,160 sq. feet
|
2 baths 3 beds |
show details |
| Photo | Address | Area | Beds / Baths | Price | Details |
|---|---|---|---|---|---|

|
#31
S 74th St
Tacoma, WA 98408
|
1,248 sq. feet
|
1 baths 3 beds |
show details | |

|
#32
S D St
Tacoma, WA 98444
|
1,373 sq. feet
|
2 baths 3 beds |
show details | |

|
#33
S Junett St
Tacoma, WA 98409
|
1,416 sq. feet
|
1 baths 2 beds |
show details | |

|
#34
42nd Ave E
Tacoma, WA 98446
|
1,772 sq. feet
|
2 baths 3 beds |
show details | |

|
#35
S 86th St
Tacoma, WA 98444
|
1,510 sq. feet
|
1 baths 4 beds |
show details | |

|
#36
S Ridgewood Ave
Tacoma, WA 98405
|
1,277 sq. feet
|
1 baths 3 beds |
show details | |

|
#37
N Highland St
Tacoma, WA 98407
|
1,028 sq. feet
|
1 baths 4 beds |
show details | |

|
#38
E G St
Tacoma, WA 98404
|
1,038 sq. feet
|
1 baths 2 beds |
show details | |

|
#39
1st Street Ct E
Tacoma, WA 98424
|
2,488 sq. feet
|
2 baths 4 beds |
show details | |

|
#40
Alaska St S
Tacoma, WA 98444
|
1,050 sq. feet
|
3 baths 4 beds |
show details |
| Photo | Address | Area | Beds / Baths | Price | Details |
|---|---|---|---|---|---|

|
#41
N Visscher St
Tacoma, WA 98407
|
1,062 sq. feet
|
2 baths 3 beds |
show details | |

|
#42
S 12th St
Tacoma, WA 98405
|
1,257 sq. feet
|
1 baths 3 beds |
show details | |

|
#43
E Division Ln
Tacoma, WA 98404
|
1,604 sq. feet
|
2 baths 3 beds |
show details | |

|
#44
S 45th St
Tacoma, WA 98409
|
1,222 sq. feet
|
2 baths 2 beds |
show details | |

|
#45
9th Ave E
Tacoma, WA 98445
|
1,264 sq. feet
|
2 baths 2 beds |
show details | |

|
#46
E 66th St
Tacoma, WA 98404
|
1,584 sq. feet
|
1 baths 4 beds |
show details | |

|
#47
S Cheyenne St
Tacoma, WA 98409
|
768 sq. feet
|
1 baths 1 beds |
show details | |

|
#48
1st Street Ct E
Tacoma, WA 98424
|
2,488 sq. feet
|
2 baths 4 beds |
show details | |

|
#49
148th St E
Tacoma, WA 98446
|
1,296 sq. feet
|
1 baths 3 beds |
show details | |

|
Check over 1 million property listings on Foreclosure.com!
|
browse all offers | |||

Latest news about housing in Tacoma, WA collected exclusively by city-data.com from local newspapers, TV, and radio stations


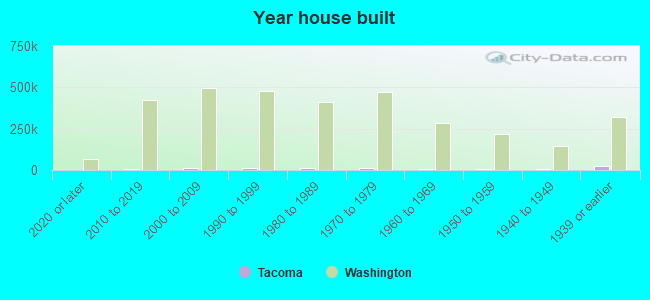
Median year apartment built: 1976
Household type by relationship:
Households: 221,790- Male householders: 45,297 (12,001 living alone), Female householders: 46,654 (16,256 living alone)
37,390 spouses (36,236 opposite-sex spouses), 10,230 unmarried partners, (9,650 opposite-sex unmarried partners), 50,877 children (47,179 natural, 1,163 adopted, 2,535 stepchildren), 3,387 grandchildren, 2,450 brothers or sisters, 2,457 parents, 641 foster children, 3,802 other relatives, 12,920 non-relatives
- In group quarters: 5,685
Size of family households: 25,656 2-persons, 12,385 3-persons, 9,327 4-persons, 3,213 5-persons, 1,847 6-persons, 1,254 7-or-more-persons.
Size of nonfamily households: 28,257 1-person, 8,375 2-persons, 898 3-persons, 370 4-persons, 369 7-or-more-persons.
25,522 married couples with children.
12,598 single-parent households (4,696 men, 7,902 women).
83.4% of residents of Tacoma speak English at home.
5.5% of residents speak Spanish at home (69% speak English very well, 23% speak English well, 7% speak English not well, 1% don't speak English at all).
3.3% of residents speak other Indo-European language at home (66% speak English very well, 13% speak English well, 17% speak English not well, 4% don't speak English at all).
6.7% of residents speak Asian or Pacific Island language at home (52% speak English very well, 20% speak English well, 26% speak English not well, 2% don't speak English at all).
1.0% of residents speak other language at home (53% speak English very well, 37% speak English well, 9% speak English not well, 1% don't speak English at all).
Foreign born population: 26,630 (12.0%)
(59.6% of them are naturalized citizens)
| Here: | 6.2 |
| State: | 6.5 |
| Here: | 3.8 |
| State: | 3.9 |
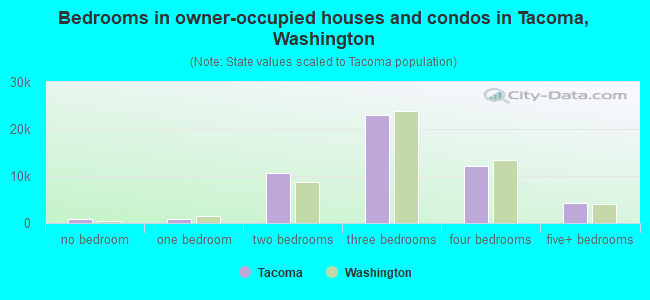
- Bedrooms in owner-occupied houses and condos in Tacoma, Washington
- 921no bedroom
- 8921 bedroom
- 10,5972 bedrooms
- 22,9003 bedrooms
- 12,1954 bedrooms
- 4,1835+ bedrooms
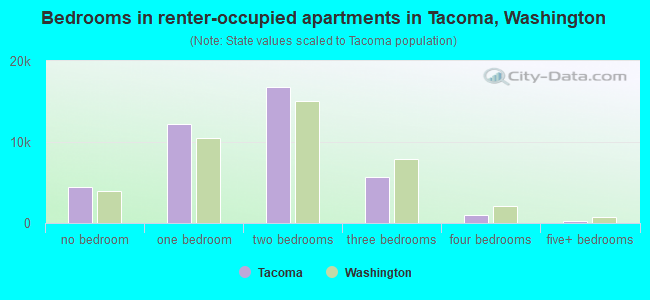
- Bedrooms in renter-occupied apartments in Tacoma, Washington
- 4,426no bedroom
- 12,2481 bedroom
- 16,7902 bedrooms
- 5,6403 bedrooms
- 9544 bedrooms
- 2055+ bedrooms
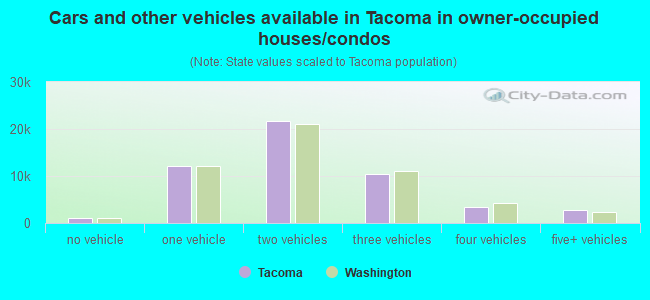
- Cars and other vehicles available in Tacoma in owner-occupied houses/condos
- 1,119no vehicle
- 12,1961 vehicle
- 21,7742 vehicles
- 10,4243 vehicles
- 3,4074 vehicles
- 2,7685+ vehicles
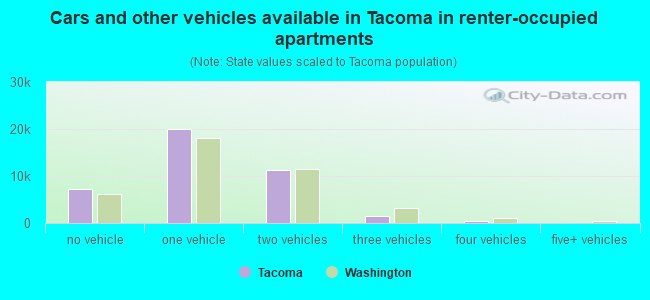
- Cars and other vehicles available in Tacoma in renter-occupied apartments
- 7,196no vehicle
- 20,0511 vehicle
- 11,1812 vehicles
- 1,4803 vehicles
- 3554 vehicles
- 05+ vehicles

- Rooms in owner-occupied houses in Tacoma, Washington
- 7021 room
- 1772 rooms
- 1,3223 rooms
- 6,0594 rooms
- 8,2935 rooms
- 12,7996 rooms
- 8,4697 rooms
- 5,6318 rooms
- 8,2369+ rooms
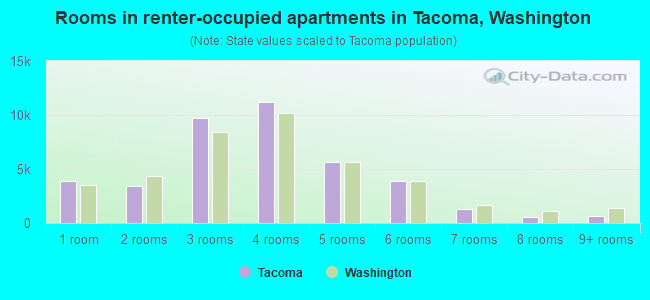
- Rooms in renter-occupied apartments in Tacoma, Washington
- 3,8611 room
- 3,3862 rooms
- 9,7493 rooms
- 11,2244 rooms
- 5,6025 rooms
- 3,9206 rooms
- 1,3097 rooms
- 5588 rooms
- 6549+ rooms
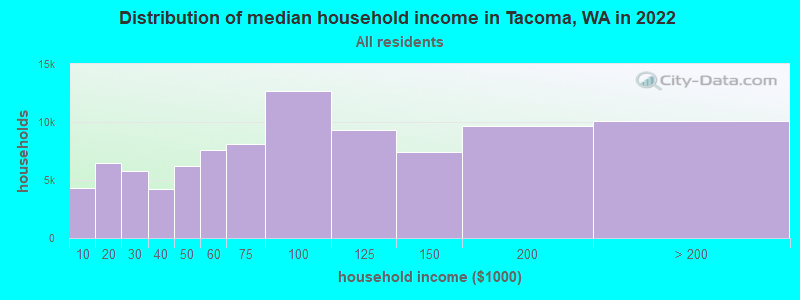
Tacoma, WA household income distribution

- 4,310Less than $10,000
- 6,428$10,000 to $19,999
- 5,762$20,000 to $29,999
- 4,239$30,000 to $39,999
- 6,237$40,000 to $49,999
- 7,551$50,000 to $59,999
- 8,141$60,000 to $74,999
- 12,682$75,000 to $99,999
- 9,342$100,000 to $124,999
- 7,451$125,000 to $149,999
- 9,680$150,000 to $199,999
- 10,128$200,000 or more
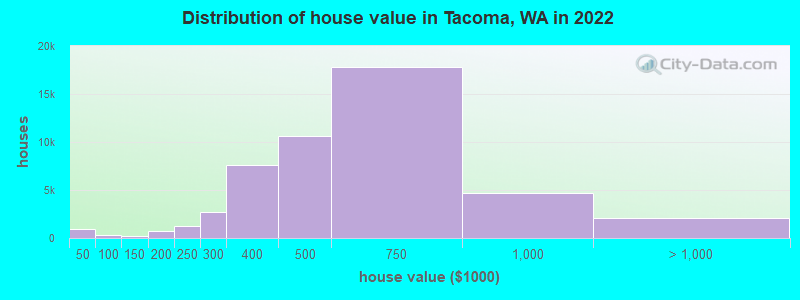
Home value of owner - occupied houses in 2022 in Tacoma, WA
-
- 414Less than $10,000
- 13$10,000 to $14,999
- 66$15,000 to $19,999
- 66$20,000 to $24,999
- 66$25,000 to $29,999
- 77$30,000 to $34,999
- 153$35,000 to $39,999
- 60$40,000 to $49,999
- 126$50,000 to $59,999
- 24$60,000 to $69,999
- 41$70,000 to $79,999
- 18$80,000 to $89,999
- 49$90,000 to $99,999
- 119$100,000 to $124,999
- 125$125,000 to $149,999
- 280$150,000 to $174,999
- 407$175,000 to $199,999
- 1,227$200,000 to $249,999
- 2,756$250,000 to $299,999
- 7,624$300,000 to $399,999
- 10,618$400,000 to $499,999
- 17,820$500,000 to $749,999
- 4,719$750,000 to $999,999
- 1,676$1,000,000 to $1,499,999
- 152$1,500,000 to $1,999,999
- 262$2,000,000 or more
Rent paid by renters in 2022 in Tacoma, WA
-
- 175Less than $100
- 70$100 to $149
- 298$150 to $199
- 959$200 to $249
- 295$250 to $299
- 533$300 to $349
- 282$350 to $399
- 205$400 to $449
- 273$450 to $499
- 358$500 to $549
- 248$550 to $599
- 204$600 to $649
- 403$650 to $699
- 178$700 to $749
- 239$750 to $799
- 915$800 to $899
- 2,826$900 to $999
- 6,167$1,000 to $1,249
- 7,414$1,250 to $1,499
- 11,931$1,500 to $1,999
- 3,325$2,000 to $2,499
- 1,212$2,500 to $2,999
- 1,078$3,000 to $3,499
- 79$3,500 or more
- 596No cash rent
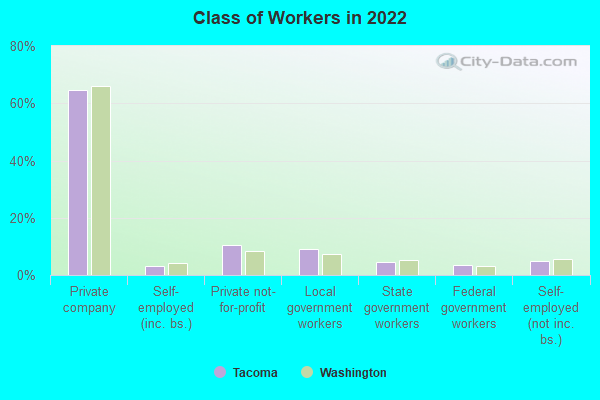
Percentage of workers working in this county: 75.6%
Number of people working at home: 17,880 (16.5% of all workers)
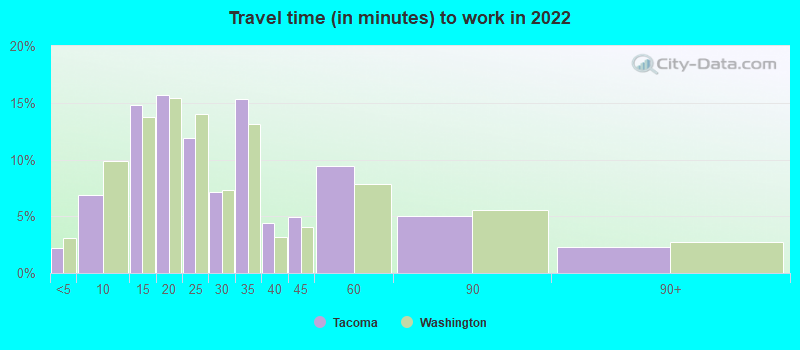
Travel time to work (commute)
- Less than 5 minutes: 2,656
- 5 to 9 minutes: 6,962
- 10 to 14 minutes: 12,576
- 15 to 19 minutes: 16,291
- 20 to 24 minutes: 11,959
- 25 to 29 minutes: 5,498
- 30 to 34 minutes: 11,139
- 35 to 39 minutes: 4,318
- 40 to 44 minutes: 3,505
- 45 to 59 minutes: 7,630
- 60 to 89 minutes: 5,102
- 90 or more minutes: 2,812
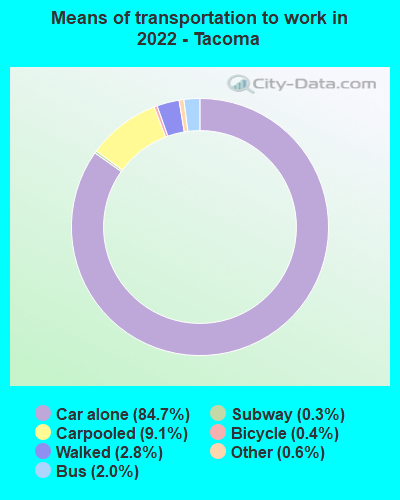
Means of transportation to work:
- Drove a car alone: 87,154 (72.1%)
- Carpooled: 9,413 (7.8%)
- Bus: 2,108 (1.7%)
- Long-distance train or commuter rail: 306 (0.3%)
- Light rail, streetcar or trolley: 86 (0.1%)
- Taxi: 582 (0.5%)
- Bicycle: 387 (0.3%)
- Walked: 2,921 (2.4%)
- Worked at home: 17,880 (14.8%)
- Unemployment by race in 2022
- Unemployment rate for White non-Hispanic residents
- 6.0%Males
- 4.1%Females
- Unemployment rate for Black residents
- 13.2%Males
- 8.2%Females
- Unemployment rate for American Indian and Alaska Native residents
- 4.9%Males
- 4.7%Females
- Unemployment rate for Asian residents
- 5.4%Males
- 2.8%Females
- Unemployment rate for other race residents
- 6.5%Males
- 3.0%Females
- Unemployment rate for two or more race residents
- 9.4%Males
- 4.7%Females
- Unemployment rate for Hispanic or Latino residents
- 11.9%Males
- 11.1%Females
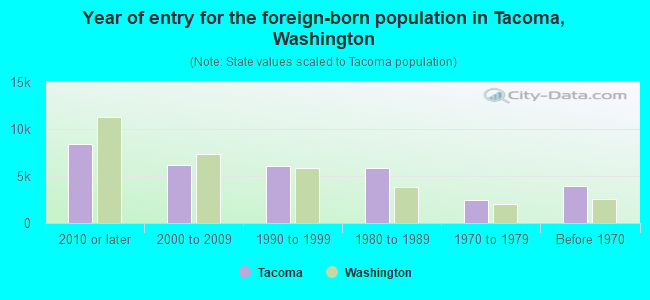
- Year of entry for the foreign-born population in Tacoma, Washington
- 8,4282010 or later
- 6,2182000 to 2009
- 6,0531990 to 1999
- 5,8721980 to 1989
- 2,4881970 to 1979
- 3,985Before 1970
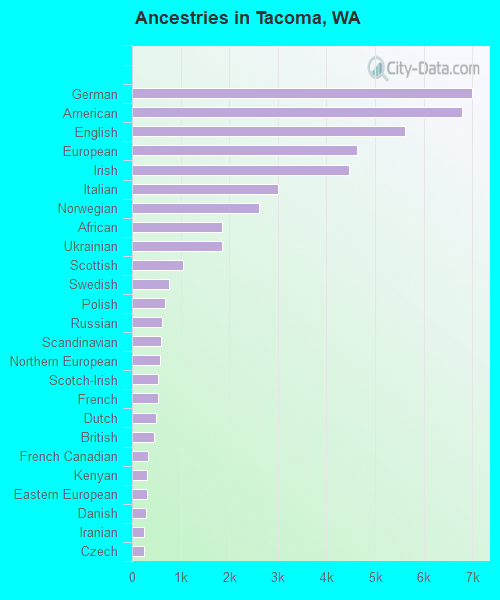
First ancestries reported:
- German: 6,993 (7.0%)
- American: 6,797 (6.8%)
- English: 5,621 (5.7%)
- European: 4,623 (4.6%)
- Irish: 4,473 (4.5%)
- Italian: 3,009 (3.0%)
- Norwegian: 2,605 (2.6%)
- African: 1,851 (1.9%)
- Ukrainian: 1,851 (1.9%)
- Scottish: 1,050 (1.1%)
- Swedish: 770 (0.8%)
- Polish: 669 (0.7%)
- Russian: 618 (0.6%)
- Scandinavian: 595 (0.6%)
- Northern European: 567 (0.6%)
- Scotch-Irish: 544 (0.5%)
- French: 525 (0.5%)
- Dutch: 498 (0.5%)
- British: 462 (0.5%)
- French Canadian: 331 (0.3%)
- Kenyan: 307 (0.3%)
- Eastern European: 300 (0.3%)
- Danish: 287 (0.3%)
- Iranian: 255 (0.3%)
- Czech: 238 (0.2%)
- Canadian: 230 (0.2%)
- Nigerian: 218 (0.2%)
- Jamaican: 215 (0.2%)
- Romanian: 212 (0.2%)
- Finnish: 161 (0.2%)
- Ethiopian: 160 (0.2%)
- Icelander: 158 (0.2%)
- Croatian: 158 (0.2%)
- Welsh: 131 (0.1%)
- Trinidadian and Tobagonian: 107 (0.1%)
- Ugandan: 96 (0.10%)
- Belizean: 95 (0.10%)
- Greek: 87 (0.09%)
- Brazilian: 82 (0.08%)
- British West Indian: 80 (0.08%)
- Bulgarian: 64 (0.06%)
- Swiss: 62 (0.06%)
- South African: 51 (0.05%)
- Somali: 47 (0.05%)
- Liberian: 46 (0.05%)
- Hungarian: 40 (0.04%)
- West Indian: 37 (0.04%)
- Slovak: 36 (0.04%)
- Afghan: 34 (0.03%)
- Lithuanian: 34 (0.03%)
- Austrian: 32 (0.03%)
- Australian: 28 (0.03%)
- Celtic: 28 (0.03%)
- Turkish: 27 (0.03%)
- Yugoslavian: 27 (0.03%)
- Albanian: 26 (0.03%)
- Portuguese: 25 (0.03%)
- Lebanese: 20 (0.02%)
- German Russian: 20 (0.02%)
- Belgian: 20 (0.02%)
- Slovene: 17 (0.02%)
- Basque: 15 (0.02%)
- Carpatho Rusyn: 14 (0.01%)
- Barbadian: 14 (0.01%)
- Estonian: 13 (0.01%)
- Armenian: 12 (0.01%)
- Palestinian: 12 (0.01%)
- Slavic: 12 (0.01%)
- Latvian: 10 (0.01%)
- Czechoslovakian: 9 (0.01%)
- Assyrian: 7 (0.01%)
- Arab: 5 (0.01%)
Most common places of birth for foreign-born residents (%):
| Tacoma: | 16.2% (4,483) |
| Washington: | 21.1% (241,655) |
| Tacoma: | 11.8% (3,264) |
| Washington: | 5.4% (62,003) |
| Tacoma: | 7.4% (2,060) |
| Washington: | 4.3% (48,886) |
| Tacoma: | 6.9% (1,919) |
| Washington: | 6.3% (71,661) |
| Tacoma: | 5.4% (1,503) |
| Washington: | 3.1% (35,872) |
| Tacoma: | 4.5% (1,250) |
| Washington: | 1.0% (10,993) |
| Tacoma: | 3.3% (924) |
| Washington: | 7.4% (84,470) |
| Tacoma: | 3.1% (858) |
| Washington: | 4.1% (47,238) |
| Tacoma: | 3.0% (818) |
| Washington: | 1.9% (21,540) |
| Tacoma: | 2.8% (764) |
| Washington: | 1.1% (12,735) |
| Tacoma: | 2.3% (645) |
| Washington: | 1.6% (17,761) |
| Tacoma: | 2.0% (555) |
| Washington: | 0.9% (9,937) |
| Tacoma: | 1.8% (507) |
| Washington: | 8.9% (101,353) |
| Tacoma: | 1.7% (484) |
| Washington: | 0.5% (5,926) |
| Tacoma: | 1.6% (453) |
| Washington: | 1.5% (17,453) |
Place of birth for U.S.-born residents:
- This state: 107,911
- Other state: 82,005
- Northeast: 8,945
- Midwest: 16,762
- South: 19,159
- West: 37,139
82.8% of Tacoma residents lived in the same house 1 years ago.
Out of people who lived in different houses, 32.8% lived in this county.
Out of people who lived in different counties, 53.5% lived in Washington.
| Tacoma: | 82.8% |
| State average: | 85.2% |
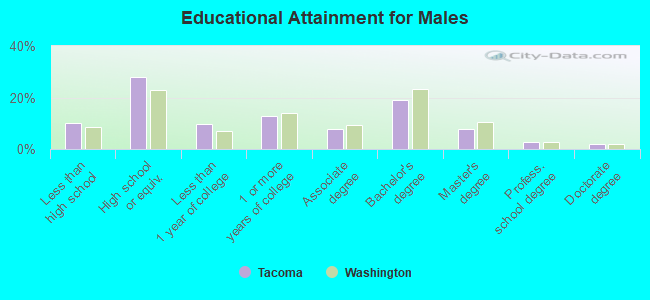
Education attainment for males 25 years and older:
- No schooling: 1,749
- Nursery to 4th grade: 25
- 5th and 6th grade: 692
- 7th and 8th grade: 453
- 9th grade: 250
- 10th grade: 291
- 11th grade: 2,568
- 12th grade, no diploma: 1,936
- High school graduate (or equivalency): 21,930
- Less than 1 year of college: 7,449
- Some college more than 1 year, no degree: 10,059
- Associate degree: 5,976
- Bachelor's degree: 14,955
- Master's degree: 6,202
- Professional school degree: 2,069
- Doctorate degree: 1,400
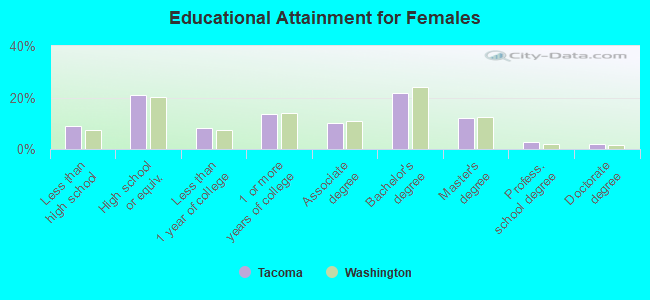
Education attainment for females 25 years and older:
- No schooling: 1,749
- Nursery to 4th grade: 349
- 5th and 6th grade: 823
- 7th and 8th grade: 358
- 9th grade: 128
- 10th grade: 1,016
- 11th grade: 797
- 12th grade, no diploma: 1,901
- High school graduate (or equivalency): 16,739
- Less than 1 year of college: 6,578
- Some college more than 1 year, no degree: 10,665
- Associate degree: 8,008
- Bachelor's degree: 17,192
- Master's degree: 9,501
- Professional school degree: 2,306
- Doctorate degree: 1,427


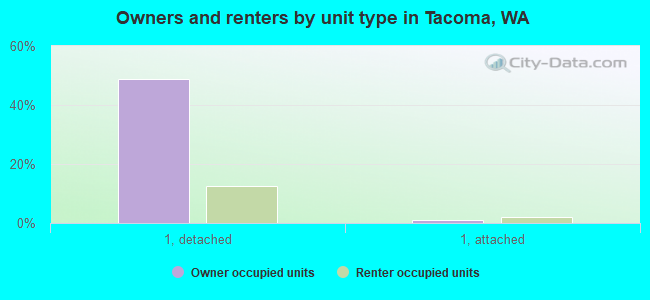
Housing units in structures:
- One, detached: 58,116
- One, attached: 2,926
- Two: 2,418
- 3 or 4: 5,730
- 5 to 9: 6,952
- 10 to 19: 5,884
- 20 to 49: 6,485
- 50 or more: 9,035
- Mobile homes: 326
- Boats, RVs, vans, etc.: 62
Median worth of mobile homes: $158,300
Housing units lacking complete kitchen facilities in 2022: 1.8%
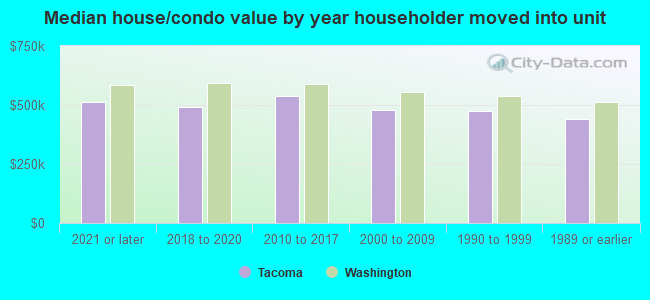
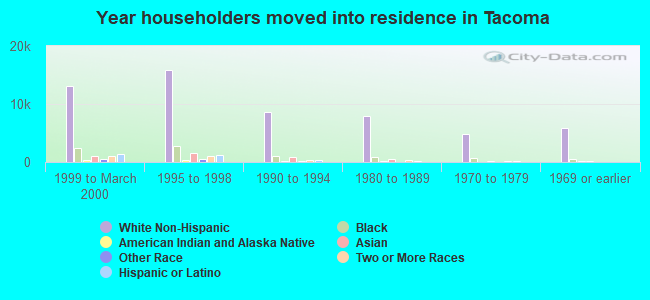
House/condo owner moved in on average 9 years ago
Renter moved in on average 2 years ago
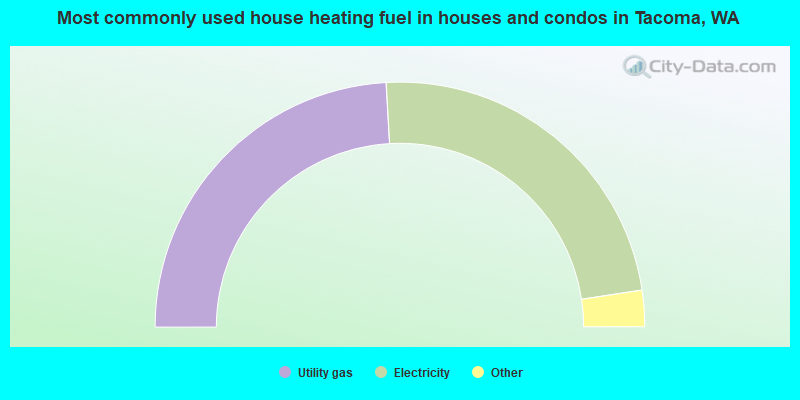
- 48.2%Utility gas
- 47.0%Electricity
- 1.9%Fuel oil, kerosene, etc.
- 1.2%Bottled, tank, or LP gas
- 1.0%Wood
- 0.3%Other fuel
- 0.2%No fuel used
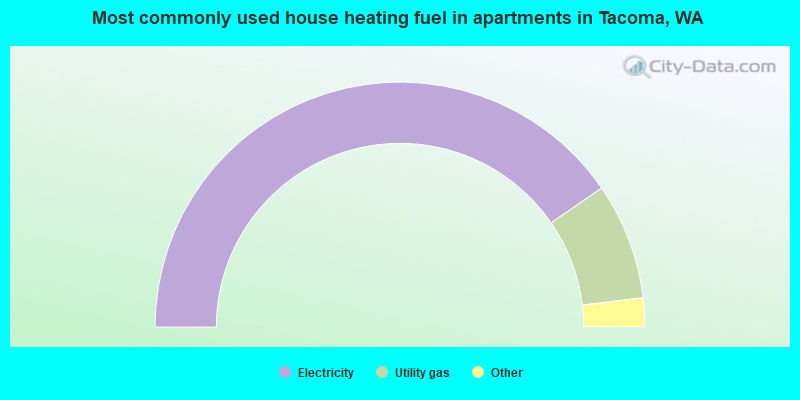
- 80.9%Electricity
- 15.4%Utility gas
- 1.8%No fuel used
- 0.9%Bottled, tank, or LP gas
- 0.4%Fuel oil, kerosene, etc.
- 0.4%Wood
- 0.2%Other fuel
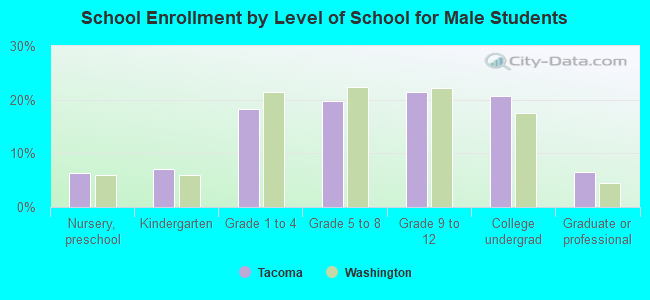
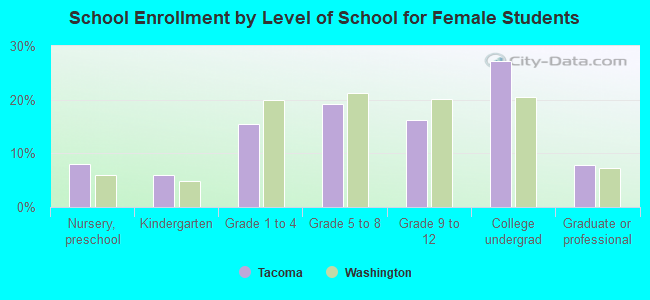
Private vs. public school enrollment:
| Here: | 13.3% |
| Washington: | 12.4% |
| Here: | 12.5% |
| Washington: | 9.2% |
| Here: | 27.7% |
| Washington: | 16.5% |