Stratford, CT (Connecticut) Houses and Residents
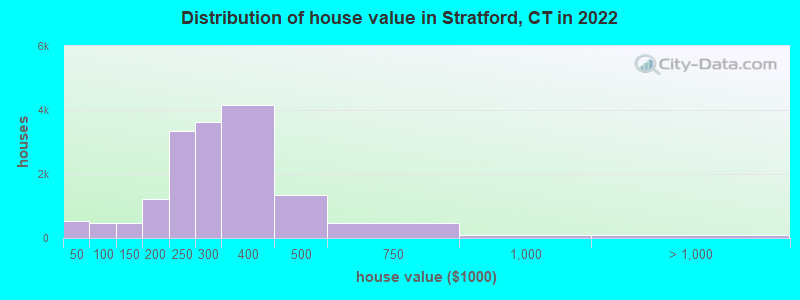
Estimated median house or condo value in 2022: $344,606 (it was $159,400 in 2000 )
Stratford:
$344,606Connecticut:
$347,200
Lower value quartile - upper value quartile: $261,156 - $396,253Mean price in 2022: Detached houses: $348,906 Here:
$348,906State:
$503,946
Townhouses or other attached units: $254,219 Here:
$254,219State:
$304,959
In 2-unit structures: $249,810 Here:
$249,810State:
$304,133
In 3-to-4-unit structures: $243,836 Here:
$243,836State:
$272,970
In 5-or-more-unit structures: $194,948 Here:
$194,948State:
$249,308
Total population: 51,384 (Urban population: 49,976, Rural population: 0)
Houses: 22,110 (20,200 occupied: 16,184 owner occupied, 4,260 renter occupied )
% of renters here:
21%State:
34%
Housing density: 1,257 houses/condos per square mile
Median price asked for vacant for-sale houses and condos in 2022: $303,205.
Median contract rent in 2022: $1,284 (lower quartile is $965, upper quartile is $1,739)
Median rent asked for vacant for-rent units in 2022: $1,695
Median gross rent in Stratford, CT in 2022: $1,525
Housing units in Stratford with a mortgage: 10,496 (216 second mortgage, 1,336 home equity loan, 41 both second mortgage and home equity loan )Houses without a mortgage: 5,009
Median household income for houses/condos with a mortgage: $121,905
Median household income for apartments without a mortgage: $81,058
Median monthly housing costs: $1,852
Data:
Median house or condo value ($)
Median house or condo value ($ change since 2000)
Median house or condo value ($) - White
Median house or condo value ($) - Black or African American
Median house or condo value ($) - Asian
Median house or condo value ($) - Hispanic or Latino
Median house or condo value ($) - American Indian and Alaska Native
Median house or condo value ($) - Multirace
Median house or condo value ($) - Other Race
Median price asked for mobile homes ($)
Household density (households per square mile)
Mean house or condo value by units in structure - 1, detached ($)
Mean house or condo value by units in structure - 1, attached ($)
Mean house or condo value by units in structure - 2 ($)
Mean house or condo value by units in structure by units in structure - 3 or 4 ($)
Mean house or condo value by units in structure - 5 or more ($)
Mean house or condo value by units in structure - Boat, RV, van, etc. ($)
Mean house or condo value by units in structure - Mobile home ($)
Median contract rent ($)
Median contract rent - Lower quartile ($)
Median contract rent - Upper quartile ($)
Median gross rent ($)
Urban houses (%)
Rural houses (%)
Houses occupied (%)
Houses occupied (% change since 2000)
Houses owner occupied (%)
Houses owner occupied (% change since 2000)
Houses renter occupied (%)
Houses renter occupied (% change since 2000)
Vacant housing units - For rent (%)
Vacant housing units - For rent (% change since 2000)
Vacant housing units - For sale only (%)
Vacant housing units - For sale only (% change since 2000)
Vacant housing units - Rented or sold, not occupied (%)
Vacant housing units - Rented or sold, not occupied (% change since 2000)
Vacant housing units - For seasonal, recreational, or occasional use (%)
Vacant housing units - For seasonal, recreational, or occasional use (% change since 2000)
Vacant housing units - For migrant workers (%)
Vacant housing units - For migrant workers (% change since 2000)
Vacant housing units - Other vacant (%)
Vacant housing units - Other vacant (% change since 2000)
Median monthly housing costs ($)
Median household income for houses/condos with a mortgage ($)
Median household income for houses/condos without a mortgage ($)
Median household income ($)
Median household income ($) - White
Median household income ($) - Black or African American
Median household income ($) - Asian
Median household income ($) - Hispanic or Latino
Median household income ($) - American Indian and Alaska Native
Median household income ($) - Multirace
Median household income ($) - Other Race
Mortgage status - with mortgage (%)
Mortgage status - with second mortgage (%)
Mortgage status - with home equity loan (%)
Mortgage status - with both second mortgage and home equity loan (%)
Mortgage status - without a mortgage (%)
Median year house/condo built
Median year apartment built
Household type by relationship - Male householder living alone (%)
Household type by relationship - Male householder not living alone (%)
Household type by relationship - Female householder living alone (%)
Household type by relationship - Female householder not living alone (%)
Household type by relationship - Opposite-Sex spouse (%)
Household type by relationship - Same-Sex spouse (%)
Household type by relationship - Opposite-Sex unmarried partner (%)
Household type by relationship - Same-Sex unmarried partner (%)
Household type by relationship - In group quarters (%)
Size of family households - 2-person household (%)
Size of family households - 3-person household (%)
Size of family households - 4-person household (%)
Size of family households - 5-person household (%)
Size of family households - 6-person household (%)
Size of family households - 7-or-more-person household (%)
Size of nonfamily households - 1-person household (%)
Size of nonfamily households - 2-person household (%)
Size of nonfamily households - 3-person household (%)
Size of nonfamily households - 4-person household (%)
Size of nonfamily households - 5-person household (%)
Size of nonfamily households - 6-person household (%)
Size of nonfamily households - 7-or-moreperson household (%)
Year house built - Built 2010 or later (%)
Year house built - Built 2000 to 2009 (%)
Year house built - Built 1990 to 1999 (%)
Year house built - Built 1980 to 1989 (%)
Year house built - Built 1970 to 1979 (%)
Year house built - Built 1960 to 1969 (%)
Year house built - Built 1950 to 1959 (%)
Year house built - Built 1940 to 1949 (%)
Year house built - Built 1939 or earlier (%)
Median number of rooms in houses and condos
Median number of rooms in apartments
Median number of bedrooms in owner occupied houses
Mean number of bedrooms in owner occupied houses
Median number of bedrooms in renter occupied houses
Mean number of bedrooms in renter occupied houses
Median number of vehichles in owner occupied houses
Mean number of vehichles in owner occupied houses
Median number of vehichles in renter occupied houses
Mean number of vehichles in renter occupied houses
Rooms in owner-occupied houses - 1 room (%)
Rooms in owner-occupied houses - 2 rooms (%)
Rooms in owner-occupied houses - 3 rooms (%)
Rooms in owner-occupied houses - 4 rooms (%)
Rooms in owner-occupied houses - 5 rooms (%)
Rooms in owner-occupied houses - 6 rooms (%)
Rooms in owner-occupied houses - 7 rooms (%)
Rooms in owner-occupied houses - 8 rooms (%)
Rooms in owner-occupied houses - 9+ rooms (%)
Rooms in renter-occupied houses - 1 room (%)
Rooms in renter-occupied houses - 2 rooms (%)
Rooms in renter-occupied houses - 3 rooms (%)
Rooms in renter-occupied houses - 4 rooms (%)
Rooms in renter-occupied houses - 5 rooms (%)
Rooms in renter-occupied houses - 6 rooms (%)
Rooms in renter-occupied houses - 7 rooms (%)
Rooms in renter-occupied houses - 8 rooms (%)
Rooms in renter-occupied houses - 9+ rooms (%)
Bedrooms in owner-occupied houses - no bedrooms (%)
Bedrooms in owner-occupied houses - 1 bedroom (%)
Bedrooms in owner-occupied houses - 2 bedrooms (%)
Bedrooms in owner-occupied houses - 3 bedrooms (%)
Bedrooms in owner-occupied houses - 4 bedrooms (%)
Bedrooms in owner-occupied houses - 5+ bedrooms (%)
Bedrooms in renter-occupied houses - no bedrooms (%)
Bedrooms in renter-occupied houses - 1 bedroom (%)
Bedrooms in renter-occupied houses - 2 bedrooms (%)
Bedrooms in renter-occupied houses - 3 bedrooms (%)
Bedrooms in renter-occupied houses - 4 bedrooms (%)
Bedrooms in renter-occupied houses - 5+ bedrooms (%)
Vehicles available in owner-occupied houses - no vehicle available (%)
Vehicles available in owner-occupied houses - 1 vehicle available(%)
Vehicles available in owner-occupied houses - 2 Vehicles available (%)
Vehicles available in owner-occupied houses - 3 Vehicles available (%)
Vehicles available in owner-occupied houses - 4 Vehicles available (%)
Vehicles available in owner-occupied houses - 5+ Vehicles available (%)
Vehicles available in renter-occupied houses - no vehicle available (%)
Vehicles available in renter-occupied houses - 1 vehicle available (%)
Vehicles available in renter-occupied houses - 2 Vehicles available (%)
Vehicles available in renter-occupied houses - 3 Vehicles available (%)
Vehicles available in renter-occupied houses - 4 Vehicles available (%)
Vehicles available in renter-occupied houses - 5+ Vehicles available (%)
Housing units in structures - 1, detached (%)
Housing units in structures - 1, attached (%)
Housing units in structures - 2 (%)
Housing units in structures - 3 or 4 (%)
Housing units in structures - 5 to 9 (%)
Housing units in structures - 10 to 19 (%)
Housing units in structures - 20 to 49 (%)
Housing units in structures - 50 or more (%)
Housing units in structures - Mobile home (%)
Housing units in structures - Boat, RV, van, etc. (%)
Housing units in structures - Owners - 1, detached (%)
Housing units in structures - Owners - 1, attached (%)
Housing units in structures - Owners - 2 (%)
Housing units in structures - Owners - 3 or 4 (%)
Housing units in structures - Owners - 5 to 9 (%)
Housing units in structures - Owners - 10 to 19 (%)
Housing units in structures - Owners - 20 to 49 (%)
Housing units in structures - Owners - 50 or more (%)
Housing units in structures - Owners - Mobile home (%)
Housing units in structures - Owners - Boat, RV, van, etc. (%)
Housing units in structures - Renters - 1, detached (%)
Housing units in structures - Renters - 1, attached (%)
Housing units in structures - Renters - 2 (%)
Housing units in structures - Renters - 3 or 4 (%)
Housing units in structures - Renters - 5 to 9 (%)
Housing units in structures - Renters - 10 to 19 (%)
Housing units in structures - Renters - 20 to 49 (%)
Housing units in structures - Renters - 50 or more (%)
Housing units in structures - Renters - Mobile home (%)
Housing units in structures - Renters - Boat, RV, van, etc. (%)
House/condo owner moved in on average (years ago)
Renter moved in on average (years ago)
Year householder moved into unit - Moved in 1999 to March 2000 (%)
Year householder moved into unit - Moved in 1999 to March 2000 (%) - White
Year householder moved into unit - Moved in 1999 to March 2000 (%) - Black or African American
Year householder moved into unit - Moved in 1999 to March 2000 (%) - Asian
Year householder moved into unit - Moved in 1999 to March 2000 (%) - Hispanic or Latino
Year householder moved into unit - Moved in 1999 to March 2000 (%) - American Indian and Alaska Native
Year householder moved into unit - Moved in 1999 to March 2000 (%) - Multirace
Year householder moved into unit - Moved in 1999 to March 2000 (%) - Other Race
Year householder moved into unit - Moved in 1995 to 1998 (%)
Year householder moved into unit - Moved in 1995 to 1998 (%) - White
Year householder moved into unit - Moved in 1995 to 1998 (%) - Black or African American
Year householder moved into unit - Moved in 1995 to 1998 (%) - Asian
Year householder moved into unit - Moved in 1995 to 1998 (%) - Hispanic or Latino
Year householder moved into unit - Moved in 1995 to 1998 (%) - American Indian and Alaska Native
Year householder moved into unit - Moved in 1995 to 1998 (%) - Multirace
Year householder moved into unit - Moved in 1995 to 1998 (%) - Other Race
Year householder moved into unit - Moved in 1990 to 1994 (%)
Year householder moved into unit - Moved in 1990 to 1994 (%) - White
Year householder moved into unit - Moved in 1990 to 1994 (%) - Black or African American
Year householder moved into unit - Moved in 1990 to 1994 (%) - Asian
Year householder moved into unit - Moved in 1990 to 1994 (%) - Hispanic or Latino
Year householder moved into unit - Moved in 1990 to 1994 (%) - American Indian and Alaska Native
Year householder moved into unit - Moved in 1990 to 1994 (%) - Multirace
Year householder moved into unit - Moved in 1990 to 1994 (%) - Other Race
Year householder moved into unit - Moved in 1980 to 1989 (%)
Year householder moved into unit - Moved in 1980 to 1989 (%) - White
Year householder moved into unit - Moved in 1980 to 1989 (%) - Black or African American
Year householder moved into unit - Moved in 1980 to 1989 (%) - Asian
Year householder moved into unit - Moved in 1980 to 1989 (%) - Hispanic or Latino
Year householder moved into unit - Moved in 1980 to 1989 (%) - American Indian and Alaska Native
Year householder moved into unit - Moved in 1980 to 1989 (%) - Multirace
Year householder moved into unit - Moved in 1980 to 1989 (%) - Other Race
Year householder moved into unit - Moved in 1970 to 1979 (%)
Year householder moved into unit - Moved in 1970 to 1979 (%) - White
Year householder moved into unit - Moved in 1970 to 1979 (%) - Black or African American
Year householder moved into unit - Moved in 1970 to 1979 (%) - Asian
Year householder moved into unit - Moved in 1970 to 1979 (%) - Hispanic or Latino
Year householder moved into unit - Moved in 1970 to 1979 (%) - American Indian and Alaska Native
Year householder moved into unit - Moved in 1970 to 1979 (%) - Multirace
Year householder moved into unit - Moved in 1970 to 1979 (%) - Other Race
Year householder moved into unit - Moved in 1969 or earlier (%)
Year householder moved into unit - Moved in 1969 or earlier (%) - White
Year householder moved into unit - Moved in 1969 or earlier (%) - Black or African American
Year householder moved into unit - Moved in 1969 or earlier (%) - Asian
Year householder moved into unit - Moved in 1969 or earlier (%) - Hispanic or Latino
Year householder moved into unit - Moved in 1969 or earlier (%) - American Indian and Alaska Native
Year householder moved into unit - Moved in 1969 or earlier (%) - Multirace
Year householder moved into unit - Moved in 1969 or earlier (%) - Other Race
Housing units lacking complete plumbing facilities (%)
Housing units lacking complete kitchen facilities (%)
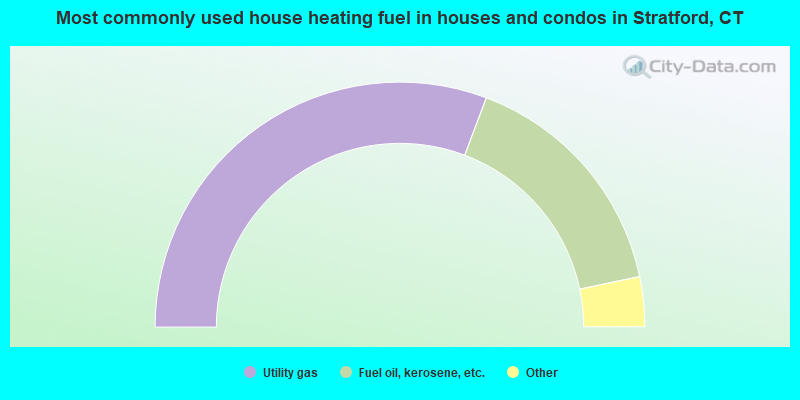
House heating fuel used in houses and condos - Utility gas (%)
House heating fuel used in houses and condos - Bottled, tank, or LP gas (%)
House heating fuel used in houses and condos - Electricity (%)
House heating fuel used in houses and condos - Fuel oil, kerosene, etc. (%)
House heating fuel used in houses and condos - Coal or coke (%)
House heating fuel used in houses and condos - Wood (%)
House heating fuel used in houses and condos - Solar energy (%)
House heating fuel used in houses and condos - Other fuel (%)
House heating fuel used in houses and condos - No fuel used (%)
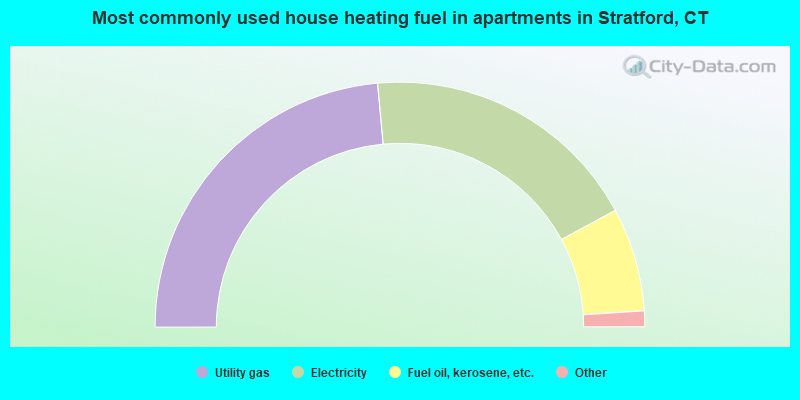
House heating fuel used in apartments - Utility gas (%)
House heating fuel used in apartments - Bottled, tank, or LP gas (%)
House heating fuel used in apartments - Electricity (%)
House heating fuel used in apartments - Fuel oil, kerosene, etc. (%)
House heating fuel used in apartments - Coal or coke (%)
House heating fuel used in apartments - Wood (%)
House heating fuel used in apartments - Solar energy (%)
House heating fuel used in apartments - Other fuel (%)
House heating fuel used in apartments - No fuel used (%)
Latest news about housing in Stratford, CT collected exclusively by city-data.com from local newspapers, TV, and radio stations
Median year house/condo built: 1957Median year apartment built: 1972Household type by relationship:
Households: 52,615
Male householders: 9,284 (2,045 living alone ), Female householders: 10,761 (3,424 living alone )10,033 spouses (9,899 opposite-sex spouses ), 916 unmarried partners , (871 opposite-sex unmarried partners ), 16,022 children (14,686 natural , 610 adopted , 725 stepchildren ), 1,150 grandchildren , 718 brothers or sisters , 1,017 parents , 57 foster children , 1,021 other relatives , 1,235 non-relatives In group quarters: 394
Size of family households: 6,251 2-persons , 3,583 3-persons , 2,266 4-persons , 1,340 5-persons , 308 6-persons , 276 7-or-more-persons .
Size of nonfamily households: 5,800 1-person , 718 2-persons , 117 3-persons , 17 4-persons , 15 6-persons , 25 7-or-more-persons .
6,264 married couples with children. single-parent households (472 men , 1,852 women ).
79.2% of residents of Stratford speak English at home. of residents speak Spanish at home (69% speak English very well , 19% speak English well , 8% speak English not well , 4% don't speak English at all ).of residents speak other Indo-European language at home (62% speak English very well , 24% speak English well , 11% speak English not well , 3% don't speak English at all ).of residents speak Asian or Pacific Island language at home (67% speak English very well , 13% speak English well , 13% speak English not well , 7% don't speak English at all ).of residents speak other language at home (78% speak English very well , 15% speak English well , 7% speak English not well ).
Foreign born population: 8,021 (15.2%)of them are naturalized citizens )
Median number of rooms in houses and condos:
Median number of rooms in apartments
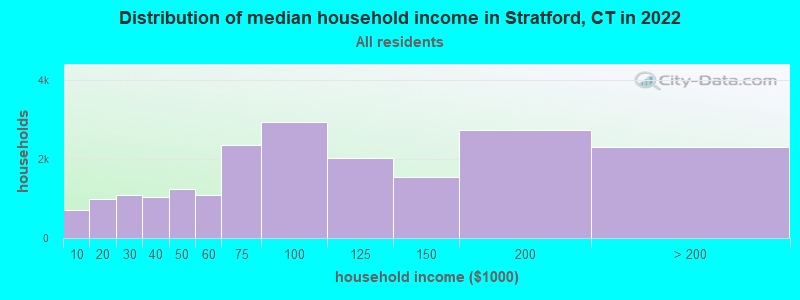
Stratford, CT household income distribution 709 Less than $10,000983 $10,000 to $19,9991,097 $20,000 to $29,9991,026 $30,000 to $39,9991,242 $40,000 to $49,9991,087 $50,000 to $59,9992,362 $60,000 to $74,9992,937 $75,000 to $99,9992,031 $100,000 to $124,9991,553 $125,000 to $149,9992,727 $150,000 to $199,9992,314 $200,000 or more
Home value of owner - occupied houses in 2022 in Stratford, CT 142 Less than $10,0006 $15,000 to $19,99967 $20,000 to $24,99925 $25,000 to $29,99933 $30,000 to $34,99991 $35,000 to $39,999148 $40,000 to $49,99968 $50,000 to $59,99968 $60,000 to $69,99949 $70,000 to $79,99976 $80,000 to $89,99945 $90,000 to $99,999216 $100,000 to $124,999252 $125,000 to $149,999536 $150,000 to $174,999696 $175,000 to $199,9993,329 $200,000 to $249,9993,611 $250,000 to $299,9994,162 $300,000 to $399,9991,358 $400,000 to $499,999483 $500,000 to $749,99996 $750,000 to $999,99911 $1,000,000 to $1,499,99978 $2,000,000 or moreRent paid by renters in 2022 in Stratford, CT 12 Less than $10076 $150 to $19925 $200 to $24971 $250 to $29930 $300 to $34952 $350 to $399136 $400 to $44998 $450 to $49937 $500 to $54947 $550 to $5993 $600 to $64932 $650 to $69918 $700 to $74915 $750 to $799246 $800 to $899370 $900 to $999827 $1,000 to $1,249729 $1,250 to $1,4991,230 $1,500 to $1,999194 $2,000 to $2,49955 $3,000 to $3,499238 $3,500 or more256 No cash rent
Percentage of workers working in this county: 75.1%Number of people working at home: 2,696 (9.9% of all workers )
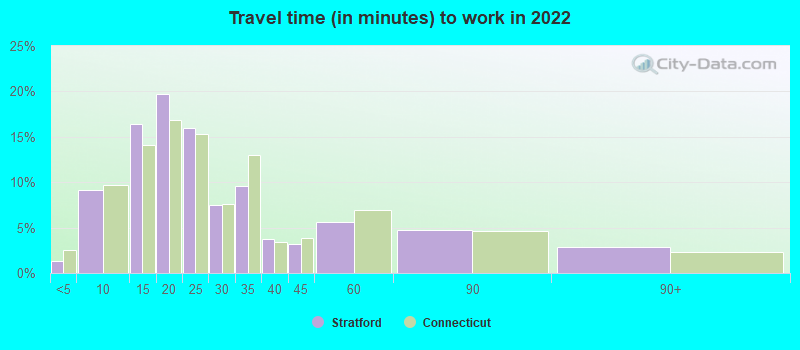
Travel time to work (commute)
Less than 5 minutes: 2595 to 9 minutes: 1,78010 to 14 minutes: 3,66715 to 19 minutes: 4,32420 to 24 minutes: 3,84125 to 29 minutes: 1,32130 to 34 minutes: 2,32235 to 39 minutes: 64540 to 44 minutes: 61645 to 59 minutes: 1,70760 to 89 minutes: 2,03490 or more minutes: 1,323
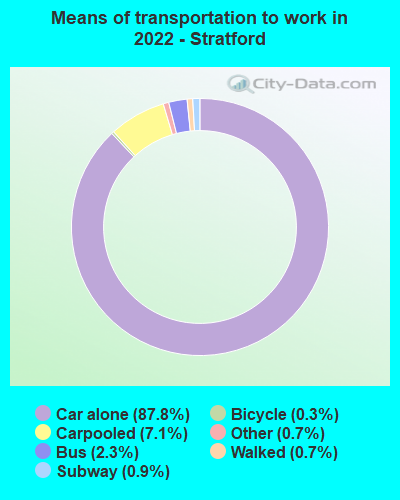
Means of transportation to work:
Drove a car alone: 20,713 (77.4%)Carpooled: 1,641 (6.1%)Bus : 380 (1.4%)Subway or elevated rail : 55 (0.2%)Long-distance train or commuter rail : 148 (0.6%)Light rail, streetcar or trolley : 23 (0.1%)Ferryboat: 65 (0.2%)Taxi: 229 (0.9%)Bicycle: 74 (0.3%)Walked: 196 (0.7%)Worked at home: 2,764 (10.3%)
Unemployment by race in 2022
Unemployment rate for White non-Hispanic residents 5.3% Males3.8% FemalesUnemployment rate for Black residents 5.0% Males3.0% FemalesUnemployment rate for American Indian and Alaska Native residents 10.9% MalesUnemployment rate for Asian residents 1.3% Males17.6% FemalesUnemployment rate for other race residents 4.8% Males11.3% FemalesUnemployment rate for two or more race residents 12.0% Males23.9% FemalesUnemployment rate for Hispanic or Latino residents 5.5% Males8.2% Females
Year of entry for the foreign-born population in Stratford, Connecticut
2,014 2010 or later 1,878 2000 to 2009 1,841 1990 to 1999 936 1980 to 1989 668 1970 to 1979 1,532 Before 1970
First ancestries reported:
Italian: 3,375 (12.4%)
Irish: 1,931 (7.1%)
American: 1,323 (4.9%)
Jamaican: 1,148 (4.2%)
Polish: 1,058 (3.9%)
Haitian: 679 (2.5%)
African: 600 (2.2%)
English: 546 (2.0%)
European: 502 (1.8%)
Slovak: 397 (1.5%)
Hungarian: 392 (1.4%)
German: 361 (1.3%)
Portuguese: 282 (1.0%)
Albanian: 275 (1.0%)
Afghan: 240 (0.9%)
French Canadian: 209 (0.8%)
Eastern European: 180 (0.7%)
Greek: 176 (0.6%)
Russian: 171 (0.6%)
Trinidadian and Tobagonian: 170 (0.6%)
French: 142 (0.5%)
Scottish: 135 (0.5%)
Turkish: 121 (0.4%)
Ukrainian: 110 (0.4%)
Swedish: 103 (0.4%)
Slavic: 98 (0.4%)
British: 92 (0.3%)
Lithuanian: 65 (0.2%)
Czechoslovakian: 62 (0.2%)
Canadian: 61 (0.2%)
Finnish: 59 (0.2%)
Syrian: 58 (0.2%)
West Indian: 58 (0.2%)
Scotch-Irish: 44 (0.2%)
Brazilian: 43 (0.2%)
Dutch: 32 (0.1%)
Ghanaian: 31 (0.1%)
Czech: 30 (0.1%)
Arab: 29 (0.1%)
Romanian: 29 (0.1%)
Bulgarian: 29 (0.1%)
Austrian: 23 (0.08%)
Lebanese: 22 (0.08%)
Armenian: 19 (0.07%)
Nigerian: 18 (0.07%)
Carpatho Rusyn: 17 (0.06%)
U.S. Virgin Islander: 16 (0.06%)
Belgian: 11 (0.04%)
Guyanese: 11 (0.04%)
Norwegian: 11 (0.04%)
Welsh: 10 (0.04%)
Celtic: 10 (0.04%)
Barbadian: 7 (0.03%)
Northern European: 7 (0.03%)
British West Indian: 6 (0.02%)
Yugoslavian: 5 (0.02%)
Most common places of birth for foreign-born residents (%): Jamaica Stratford:
13.9% (1,050)Connecticut:
100.0% (-1)
Haiti Stratford:
8.4% (634)Connecticut:
100.0% (-1)
Peru Stratford:
5.6% (421)Connecticut:
100.0% (-1)
Poland Stratford:
4.8% (362)Connecticut:
100.0% (-1)
Colombia Stratford:
4.7% (356)Connecticut:
100.0% (-1)
Mexico Stratford:
3.6% (271)Connecticut:
100.0% (-1)
El Salvador Stratford:
3.6% (268)Connecticut:
100.0% (-1)
Dominican Republic Stratford:
3.2% (244)Connecticut:
100.0% (-1)
Italy Stratford:
3.2% (241)Connecticut:
100.0% (-1)
India Stratford:
3.1% (232)Connecticut:
100.0% (-1)
Pakistan Stratford:
2.8% (215)Connecticut:
100.0% (-1)
Ecuador Stratford:
2.7% (205)Connecticut:
100.0% (-1)
Costa Rica Stratford:
2.7% (201)Connecticut:
100.0% (-1)
Guatemala Stratford:
2.2% (165)Connecticut:
100.0% (-1)
Trinidad and Tobago Stratford:
2.1% (161)Connecticut:
100.0% (-1)
China, excluding Hong Kong and Taiwan Stratford:
2.1% (157)Connecticut:
100.0% (-1)
Portugal Stratford:
2.0% (148)Connecticut:
100.0% (-1)
Brazil Stratford:
1.9% (144)Connecticut:
100.0% (-1)
Philippines Stratford:
1.7% (129)Connecticut:
100.0% (-1)
Place of birth for U.S.-born residents:
This state: 32,219Other state: 10,537Northeast: 6,922Midwest: 981South: 1,889West: 679 93.2% of Stratford residents lived in the same house 1 years ago.
Out of people who lived in different houses, 35.0% lived in this county.
Out of people who lived in different counties, 41.2% lived in Connecticut.
Stratford:
93.2%State average:
88.4%
Education attainment for males 25 years and older:
No schooling: 334Nursery to 4th grade: 1815th and 6th grade: 1217th and 8th grade: 1679th grade: 11510th grade: 14511th grade: 25312th grade, no diploma: 357High school graduate (or equivalency): 5,441Less than 1 year of college: 868Some college more than 1 year, no degree: 1,733Associate degree: 1,423Bachelor's degree: 3,806Master's degree: 1,761Professional school degree: 504Doctorate degree: 245
Education attainment for females 25 years and older:
No schooling: 534Nursery to 4th grade: 875th and 6th grade: 727th and 8th grade: 1139th grade: 8810th grade: 19011th grade: 19912th grade, no diploma: 332High school graduate (or equivalency): 6,049Less than 1 year of college: 1,379Some college more than 1 year, no degree: 2,013Associate degree: 2,211Bachelor's degree: 4,289Master's degree: 2,511Professional school degree: 356Doctorate degree: 167
Housing units in structures:
One, detached: 14,212One, attached: 2,521Two: 2,1093 or 4: 7315 to 9: 74510 to 19: 44920 to 49: 72250 or more: 598Boats, RVs, vans, etc.: 19Median worth of mobile homes: $452,607
Housing units lacking complete plumbing facilities in 2022: 0.5%Housing units lacking complete kitchen facilities in 2022: 0.9%House/condo owner moved in on average 14 years ago
Renter moved in on average 3 years ago
Private vs. public school enrollment:
Students in private schools in grades 1 to 8 (elementary and middle school): 329 Here:
7.9%Connecticut:
9.5%
Students in private schools in grades 9 to 12 (high school): 316 Here:
12.0%Connecticut:
12.9%
Students in private undergraduate colleges: 951 Here:
37.4%Connecticut:
35.5%