Housing density: 121 houses/condos per square mile
Median price asked for vacant for-sale houses and condos in 2022 in this county: $1,068,910.
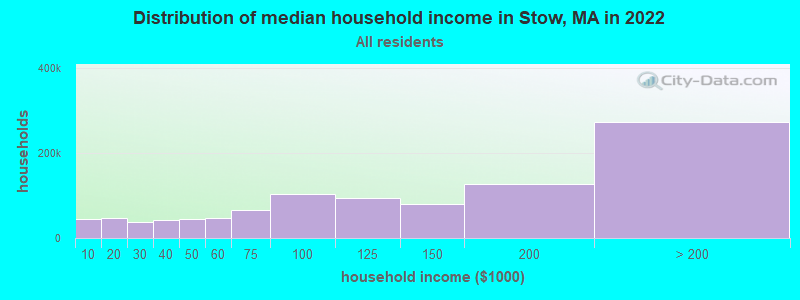
Median contract rent in 2022: $1,554 (lower quartile is $785, upper quartile is $1,969)
Median gross rent in Stow, MA in 2022: $1,767
Housing units in Stow with a mortgage: 1,394 (130 second mortgage, 280 home equity loan, 8 both second mortgage and home equity loan) Houses without a mortgage: 305
In family households: 1,161,600 (250,263 male householders, 116,393 female householders)
287,332 spouses, 410,462 children (392,286 natural, 9,871 adopted, 8,305 stepchildren), 16,644 grandchildren, 14,569 brothers or sisters, 15,064 parents, foster children, 15,023 other relatives, 25,838 non-relatives
In nonfamily households: 286,073 (95,244 male householders (67,197 living alone)), 118,788 female householders (94,319 living alone)), 72,041 nonrelatives
In group quarters: 55,412 (13,773 institutionalized population)
252,928 married couples with children.
55,356 single-parent households (9,721 men, 45,635 women).
91.2% of residents of Stow speak English at home.
1.0% of residents speak Spanish at home (69% speak English very well, 15% speak English well, 15% speak English not well).
5.2% of residents speak other Indo-European language at home (78% speak English very well, 13% speak English well, 9% speak English not well).
2.0% of residents speak Asian or Pacific Island language at home (60% speak English very well, 8% speak English well, 32% speak English not well).
0.6% of residents speak other language at home (76% speak English very well, 24% speak English well).
Foreign born population: 753 (11.6%)
(61.0% of them are naturalized citizens)
Year of entry for the foreign-born population in Stow, Massachusetts
571995 to March 2000
721990 to 1994
811985 to 1989
491980 to 1984
321975 to 1979
631970 to 1974
291965 to 1969
68Before 1965
First ancestries reported:
Irish: 1,452 (18.5%)
English: 1,184 (15.1%)
Italian: 972 (12.4%)
Other: 969 (12.3%)
French: 520 (6.6%)
German: 504 (6.4%)
Scottish: 295 (3.8%)
French Canadian: 281 (3.6%)
Scotch-Irish: 268 (3.4%)
Swedish: 234 (3.0%)
Polish: 202 (2.6%)
United States: 199 (2.5%)
Russian: 176 (2.2%)
Dutch: 103 (1.3%)
Greek: 91 (1.2%)
Czech: 90 (1.1%)
Lithuanian: 56 (0.7%)
Slovak: 53 (0.7%)
Norwegian: 51 (0.6%)
Danish: 30 (0.4%)
Hungarian: 28 (0.4%)
Welsh: 27 (0.3%)
Swiss: 24 (0.3%)
West Indian: 20 (0.3%)
Portuguese: 11 (0.1%)
Ukrainian: 11 (0.1%)
Most common places of birth for foreign-born residents (%):
United Kingdom
Stow:
26.4% (119)
Massachusetts:
3.3% (25,403)
China, excluding Hong Kong and Taiwan
Stow:
8.0% (36)
Massachusetts:
5.1% (39,255)
Netherlands
Stow:
6.7% (30)
Massachusetts:
0.3% (2,470)
Italy
Stow:
5.1% (23)
Massachusetts:
3.7% (28,319)
Czechoslovakia (includes Czech Republic and Slovakia)
Stow:
5.1% (23)
Massachusetts:
0.3% (1,943)
Hungary
Stow:
5.1% (23)
Massachusetts:
0.2% (1,710)
Brazil
Stow:
5.1% (23)
Massachusetts:
4.7% (36,669)
Laos
Stow:
4.7% (21)
Massachusetts:
0.4% (3,048)
Canada
Stow:
4.2% (19)
Massachusetts:
5.2% (40,247)
Taiwan
Stow:
3.8% (17)
Massachusetts:
0.9% (7,258)
Korea
Stow:
3.8% (17)
Massachusetts:
1.7% (13,456)
Colombia
Stow:
3.5% (16)
Massachusetts:
2.0% (15,286)
Germany
Stow:
2.4% (11)
Massachusetts:
1.9% (14,883)
Haiti
Stow:
2.4% (11)
Massachusetts:
4.4% (33,862)
France
Stow:
1.8% (8)
Massachusetts:
0.8% (5,895)
Romania
Stow:
1.8% (8)
Massachusetts:
0.3% (2,058)
Other Eastern Europe
Stow:
1.8% (8)
Massachusetts:
1.6% (12,350)
Pakistan
Stow:
1.8% (8)
Massachusetts:
0.5% (3,660)
Other Eastern Africa
Stow:
1.8% (8)
Massachusetts:
0.7% (5,693)
Place of birth for U.S.-born residents:
This state: 3,837
Other state: 1,587
Northeast: 986
Midwest: 239
South: 230
West: 132
69% of Stow residents lived in the same house 5 years ago. Out of people who lived in different houses, 70% lived in this county. Out of people who lived in different counties, 49% lived in Massachusetts.
Education attainment for males 25 years and older:
No schooling: 10
Nursery to 4th grade: 0
5th and 6th grade: 0
7th and 8th grade: 7
9th grade: 13
10th grade: 7
11th grade: 14
12th grade, no diploma: 20
High school graduate (or equivalency): 334
Less than 1 year of college: 39
Some college more than 1 year, no degree: 170
Associate degree: 45
Bachelor's degree: 661
Master's degree: 440
Professional school degree: 46
Doctorate degree: 107
Education attainment for females 25 years and older: