St. Petersburg, FL (Florida) Houses and Residents
| St. Petersburg: | $375,700 |
| Florida: | $354,100 |
Mean price in 2022:
Detached houses: $519,828
Here: $519,828 State: $500,941 Townhouses or other attached units: $446,867
Here: $446,867 State: $370,869 In 2-unit structures: $627,706
Here: $627,706 State: $423,188 In 3-to-4-unit structures: $332,887
Here: $332,887 State: $309,944 In 5-or-more-unit structures: $415,013
Here: $415,013 State: $447,145 Mobile homes: $138,695
Here: $138,695 State: $113,202 Occupied boats, RVs, vans, etc.: $66,936
Here: $66,936 State: $73,933
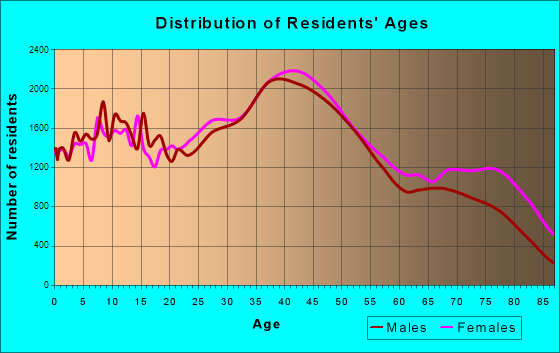
Total population: 253,693 (Urban population: 247,793, Rural population: 0)
Houses: 141,257 (117,276 occupied: 70,374 owner occupied, 46,902 renter occupied)
| % of renters here: | 40% |
| State: | 33% |
Housing density: 2,369 houses/condos per square mile
Median price asked for vacant for-sale houses and condos in 2022: $500,892.
Median contract rent in 2022: $1,387 (lower quartile is $1,028, upper quartile is $1,809)
Median rent asked for vacant for-rent units in 2022: $1,602
Median gross rent in St. Petersburg, FL in 2022: $1,576
Housing units in St. Petersburg with a mortgage: 39,568 (4,167 second mortgage, 203 home equity loan, 2,906 both second mortgage and home equity loan)
Houses without a mortgage: 895
Median household income for houses/condos with a mortgage: $100,959
Median household income for apartments without a mortgage: $67,583
Median monthly housing costs: $1,418
Compare current foreclosures near St. Petersburg, FL:
| Photo | Address | Area | Beds / Baths | Price | Details |
|---|---|---|---|---|---|

|
#1
83rd Ave N Apt 120
Saint Petersburg, FL 33702
|
1,000 sq. feet
|
2 baths 2 beds |
$125,000
|
show details |

|
#2
Harris Hawk Ave
Ruskin, FL 33570
|
1,926 sq. feet
|
2 baths 4 beds |
$365,000
|
show details |

|
#3
Tyler Cir N
Saint Petersburg, FL 33709
|
1,315 sq. feet
|
2 baths 3 beds |
$360,000
|
show details |

|
#4
Us Highway 19 N Apt 19-C
Clearwater, FL 33764
|
- sq. feet
|
2 baths 2 beds |
$208,000
|
show details |

|
#5
Harbor Hill Dr
Safety Harbor, FL 34695
|
1,227 sq. feet
|
1 baths 2 beds |
show details | |

|
#6
S Selbourne Ave
Tampa, FL 33611
|
942 sq. feet
|
1 baths 2 beds |
show details | |

|
#7
W Napoleon Ave
Tampa, FL 33611
|
922 sq. feet
|
1 baths 2 beds |
show details | |

|
#8
76th St E
Palmetto, FL 34221
|
2,644 sq. feet
|
3 baths 4 beds |
show details | |

|
#9
Lucerne Ave
Tampa, FL 33606
|
5,157 sq. feet
|
4 baths 4 beds |
show details | |

|
#10
S Habana Ave
Tampa, FL 33609
|
2,119 sq. feet
|
2 baths 3 beds |
show details |
| Photo | Address | Area | Beds / Baths | Price | Details |
|---|---|---|---|---|---|

|
#11
Bayside Village Dr Apt 108
Tampa, FL 33615
|
1,140 sq. feet
|
2 baths 2 beds |
show details | |

|
#12
Bayside Village Dr Apt 125
Tampa, FL 33615
|
1,140 sq. feet
|
2 baths 2 beds |
show details | |

|
#13
Bayside Village Dr Apt 302
Tampa, FL 33615
|
890 sq. feet
|
1 baths 1 beds |
show details | |

|
#14
Oak Pond St
Ruskin, FL 33570
|
2,082 sq. feet
|
2 baths 3 beds |
show details | |

|
#15
Richwood Pike Dr
Ruskin, FL 33570
|
2,196 sq. feet
|
3 baths 5 beds |
show details | |

|
#16
S Trask St
Tampa, FL 33611
|
1,214 sq. feet
|
1 baths 2 beds |
show details | |

|
#17
Bayside Village Dr Apt 202
Tampa, FL 33615
|
936 sq. feet
|
1 baths 1 beds |
show details | |

|
#18
Island Cay Way
Apollo Beach, FL 33572
|
2,007 sq. feet
|
2 baths 3 beds |
show details | |

|
#19
White Chicory Dr
Apollo Beach, FL 33572
|
1,451 sq. feet
|
2 baths 3 beds |
show details | |

|
#20
Deepwater Ln
Tampa, FL 33615
|
2,807 sq. feet
|
2 baths 4 beds |
show details |
| Photo | Address | Area | Beds / Baths | Price | Details |
|---|---|---|---|---|---|

|
#21
W Laurel St
Tampa, FL 33607
|
1,499 sq. feet
|
2 baths 3 beds |
show details | |

|
#22
Mira Lago Cir
Ruskin, FL 33570
|
2,210 sq. feet
|
3 baths 4 beds |
show details | |

|
#23
Simone Shores Cir
Apollo Beach, FL 33572
|
2,660 sq. feet
|
3 baths 4 beds |
show details | |

|
#24
Dandelion St
Apollo Beach, FL 33572
|
1,914 sq. feet
|
2 baths 4 beds |
show details | |

|
#25
Manatee Harbor Dr
Ruskin, FL 33570
|
1,276 sq. feet
|
1 baths 3 beds |
show details | |

|
#26
Tanana Fall Dr
Ruskin, FL 33570
|
1,835 sq. feet
|
2 baths 3 beds |
show details | |

|
#27
W Azeele St Apt 229
Tampa, FL 33609
|
702 sq. feet
|
1 baths 1 beds |
show details | |

|
#28
W Azeele St Apt 230
Tampa, FL 33609
|
702 sq. feet
|
1 baths 1 beds |
show details | |

|
#29
Floridana Dr
Apollo Beach, FL 33572
|
1,521 sq. feet
|
1 baths 2 beds |
show details | |

|
#30
Broad Winged Hawk Dr
Ruskin, FL 33570
|
2,573 sq. feet
|
2 baths 4 beds |
show details |
| Photo | Address | Area | Beds / Baths | Price | Details |
|---|---|---|---|---|---|

|
#31
Spring St
Largo, FL 33774
|
6,672 sq. feet
|
5 baths 6 beds |
show details | |

|
#32
W Southview Ave
Tampa, FL 33606
|
2,140 sq. feet
|
2 baths 3 beds |
show details | |

|
#33
Broad Winged Hawk Dr
Ruskin, FL 33570
|
1,935 sq. feet
|
2 baths 4 beds |
show details | |

|
#34
S Dakota Ave Apt 122
Tampa, FL 33606
|
708 sq. feet
|
1 baths 1 beds |
show details | |

|
#35
Bayshore Vista Dr
Tampa, FL 33611
|
2,930 sq. feet
|
2 baths 4 beds |
show details | |

|
#36
69th Ave E
Palmetto, FL 34221
|
1,517 sq. feet
|
2 baths 3 beds |
show details | |

|
#37
87th Ln E
Palmetto, FL 34221
|
1,576 sq. feet
|
2 baths 3 beds |
show details | |

|
#38
Bowen Daniel Dr Unit 1506
Tampa, FL 33616
|
2,555 sq. feet
|
3 baths 3 beds |
show details | |

|
#39
Interbay Blvd Unit 197
Tampa, FL 33616
|
1,480 sq. feet
|
2 baths 3 beds |
show details | |

|
#40
W North B St # 9
Tampa, FL 33606
|
1,864 sq. feet
|
2 baths 2 beds |
show details |
| Photo | Address | Area | Beds / Baths | Price | Details |
|---|---|---|---|---|---|

|
#41
W Gray St
Tampa, FL 33606
|
902 sq. feet
|
1 baths 2 beds |
show details | |

|
#42
46th St W
Palmetto, FL 34221
|
1,302 sq. feet
|
2 baths 3 beds |
show details | |

|
#43
E Longboat Blvd
Tampa, FL 33615
|
3,303 sq. feet
|
3 baths 4 beds |
show details | |

|
#44
47th St W
Palmetto, FL 34221
|
1,680 sq. feet
|
2 baths 3 beds |
show details | |

|
#45
W Montgomery Ter
Tampa, FL 33616
|
1,396 sq. feet
|
2 baths 3 beds |
show details | |

|
#46
50th Ave E
Palmetto, FL 34221
|
1,478 sq. feet
|
2 baths 4 beds |
show details | |

|
#47
Culbreath Key Way Apt 8311
Tampa, FL 33611
|
654 sq. feet
|
1 baths 1 beds |
show details | |

|
#48
Culbreath Key Way Apt 4306
Tampa, FL 33611
|
1,085 sq. feet
|
2 baths 2 beds |
show details | |

|
#49
6th Ave N
Saint Petersburg, FL 33713
|
795 sq. feet
|
1 baths 2 beds |
show details | |

|
Check over 1 million property listings on Foreclosure.com!
|
browse all offers | |||


 | Homes/Townhomes/Condos within short walking distance of Downtown St. Petersburg? (0 replies) |
| 75K houses in St. Petersburg? (44 replies) |
| Neighborhoods (houses) with fiber internet (15 replies) |
| When does it make sense to rent vs own in Florida? (68 replies) |
| Condo/Apartment Rentals in South Tampa - what to avoid? (2 replies) |
| Resources for super cheap apartments (23 replies) |
Median year apartment built: 1977
Household type by relationship:
Households: 261,245- Male householders: 56,280 (22,948 living alone), Female householders: 60,996 (25,855 living alone)
39,609 spouses (37,499 opposite-sex spouses), 11,566 unmarried partners, (10,037 opposite-sex unmarried partners), 57,127 children (52,851 natural, 1,546 adopted, 2,730 stepchildren), 3,402 grandchildren, 2,304 brothers or sisters, 4,406 parents, 633 foster children, 4,489 other relatives, 14,164 non-relatives
- In group quarters: 6,269
Size of family households: 30,554 2-persons, 10,846 3-persons, 8,572 4-persons, 2,338 5-persons, 866 6-persons, 516 7-or-more-persons.
Size of nonfamily households: 48,803 1-person, 13,546 2-persons, 709 3-persons, 133 4-persons, 393 5-persons.
19,645 married couples with children.
14,039 single-parent households (3,539 men, 10,500 women).
86.8% of residents of St. Petersburg speak English at home.
5.9% of residents speak Spanish at home (63% speak English very well, 21% speak English well, 14% speak English not well, 2% don't speak English at all).
3.8% of residents speak other Indo-European language at home (70% speak English very well, 19% speak English well, 10% speak English not well, 1% don't speak English at all).
2.1% of residents speak Asian or Pacific Island language at home (56% speak English very well, 23% speak English well, 13% speak English not well, 9% don't speak English at all).
0.8% of residents speak other language at home (73% speak English very well, 7% speak English well, 16% speak English not well, 4% don't speak English at all).
Foreign born population: 29,325 (11.2%)
(69.1% of them are naturalized citizens)
| Here: | 5.5 |
| State: | 5.9 |
| Here: | 3.8 |
| State: | 4.2 |

- Bedrooms in owner-occupied houses and condos in St. Petersburg, Florida
- 209no bedroom
- 2,7811 bedroom
- 27,4962 bedrooms
- 30,5663 bedrooms
- 7,9234 bedrooms
- 1,3995+ bedrooms

- Bedrooms in renter-occupied apartments in St. Petersburg, Florida
- 5,249no bedroom
- 15,4681 bedroom
- 18,4802 bedrooms
- 6,6793 bedrooms
- 1,0264 bedrooms
- 05+ bedrooms

- Cars and other vehicles available in St. Petersburg in owner-occupied houses/condos
- 2,374no vehicle
- 29,0801 vehicle
- 30,4362 vehicles
- 6,9093 vehicles
- 9094 vehicles
- 6665+ vehicles

- Cars and other vehicles available in St. Petersburg in renter-occupied apartments
- 6,346no vehicle
- 25,6341 vehicle
- 12,4752 vehicles
- 2,1593 vehicles
- 2884 vehicles
- 05+ vehicles

- Rooms in owner-occupied houses in St. Petersburg, Florida
- 1591 room
- 1632 rooms
- 3,3953 rooms
- 14,7494 rooms
- 16,4405 rooms
- 16,7656 rooms
- 8,1937 rooms
- 5,5298 rooms
- 4,9819+ rooms

- Rooms in renter-occupied apartments in St. Petersburg, Florida
- 4,5061 room
- 5,2092 rooms
- 9,6933 rooms
- 13,4064 rooms
- 6,1565 rooms
- 5,0776 rooms
- 1,8907 rooms
- 6298 rooms
- 3369+ rooms


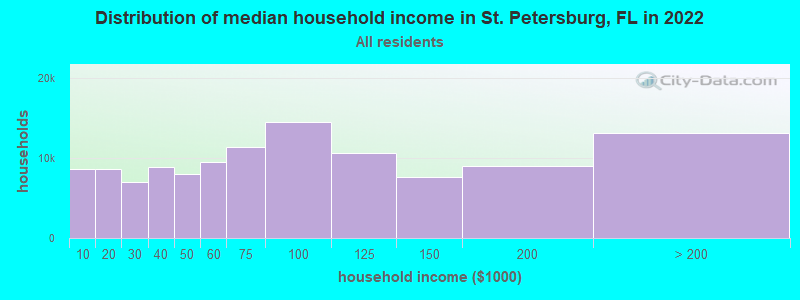
St. Petersburg, FL household income distribution

- 8,683Less than $10,000
- 8,702$10,000 to $19,999
- 7,017$20,000 to $29,999
- 8,931$30,000 to $39,999
- 7,985$40,000 to $49,999
- 9,565$50,000 to $59,999
- 11,446$60,000 to $74,999
- 14,537$75,000 to $99,999
- 10,619$100,000 to $124,999
- 7,597$125,000 to $149,999
- 8,986$150,000 to $199,999
- 13,208$200,000 or more
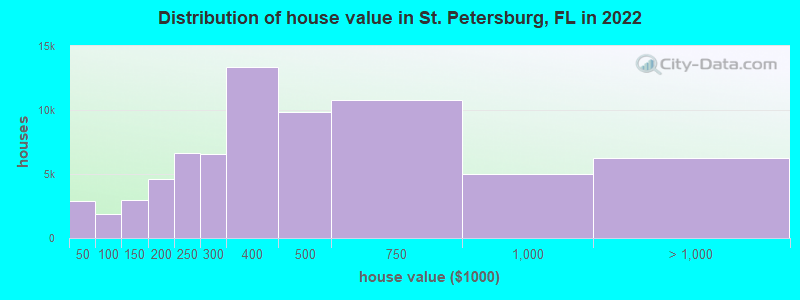
Home value of owner - occupied houses in 2022 in St. Petersburg, FL
-
- 396Less than $10,000
- 418$10,000 to $14,999
- 399$15,000 to $19,999
- 88$20,000 to $24,999
- 431$25,000 to $29,999
- 358$30,000 to $34,999
- 339$35,000 to $39,999
- 491$40,000 to $49,999
- 630$50,000 to $59,999
- 237$70,000 to $79,999
- 225$80,000 to $89,999
- 292$90,000 to $99,999
- 1,291$100,000 to $124,999
- 1,685$125,000 to $149,999
- 2,086$150,000 to $174,999
- 2,511$175,000 to $199,999
- 6,605$200,000 to $249,999
- 6,584$250,000 to $299,999
- 13,373$300,000 to $399,999
- 9,871$400,000 to $499,999
- 10,820$500,000 to $749,999
- 5,022$750,000 to $999,999
- 2,912$1,000,000 to $1,499,999
- 1,369$1,500,000 to $1,999,999
- 1,941$2,000,000 or more
Rent paid by renters in 2022 in St. Petersburg, FL
-
- 191Less than $100
- 123$150 to $199
- 600$200 to $249
- 197$300 to $349
- 215$350 to $399
- 269$400 to $449
- 910$450 to $499
- 108$500 to $549
- 268$550 to $599
- 389$600 to $649
- 810$650 to $699
- 923$700 to $749
- 806$750 to $799
- 2,074$800 to $899
- 2,350$900 to $999
- 7,794$1,000 to $1,249
- 7,625$1,250 to $1,499
- 12,356$1,500 to $1,999
- 3,552$2,000 to $2,499
- 1,671$2,500 to $2,999
- 449$3,000 to $3,499
- 714$3,500 or more
- 2,508No cash rent


Percentage of workers working in this county: 86.5%
Number of people working at home: 29,118 (21.7% of all workers)
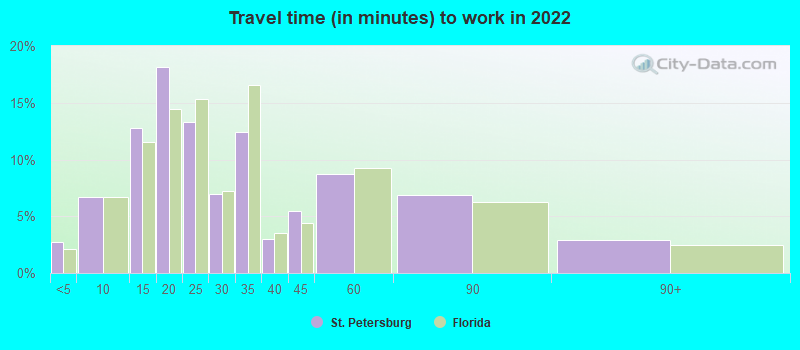
Travel time to work (commute)
- Less than 5 minutes: 2,342
- 5 to 9 minutes: 8,109
- 10 to 14 minutes: 15,119
- 15 to 19 minutes: 22,755
- 20 to 24 minutes: 15,233
- 25 to 29 minutes: 6,295
- 30 to 34 minutes: 15,317
- 35 to 39 minutes: 2,416
- 40 to 44 minutes: 2,522
- 45 to 59 minutes: 6,042
- 60 to 89 minutes: 5,464
- 90 or more minutes: 3,711
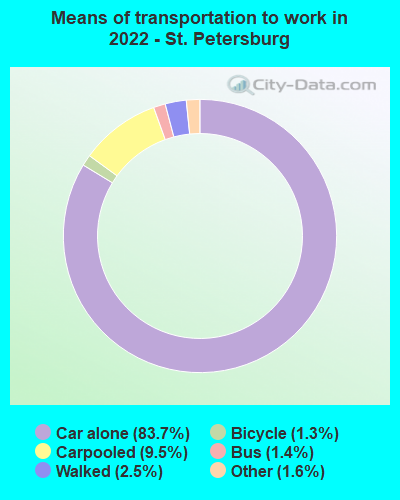
Means of transportation to work:
- Drove a car alone: 91,841 (66.1%)
- Carpooled: 10,383 (7.5%)
- Bus: 1,487 (1.1%)
- Long-distance train or commuter rail: 91 (0.1%)
- Taxi: 1,786 (1.3%)
- Bicycle: 1,442 (1.0%)
- Walked: 2,725 (2.0%)
- Worked at home: 29,118 (21.0%)

- Unemployment by race in 2022
- Unemployment rate for White non-Hispanic residents
- 4.6%Males
- 2.0%Females
- Unemployment rate for Black residents
- 15.4%Males
- 9.3%Females
- Unemployment rate for American Indian and Alaska Native residents
- 41.1%Males
- 22.0%Females
- Unemployment rate for Asian residents
- 0.6%Males
- 3.0%Females
- Unemployment rate for other race residents
- 2.5%Males
- 4.4%Females
- Unemployment rate for two or more race residents
- 7.0%Males
- 7.8%Females
- Unemployment rate for Hispanic or Latino residents
- 4.5%Males
- 9.7%Females

- Year of entry for the foreign-born population in St. Petersburg, Florida
- 7,8892010 or later
- 4,6492000 to 2009
- 4,6631990 to 1999
- 4,9701980 to 1989
- 2,8411970 to 1979
- 5,815Before 1970

First ancestries reported:
- American: 18,677 (14.0%)
- English: 9,798 (7.3%)
- German: 8,594 (6.4%)
- Irish: 7,515 (5.6%)
- Italian: 5,394 (4.0%)
- European: 2,612 (2.0%)
- Jamaican: 2,375 (1.8%)
- Polish: 2,342 (1.8%)
- French: 1,683 (1.3%)
- Scottish: 1,208 (0.9%)
- Scotch-Irish: 929 (0.7%)
- Russian: 814 (0.6%)
- Greek: 803 (0.6%)
- Canadian: 728 (0.5%)
- Portuguese: 701 (0.5%)
- Eastern European: 700 (0.5%)
- French Canadian: 700 (0.5%)
- Swedish: 687 (0.5%)
- Arab: 627 (0.5%)
- British: 608 (0.5%)
- Lebanese: 601 (0.5%)
- Norwegian: 535 (0.4%)
- Dutch: 529 (0.4%)
- Hungarian: 470 (0.4%)
- Serbian: 457 (0.3%)
- Lithuanian: 451 (0.3%)
- Haitian: 439 (0.3%)
- Ukrainian: 427 (0.3%)
- African: 410 (0.3%)
- Albanian: 390 (0.3%)
- Liberian: 335 (0.3%)
- Welsh: 329 (0.2%)
- Yugoslavian: 322 (0.2%)
- Slovak: 298 (0.2%)
- Swiss: 260 (0.2%)
- Northern European: 255 (0.2%)
- Belgian: 252 (0.2%)
- Trinidadian and Tobagonian: 252 (0.2%)
- Brazilian: 245 (0.2%)
- Nigerian: 245 (0.2%)
- Croatian: 218 (0.2%)
- Czech: 196 (0.1%)
- Austrian: 184 (0.1%)
- West Indian: 175 (0.1%)
- Moroccan: 165 (0.1%)
- Romanian: 162 (0.1%)
- Scandinavian: 147 (0.1%)
- Bahamian: 144 (0.1%)
- Danish: 118 (0.09%)
- Latvian: 113 (0.08%)
- Egyptian: 110 (0.08%)
- Czechoslovakian: 100 (0.07%)
- Bulgarian: 98 (0.07%)
- Palestinian: 94 (0.07%)
- Finnish: 93 (0.07%)
- New Zealander: 93 (0.07%)
- Iranian: 93 (0.07%)
- Ghanaian: 83 (0.06%)
- U.S. Virgin Islander: 81 (0.06%)
- Slavic: 72 (0.05%)
- Soviet Union: 58 (0.04%)
- Turkish: 52 (0.04%)
- Luxembourger: 44 (0.03%)
- Pennsylvania German: 44 (0.03%)
- Estonian: 43 (0.03%)
- Cape Verdean: 42 (0.03%)
- South African: 39 (0.03%)
- Australian: 32 (0.02%)
- Afghan: 32 (0.02%)
- Belizean: 31 (0.02%)
- Slovene: 31 (0.02%)
- Guyanese: 28 (0.02%)
- Armenian: 26 (0.02%)
- Iraqi: 25 (0.02%)
- British West Indian: 23 (0.02%)
- Ethiopian: 20 (0.01%)
- Barbadian: 19 (0.01%)
- Jordanian: 14 (0.01%)
- Kenyan: 14 (0.01%)
- Cajun: 12 (0.01%)
Most common places of birth for foreign-born residents (%):
| St. Petersburg: | 8.4% (2,241) |
| Florida: | 5.0% (227,319) |
| St. Petersburg: | 6.7% (1,803) |
| Florida: | 2.4% (109,132) |
| St. Petersburg: | 6.5% (1,745) |
| Florida: | 22.0% (1,006,576) |
| St. Petersburg: | 5.0% (1,344) |
| Florida: | 1.3% (60,604) |
| St. Petersburg: | 4.1% (1,094) |
| Florida: | 1.8% (84,403) |
| St. Petersburg: | 3.8% (1,020) |
| Florida: | 1.2% (54,272) |
| St. Petersburg: | 3.1% (832) |
| Florida: | 5.6% (257,152) |
| St. Petersburg: | 3.1% (818) |
| Florida: | 0.1% (4,073) |
| St. Petersburg: | 2.9% (780) |
| Florida: | 2.1% (94,349) |
| St. Petersburg: | 2.9% (769) |
| Florida: | 5.7% (262,042) |
| St. Petersburg: | 2.3% (603) |
| Florida: | 6.5% (298,669) |
| St. Petersburg: | 2.1% (565) |
| Florida: | 0.1% (3,268) |
| St. Petersburg: | 1.9% (507) |
| Florida: | 2.1% (96,693) |
| St. Petersburg: | 1.9% (503) |
| Florida: | 0.2% (8,695) |
| St. Petersburg: | 1.7% (466) |
| Florida: | 0.4% (20,008) |
| St. Petersburg: | 1.7% (451) |
| Florida: | 7.5% (342,375) |
| St. Petersburg: | 1.5% (411) |
| Florida: | 1.0% (43,642) |
| St. Petersburg: | 1.5% (406) |
| Florida: | 0.8% (37,723) |
Place of birth for U.S.-born residents:
- This state: 102,082
- Other state: 123,958
- Northeast: 45,172
- Midwest: 37,064
- South: 32,165
- West: 9,557
85.3% of St. Petersburg residents lived in the same house 1 years ago.
Out of people who lived in different houses, 29.2% lived in this county.
Out of people who lived in different counties, 43.6% lived in Florida.
| St. Petersburg: | 85.3% |
| State average: | 86.3% |
Education attainment for males 25 years and older:
- No schooling: 1,636
- Nursery to 4th grade: 0
- 5th and 6th grade: 643
- 7th and 8th grade: 249
- 9th grade: 156
- 10th grade: 493
- 11th grade: 1,126
- 12th grade, no diploma: 2,072
- High school graduate (or equivalency): 20,851
- Less than 1 year of college: 6,715
- Some college more than 1 year, no degree: 13,009
- Associate degree: 7,070
- Bachelor's degree: 25,297
- Master's degree: 11,619
- Professional school degree: 3,876
- Doctorate degree: 2,540

Education attainment for females 25 years and older:
- No schooling: 2,095
- Nursery to 4th grade: 215
- 5th and 6th grade: 240
- 7th and 8th grade: 1,699
- 9th grade: 55
- 10th grade: 633
- 11th grade: 701
- 12th grade, no diploma: 2,006
- High school graduate (or equivalency): 23,150
- Less than 1 year of college: 6,209
- Some college more than 1 year, no degree: 12,399
- Associate degree: 10,088
- Bachelor's degree: 26,247
- Master's degree: 12,755
- Professional school degree: 4,258
- Doctorate degree: 2,382


Housing units in structures:
- One, detached: 76,127
- One, attached: 4,896
- Two: 5,270
- 3 or 4: 5,916
- 5 to 9: 9,947
- 10 to 19: 11,045
- 20 to 49: 8,821
- 50 or more: 15,264
- Mobile homes: 3,872
- Boats, RVs, vans, etc.: 99
Median worth of mobile homes: $53,400
Housing units lacking complete kitchen facilities in 2022: 2.3%
House/condo owner moved in on average 9 years ago
Renter moved in on average 2 years ago

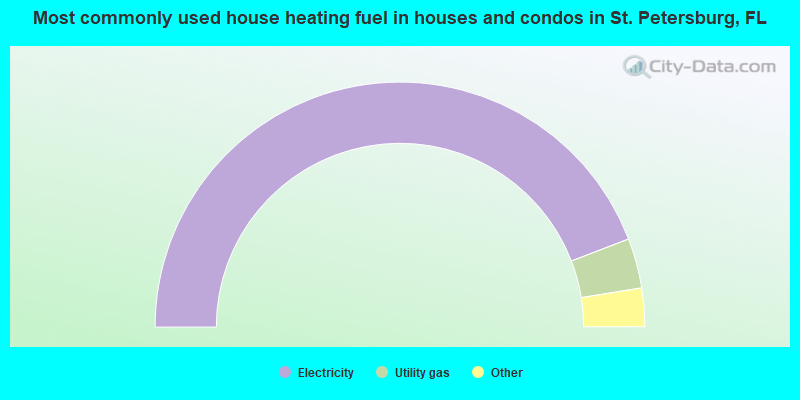
- 88.4%Electricity
- 6.6%Utility gas
- 1.9%No fuel used
- 1.7%Solar energy
- 1.3%Bottled, tank, or LP gas
- 0.1%Fuel oil, kerosene, etc.
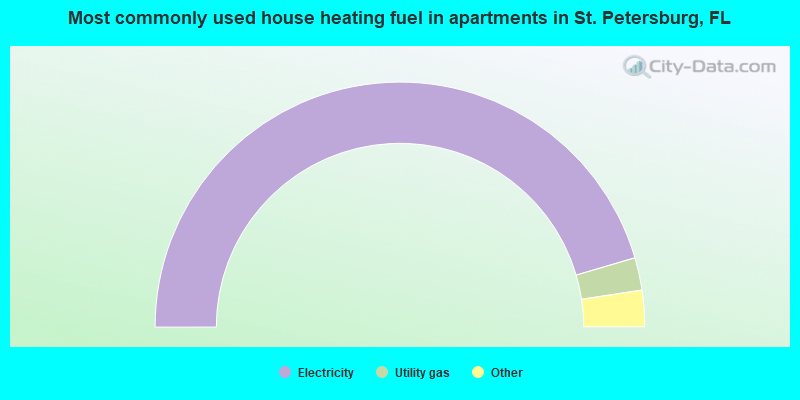
- 90.9%Electricity
- 4.3%Utility gas
- 3.0%No fuel used
- 1.4%Bottled, tank, or LP gas
- 0.2%Other fuel
- 0.1%Wood
Private vs. public school enrollment:
| Here: | 29.8% |
| Florida: | 15.8% |
| Here: | 20.8% |
| Florida: | 12.9% |
| Here: | 33.0% |
| Florida: | 23.6% |


