St. Marys, GA (Georgia) Houses and Residents
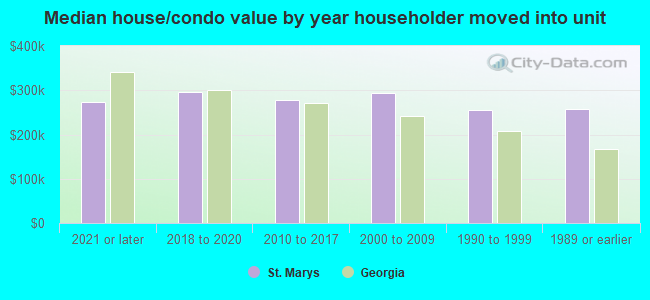
| St. Marys: | $290,748 |
| Georgia: | $297,400 |
Total population: 17,949 (Urban population: 12,060 (all inside urban clusters), Rural population: 1,385 (all nonfarm))
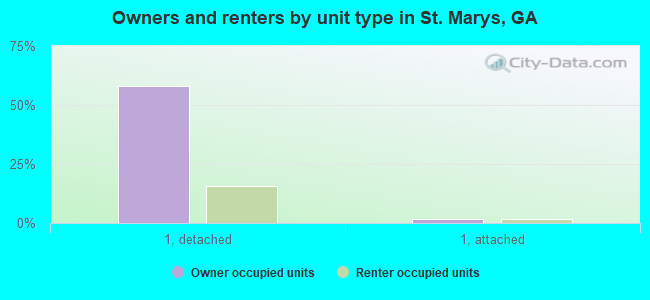
Houses: 8,217 (7,457 occupied: 4,478 owner occupied, 3,063 renter occupied)
| % of renters here: | 41% |
| State: | 34% |
Housing density: 438 houses/condos per square mile
Median price asked for vacant for-sale houses and condos in 2022: $111,236.
Median contract rent in 2022: $1,031 (lower quartile is $747, upper quartile is $1,323)
Median rent asked for vacant for-rent units in 2022: $1,049
Median gross rent in St. Marys, GA in 2022: $1,224
Housing units in St. Marys with a mortgage: 2,985 (220 second mortgage, 0 home equity loan, 154 both second mortgage and home equity loan)
Houses without a mortgage: 30
Median household income for houses/condos with a mortgage: $95,341
Median household income for apartments without a mortgage: $89,876
Median monthly housing costs: $1,169
Compare current foreclosures near St. Marys, GA:
| Photo | Address | Area | Beds / Baths | Price | Details |
|---|---|---|---|---|---|

|
#1
Blue Heron Ln
Fernandina Beach, FL 32034
|
1,757 sq. feet
|
2 baths 3 beds |
show details | |

|
#2
Glenspring Way
Yulee, FL 32097
|
2,974 sq. feet
|
3 baths 4 beds |
show details | |

|
#3
Regatta Dr
Fernandina Beach, FL 32034
|
2,517 sq. feet
|
2 baths 3 beds |
show details | |

|
#4
Jim Ct
Jacksonville, FL 32218
|
1,445 sq. feet
|
2 baths 3 beds |
show details | |

|
#5
Marsh Lakes Ct
Fernandina Beach, FL 32034
|
2,389 sq. feet
|
2 baths 3 beds |
show details | |

|
#6
Dick King Rd
Yulee, FL 32097
|
1,426 sq. feet
|
2 baths 3 beds |
show details | |

|
#7
Great Lakes Cir
Jacksonville, FL 32218
|
2,033 sq. feet
|
3 baths 4 beds |
show details | |

|
#8
Meadowwood Dr
Yulee, FL 32097
|
2,594 sq. feet
|
3 baths 4 beds |
show details | |

|
#9
Vernon St
Fernandina Beach, FL 32034
|
986 sq. feet
|
1 baths 3 beds |
show details | |

|
#10
Fortune Dr
Yulee, FL 32097
|
1,596 sq. feet
|
2 baths 4 beds |
show details |
| Photo | Address | Area | Beds / Baths | Price | Details |
|---|---|---|---|---|---|

|
#11
Blackhawk Trl
Fernandina Beach, FL 32034
|
2,280 sq. feet
|
3 baths 4 beds |
show details | |

|
#12
Saint Paul Blvd
Yulee, FL 32097
|
1,326 sq. feet
|
2 baths 3 beds |
show details | |

|
#13
Lumber Creek Blvd
Yulee, FL 32097
|
1,854 sq. feet
|
2 baths 4 beds |
show details | |

|
#14
Woodbridge Pkwy
Fernandina Beach, FL 32034
|
2,640 sq. feet
|
3 baths 5 beds |
show details | |

|
#15
Grove Park Cir
Fernandina Beach, FL 32034
|
1,504 sq. feet
|
2 baths 3 beds |
show details | |

|
#16
Commodore Point Dr
Yulee, FL 32097
|
1,569 sq. feet
|
2 baths 3 beds |
show details | |

|
#17
Sonoma Dr
Fernandina Beach, FL 32034
|
1,998 sq. feet
|
2 baths 4 beds |
show details | |

|
#18
Petunia Ct
Fernandina Beach, FL 32034
|
1,040 sq. feet
|
2 baths 3 beds |
show details | |

|
#19
Sonoma Dr
Fernandina Beach, FL 32034
|
1,825 sq. feet
|
2 baths 3 beds |
show details | |

|
#20
Beach Wood Rd
Fernandina Beach, FL 32034
|
1,210 sq. feet
|
2 baths 2 beds |
show details |
| Photo | Address | Area | Beds / Baths | Price | Details |
|---|---|---|---|---|---|

|
#21
Worthington Dr
Yulee, FL 32097
|
1,295 sq. feet
|
2 baths 3 beds |
show details | |

|
#22
Bonnie Oaks Dr
Fernandina Beach, FL 32034
|
1,468 sq. feet
|
2 baths 3 beds |
show details | |

|
#23
Dowing Creek Dr
Jacksonville, FL 32218
|
2,252 sq. feet
|
2 baths 4 beds |
show details | |

|
#24
Christopher Ln
Fernandina Beach, FL 32034
|
1,676 sq. feet
|
2 baths 3 beds |
show details | |

|
#25
Red Bass Dr
Jacksonville, FL 32226
|
2,560 sq. feet
|
2 baths 4 beds |
show details | |

|
#26
Mainline Rd
Yulee, FL 32097
|
1,332 sq. feet
|
2 baths 3 beds |
show details | |

|
#27
Lexington Park Blvd
Jacksonville, FL 32218
|
2,852 sq. feet
|
3 baths 4 beds |
show details | |

|
#28
Long Beach Dr
Fernandina Beach, FL 32034
|
1,974 sq. feet
|
2 baths 4 beds |
show details | |

|
#29
Lexington Park Blvd
Jacksonville, FL 32218
|
2,976 sq. feet
|
3 baths 4 beds |
show details | |

|
#30
Norman Ave N
Jacksonville, FL 32218
|
2,108 sq. feet
|
2 baths 4 beds |
show details |
| Photo | Address | Area | Beds / Baths | Price | Details |
|---|---|---|---|---|---|

|
#31
Arrigo Blvd
Fernandina Beach, FL 32034
|
1,936 sq. feet
|
2 baths 3 beds |
show details | |

|
#32
Jim Ct
Jacksonville, FL 32218
|
2,338 sq. feet
|
2 baths 3 beds |
show details | |

|
#33
Bostick Wood Dr
Fernandina Beach, FL 32034
|
3,097 sq. feet
|
2 baths 4 beds |
show details | |

|
#34
Devon Dr
Saint Marys, GA 31558
|
2,220 sq. feet
|
2 baths 4 beds |
show details | |

|
#35
Bainebridge Dr
Jacksonville, FL 32218
|
2,946 sq. feet
|
3 baths 4 beds |
show details | |

|
#36
Lumber Creek Blvd
Yulee, FL 32097
|
1,543 sq. feet
|
2 baths 3 beds |
show details | |

|
#37
Acorn Ln
Fernandina Beach, FL 32034
|
2,310 sq. feet
|
2 baths 4 beds |
show details | |

|
#38
Northside Dr S
Jacksonville, FL 32218
|
2,798 sq. feet
|
3 baths 4 beds |
show details | |

|
#39
Deleene Rd
Yulee, FL 32097
|
2,074 sq. feet
|
2 baths 3 beds |
show details | |

|
#40
Lexington Park Blvd
Jacksonville, FL 32218
|
3,054 sq. feet
|
3 baths 6 beds |
show details |
| Photo | Address | Area | Beds / Baths | Price | Details |
|---|---|---|---|---|---|

|
#41
Twin Creek Dr
Jacksonville, FL 32218
|
2,939 sq. feet
|
2 baths 4 beds |
show details | |

|
#42
Knotted Oak Way
Yulee, FL 32097
|
1,646 sq. feet
|
2 baths 3 beds |
show details | |

|
#43
Evergreen Pl
Yulee, FL 32097
|
1,693 sq. feet
|
2 baths 4 beds |
show details | |

|
#44
Northside Dr E
Jacksonville, FL 32218
|
1,825 sq. feet
|
2 baths 3 beds |
show details | |

|
#45
Paso Fino Dr
Jacksonville, FL 32218
|
2,000 sq. feet
|
2 baths 3 beds |
show details | |

|
#46
Oakhill Church Rd
Kingsland, GA 31548
|
1,560 sq. feet
|
1 baths 3 beds |
show details | |

|
#47
Old Nassauville Rd
Fernandina Beach, FL 32034
|
1,200 sq. feet
|
1 baths 2 beds |
show details | |

|
#48
Duck Blind Way
Woodbine, GA 31569
|
1,966 sq. feet
|
2 baths 3 beds |
show details | |

|
#49
Cartesian Pointe Dr
Yulee, FL 32097
|
1,884 sq. feet
|
2 baths 3 beds |
show details | |

|
Check over 1 million property listings on Foreclosure.com!
|
browse all offers | |||


 | I love the coastal/I-95 region of Georgia (56 replies) |
| St. Marys Situation (3 replies) |
| Moving to St. Marys GA (13 replies) |
| Rezoning approved for possible barge port in St. Marys (1 reply) |
| Columbus, GA Proposed/In-Progress/Completed Projects (2920 replies) |
| Kingsland/St. Marys Area Relocation (28 replies) |

Median year apartment built: 1994
Household type by relationship:
Households: 18,835- Male householders: 3,614 (883 living alone), Female householders: 3,788 (1,149 living alone)
3,254 spouses (3,214 opposite-sex spouses), 523 unmarried partners, (379 opposite-sex unmarried partners), 5,749 children (5,549 natural, 43 adopted, 155 stepchildren), 543 grandchildren, 379 brothers or sisters, 141 parents, 10 foster children, 213 other relatives, 509 non-relatives
- In group quarters: 107
Size of family households: 2,215 2-persons, 1,512 3-persons, 635 4-persons, 444 5-persons, 73 6-persons, 317 7-or-more-persons.
Size of nonfamily households: 2,039 1-person, 287 2-persons, 26 4-persons, 1 5-persons.
2,219 married couples with children.
1,700 single-parent households (291 men, 1,409 women).
94.7% of residents of St. Marys speak English at home.
2.7% of residents speak Spanish at home (43% speak English very well, 40% speak English well, 17% speak English not well).
1.4% of residents speak other Indo-European language at home (61% speak English very well, 39% speak English well).
0.9% of residents speak Asian or Pacific Island language at home (73% speak English very well, 27% speak English well).
0.1% of residents speak other language at home (50% speak English very well, 50% speak English well).
Foreign born population: 630 (3.3%)
(57.3% of them are naturalized citizens)
| Here: | 6.7 |
| State: | 6.8 |
| Here: | 5.0 |
| State: | 4.6 |
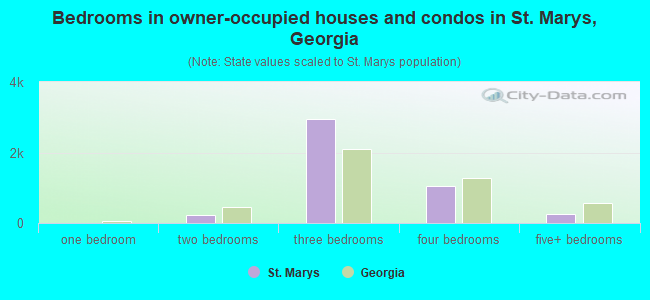
- Bedrooms in owner-occupied houses and condos in St. Marys, Georgia
- 0no bedroom
- 01 bedroom
- 2222 bedrooms
- 2,9633 bedrooms
- 1,0504 bedrooms
- 2445+ bedrooms
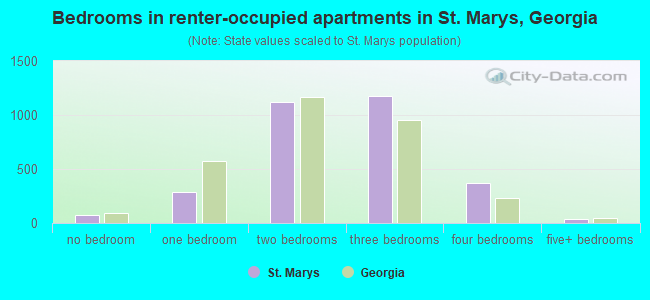
- Bedrooms in renter-occupied apartments in St. Marys, Georgia
- 74no bedroom
- 2891 bedroom
- 1,1172 bedrooms
- 1,1793 bedrooms
- 3674 bedrooms
- 375+ bedrooms
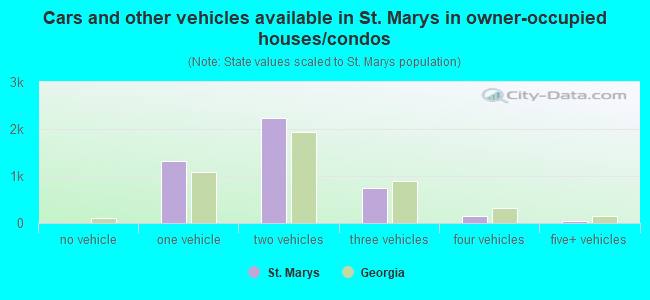
- Cars and other vehicles available in St. Marys in owner-occupied houses/condos
- 0no vehicle
- 1,3241 vehicle
- 2,2262 vehicles
- 7443 vehicles
- 1424 vehicles
- 435+ vehicles
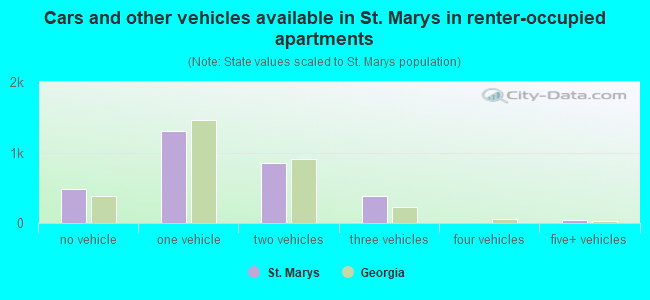
- Cars and other vehicles available in St. Marys in renter-occupied apartments
- 483no vehicle
- 1,3101 vehicle
- 8522 vehicles
- 3813 vehicles
- 04 vehicles
- 375+ vehicles
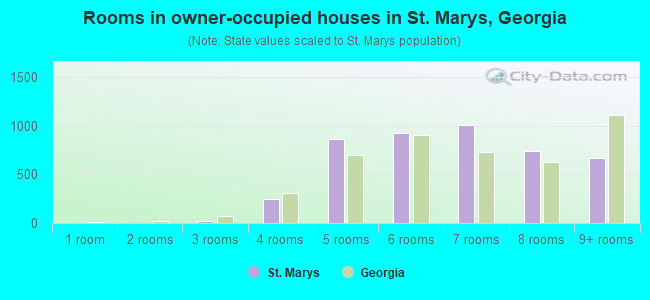
- Rooms in owner-occupied houses in St. Marys, Georgia
- 01 room
- 02 rooms
- 193 rooms
- 2464 rooms
- 8655 rooms
- 9306 rooms
- 1,0047 rooms
- 7428 rooms
- 6739+ rooms
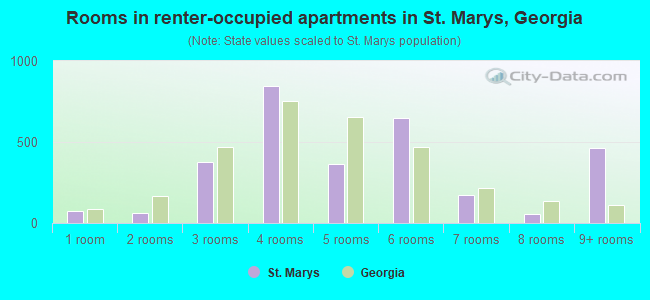
- Rooms in renter-occupied apartments in St. Marys, Georgia
- 741 room
- 632 rooms
- 3763 rooms
- 8474 rooms
- 3645 rooms
- 6476 rooms
- 1747 rooms
- 558 rooms
- 4629+ rooms
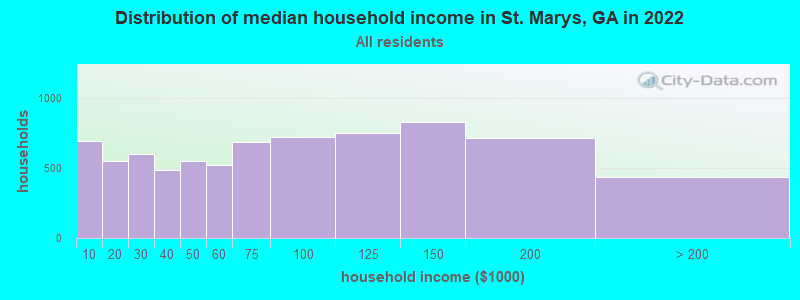
St. Marys, GA household income distribution

- 693Less than $10,000
- 552$10,000 to $19,999
- 601$20,000 to $29,999
- 488$30,000 to $39,999
- 553$40,000 to $49,999
- 521$50,000 to $59,999
- 687$60,000 to $74,999
- 718$75,000 to $99,999
- 748$100,000 to $124,999
- 828$125,000 to $149,999
- 712$150,000 to $199,999
- 432$200,000 or more
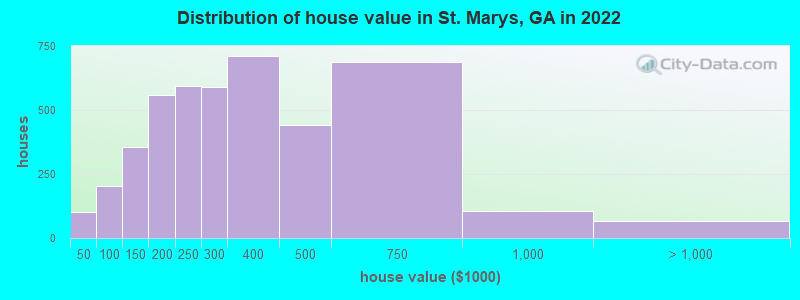
Home value of owner - occupied houses in 2022 in St. Marys, GA
-
- 76Less than $10,000
- 5$25,000 to $29,999
- 20$40,000 to $49,999
- 12$60,000 to $69,999
- 54$70,000 to $79,999
- 50$80,000 to $89,999
- 65$90,000 to $99,999
- 127$100,000 to $124,999
- 229$125,000 to $149,999
- 298$150,000 to $174,999
- 260$175,000 to $199,999
- 593$200,000 to $249,999
- 587$250,000 to $299,999
- 710$300,000 to $399,999
- 440$400,000 to $499,999
- 687$500,000 to $749,999
- 103$750,000 to $999,999
- 64$1,000,000 to $1,499,999
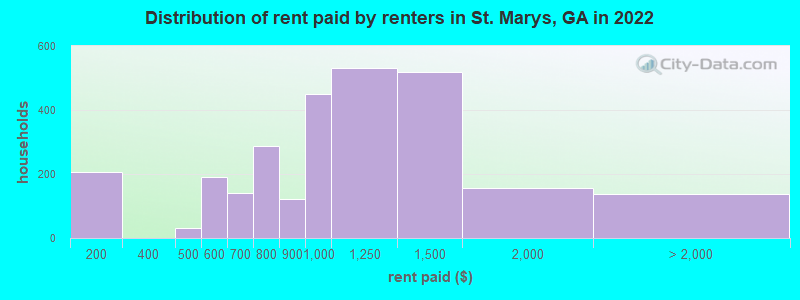
Rent paid by renters in 2022 in St. Marys, GA
-
- 25$100 to $149
- 180$150 to $199
- 31$400 to $449
- 111$500 to $549
- 79$550 to $599
- 82$600 to $649
- 59$650 to $699
- 210$700 to $749
- 77$750 to $799
- 122$800 to $899
- 449$900 to $999
- 529$1,000 to $1,249
- 519$1,250 to $1,499
- 155$1,500 to $1,999
- 7$2,500 to $2,999
- 129No cash rent
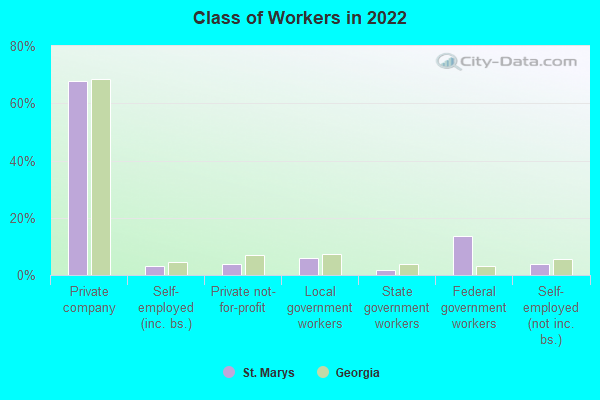
Percentage of workers working in this county: 74.7%
Number of people working at home: 996 (12.4% of all workers)
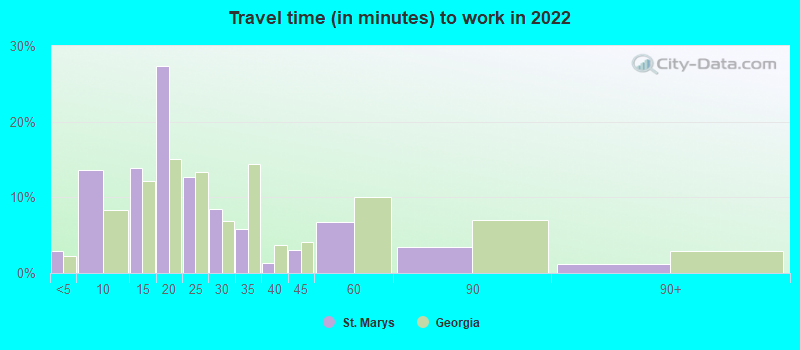
Travel time to work (commute)
- Less than 5 minutes: 151
- 5 to 9 minutes: 1,024
- 10 to 14 minutes: 1,277
- 15 to 19 minutes: 1,497
- 20 to 24 minutes: 801
- 25 to 29 minutes: 261
- 30 to 34 minutes: 343
- 35 to 39 minutes: 50
- 40 to 44 minutes: 155
- 45 to 59 minutes: 947
- 60 to 89 minutes: 313
- 90 or more minutes: 139
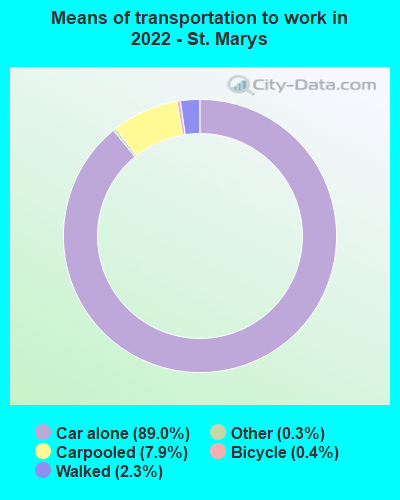
Means of transportation to work:
- Drove a car alone: 5,338 (75.7%)
- Carpooled: 497 (7.1%)
- Taxi: 22 (0.3%)
- Bicycle: 21 (0.3%)
- Walked: 146 (2.1%)
- Worked at home: 996 (14.1%)
- Unemployment by race in 2022
- Unemployment rate for White non-Hispanic residents
- 2.3%Males
- 3.4%Females
- Unemployment rate for Black residents
- 4.5%Males
- 38.6%Females
- Unemployment rate for two or more race residents
- 1.6%Males
- Unemployment rate for Hispanic or Latino residents
- 25.3%Males
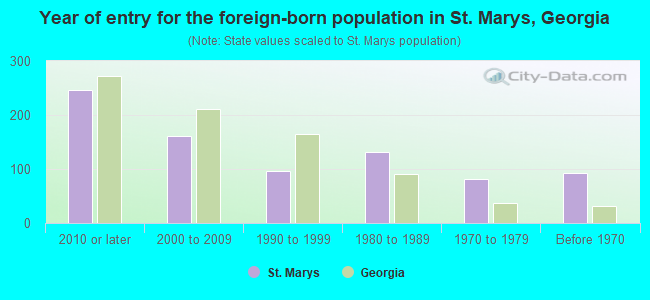
- Year of entry for the foreign-born population in St. Marys, Georgia
- 2472010 or later
- 1612000 to 2009
- 961990 to 1999
- 1321980 to 1989
- 811970 to 1979
- 92Before 1970
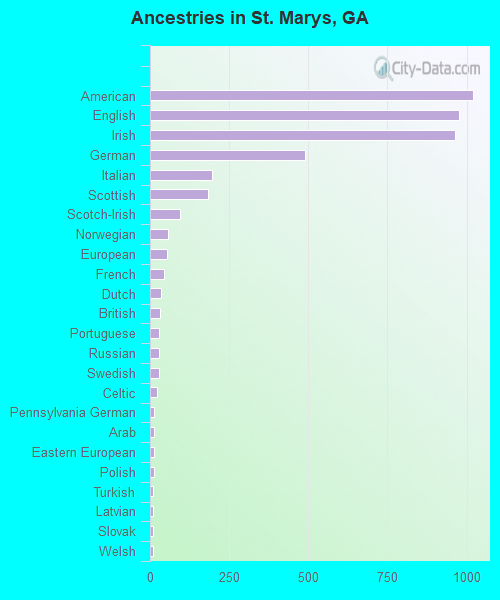
First ancestries reported:
- American: 1,020 (13.0%)
- English: 975 (12.4%)
- Irish: 964 (12.3%)
- German: 490 (6.3%)
- Italian: 195 (2.5%)
- Scottish: 183 (2.3%)
- Scotch-Irish: 96 (1.2%)
- Norwegian: 56 (0.7%)
- European: 53 (0.7%)
- French: 45 (0.6%)
- Dutch: 34 (0.4%)
- British: 32 (0.4%)
- Portuguese: 27 (0.3%)
- Russian: 27 (0.3%)
- Swedish: 27 (0.3%)
- Celtic: 23 (0.3%)
- Pennsylvania German: 14 (0.2%)
- Arab: 12 (0.2%)
- Eastern European: 12 (0.2%)
- Polish: 12 (0.2%)
- Turkish: 11 (0.1%)
- Latvian: 10 (0.1%)
- Slovak: 10 (0.1%)
- Welsh: 10 (0.1%)
- Northern European: 8 (0.1%)
- Swiss: 8 (0.1%)
- Czechoslovakian: 7 (0.09%)
- French Canadian: 6 (0.08%)
- Austrian: 5 (0.06%)
- Ukrainian: 2 (0.03%)
- Ethiopian: 1 (0.01%)
Most common places of birth for foreign-born residents (%):
| St. Marys: | 21.7% (137) |
| Georgia: | 20.0% (223,400) |
| St. Marys: | 14.4% (91) |
| Georgia: | 1.8% (20,700) |
| St. Marys: | 14.0% (88) |
| Georgia: | 0.8% (8,684) |
| St. Marys: | 9.8% (62) |
| Georgia: | 9.2% (103,325) |
| St. Marys: | 7.5% (47) |
| Georgia: | 0.1% (1,124) |
| St. Marys: | 5.7% (36) |
| Georgia: | 0.1% (792) |
| St. Marys: | 5.7% (36) |
| Georgia: | 1.2% (12,946) |
| St. Marys: | 4.0% (25) |
| Georgia: | 0.8% (9,101) |
| St. Marys: | 2.9% (18) |
| Georgia: | 0.3% (2,996) |
| St. Marys: | 2.4% (15) |
| Georgia: | 0.2% (1,911) |
| St. Marys: | 2.2% (14) |
| Georgia: | 0.2% (2,261) |
| St. Marys: | 1.7% (11) |
| Georgia: | 0.4% (4,387) |
Place of birth for U.S.-born residents:
- This state: 5,525
- Other state: 12,503
- Northeast: 2,411
- Midwest: 2,182
- South: 6,795
- West: 1,108
85.6% of St. Marys residents lived in the same house 1 years ago.
Out of people who lived in different houses, 29.7% lived in this county.
Out of people who lived in different counties, 18.3% lived in Georgia.
| St. Marys: | 85.6% |
| State average: | 86.6% |
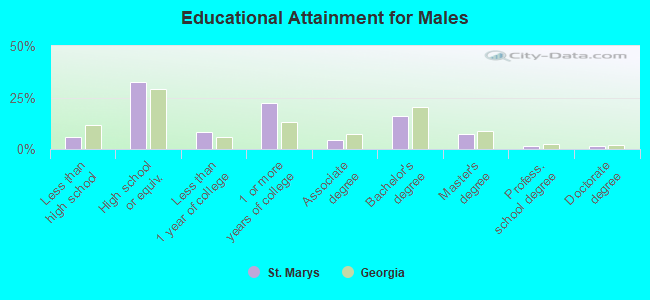
Education attainment for males 25 years and older:
- No schooling: 82
- Nursery to 4th grade: 0
- 5th and 6th grade: 33
- 7th and 8th grade: 0
- 9th grade: 5
- 10th grade: 83
- 11th grade: 10
- 12th grade, no diploma: 123
- High school graduate (or equivalency): 1,892
- Less than 1 year of college: 490
- Some college more than 1 year, no degree: 1,293
- Associate degree: 264
- Bachelor's degree: 940
- Master's degree: 409
- Professional school degree: 80
- Doctorate degree: 77
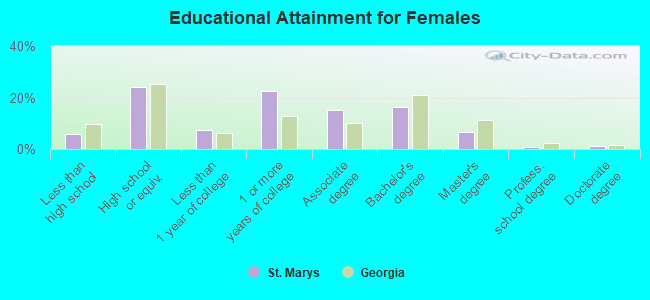
Education attainment for females 25 years and older:
- No schooling: 62
- Nursery to 4th grade: 10
- 5th and 6th grade: 20
- 7th and 8th grade: 0
- 9th grade: 6
- 10th grade: 128
- 11th grade: 55
- 12th grade, no diploma: 82
- High school graduate (or equivalency): 1,537
- Less than 1 year of college: 475
- Some college more than 1 year, no degree: 1,436
- Associate degree: 968
- Bachelor's degree: 1,050
- Master's degree: 417
- Professional school degree: 57
- Doctorate degree: 71


Housing units in structures:
- One, detached: 5,955
- One, attached: 252
- Two: 66
- 3 or 4: 324
- 5 to 9: 570
- 10 to 19: 172
- 20 to 49: 144
- 50 or more: 231
- Mobile homes: 427
- Boats, RVs, vans, etc.: 72
Housing units lacking complete kitchen facilities in 2022: 2.4%
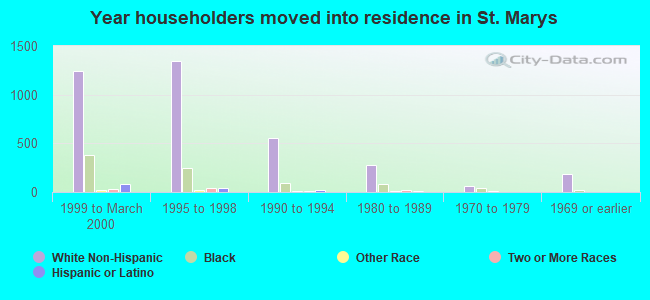
House/condo owner moved in on average 8 years ago
Renter moved in on average 2 years ago
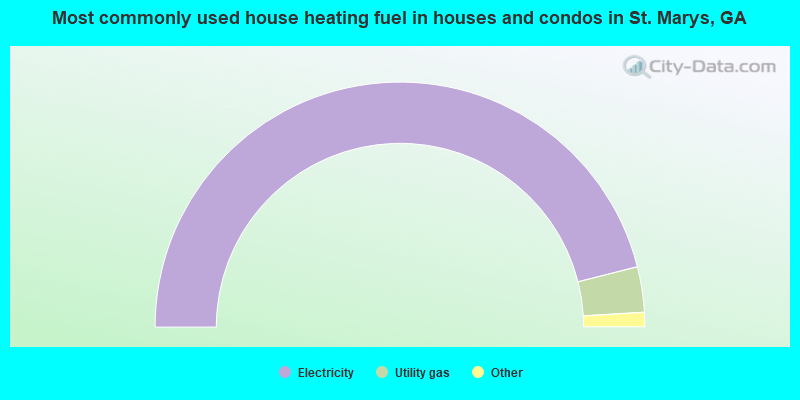
- 92.2%Electricity
- 6.0%Utility gas
- 1.0%Bottled, tank, or LP gas
- 0.6%No fuel used
- 0.2%Fuel oil, kerosene, etc.
- 0.1%Wood
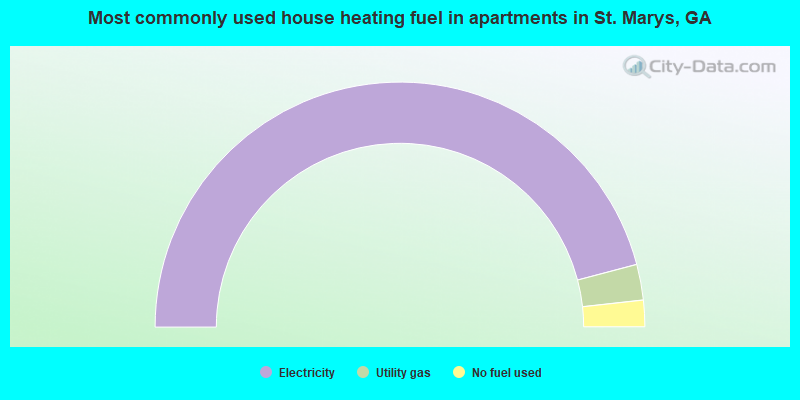
- 91.8%Electricity
- 4.7%Utility gas
- 3.5%No fuel used
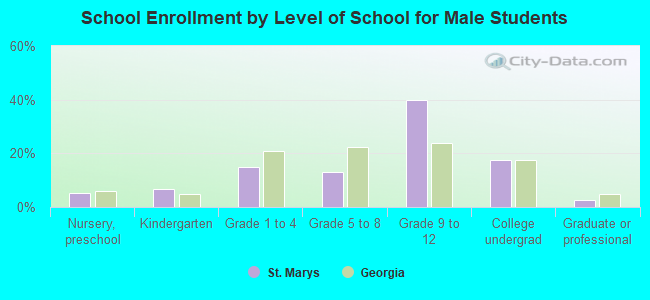
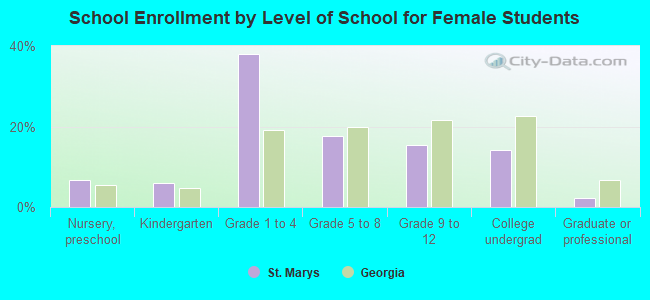
Private vs. public school enrollment:
| Here: | 3.9% |
| Georgia: | 12.1% |
| Here: | 0.7% |
| Georgia: | 10.8% |
| Here: | 16.1% |
| Georgia: | 17.1% |