South Salt Lake, UT (Utah) Houses and Residents
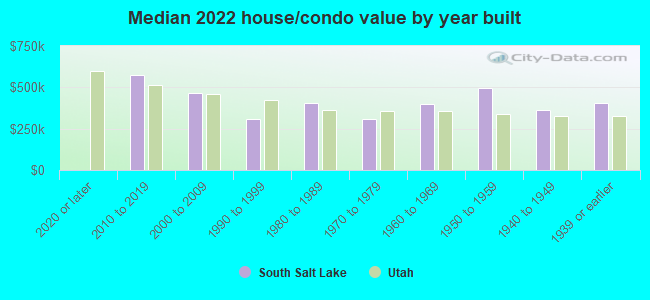
| South Salt Lake: | $430,197 |
| Utah: | $499,500 |
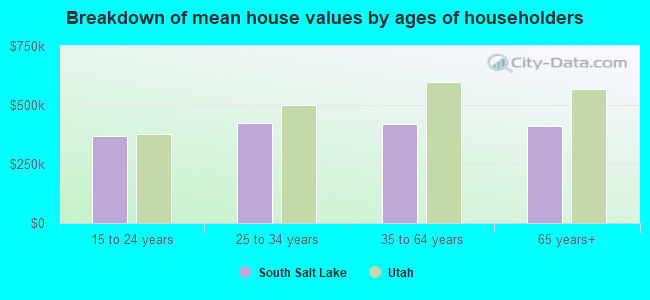
Mean price in 2022:
Detached houses: $394,263
Here: $394,263 State: $607,750 Townhouses or other attached units: $389,511
Here: $389,511 State: $444,505 In 2-unit structures: $679,513
Here: $679,513 State: $433,540 In 3-to-4-unit structures: $287,674
Here: $287,674 State: $362,850 In 5-or-more-unit structures: $174,836
Here: $174,836 State: $412,810 Mobile homes: $39,815
Here: $39,815 State: $113,475
Total population: 24,748 (Urban population: 22,153, Rural population: 0)
Houses: 12,145 (11,100 occupied: 4,330 owner occupied, 6,701 renter occupied)
| % of renters here: | 61% |
| State: | 29% |
Housing density: 1,758 houses/condos per square mile
Median price asked for vacant for-sale houses and condos in 2022: $608,671.
Median contract rent in 2022: $1,129 (lower quartile is $855, upper quartile is $1,474)
Median rent asked for vacant for-rent units in 2022: $1,728
Median gross rent in South Salt Lake, UT in 2022: $1,229
Housing units in South Salt Lake with a mortgage: 3,281 (233 second mortgage, 0 home equity loan, 213 both second mortgage and home equity loan)
Houses without a mortgage: 53
Median household income for houses/condos with a mortgage: $90,518
Median household income for apartments without a mortgage: $67,451
Median monthly housing costs: $1,265
Compare current foreclosures near South Salt Lake, UT:
| Photo | Address | Area | Beds / Baths | Price | Details |
|---|---|---|---|---|---|

|
#1
E Downington Ave
Salt Lake City, UT 84108
|
2,580 sq. feet
|
2 baths 1 beds |
$949,900
|
show details |

|
#2
S Holladay Cir
Salt Lake City, UT 84117
|
2,440 sq. feet
|
2 baths 4 beds |
$799,900
|
show details |

|
#3
E Montego Pl
Salt Lake City, UT 84117
|
896 sq. feet
|
1 baths 2 beds |
show details | |

|
#4
W Pentenwell Ln
South Jordan, UT 84095
|
1,773 sq. feet
|
4 baths 4 beds |
show details | |

|
#5
S Cheryl St
Salt Lake City, UT 84119
|
2,135 sq. feet
|
2 baths 5 beds |
show details | |

|
#6
E 7200 S
Salt Lake City, UT 84121
|
1,160 sq. feet
|
2 baths 3 beds |
show details | |

|
#7
W Homestead Farms Ln Apt 4
Salt Lake City, UT 84119
|
1,337 sq. feet
|
2 baths 3 beds |
show details | |

|
#8
W 12730 S
Riverton, UT 84065
|
1,610 sq. feet
|
2 baths 3 beds |
show details | |

|
#9
E 1700 S
Salt Lake City, UT 84105
|
2,417 sq. feet
|
3 baths 3 beds |
show details | |

|
#10
E Sand Dollar Dr
Sandy, UT 84094
|
2,213 sq. feet
|
4 baths 5 beds |
show details |
| Photo | Address | Area | Beds / Baths | Price | Details |
|---|---|---|---|---|---|

|
#11
Hopi Cir
West Jordan, UT 84081
|
996 sq. feet
|
2 baths 4 beds |
show details | |

|
#12
S Mountain View Blvd
Woods Cross, UT 84087
|
2,417 sq. feet
|
2 baths 3 beds |
show details | |

|
#13
W Grevillea Ln
West Jordan, UT 84081
|
1,570 sq. feet
|
3 baths 3 beds |
show details | |

|
#14
W Arapahoe Ave
Salt Lake City, UT 84104
|
868 sq. feet
|
1 baths 3 beds |
show details | |

|
#15
Sandy Creek Dr
Sandy, UT 84094
|
1,000 sq. feet
|
2 baths 3 beds |
show details | |

|
#16
S Ewell Dr
Salt Lake City, UT 84107
|
1,272 sq. feet
|
1 baths 3 beds |
show details | |

|
#17
W 6960 S
West Jordan, UT 84081
|
1,612 sq. feet
|
3 baths 3 beds |
show details | |

|
#18
S Mountain Aura Dr
West Jordan, UT 84081
|
1,244 sq. feet
|
2 baths 3 beds |
show details | |

|
#19
S 1900 E
Salt Lake City, UT 84108
|
1,616 sq. feet
|
2 baths 3 beds |
show details | |

|
#20
W Daybreak Rim Way
South Jordan, UT 84095
|
1,308 sq. feet
|
3 baths 2 beds |
show details |
| Photo | Address | Area | Beds / Baths | Price | Details |
|---|---|---|---|---|---|

|
#21
W Miriam Way
Magna, UT 84044
|
912 sq. feet
|
2 baths 4 beds |
show details | |

|
#22
W Euclid Ave
Salt Lake City, UT 84104
|
1,200 sq. feet
|
2 baths 3 beds |
show details | |

|
#23
S 4340 W
Salt Lake City, UT 84118
|
1,176 sq. feet
|
2 baths 3 beds |
show details | |

|
#24
E Walker Ln
Salt Lake City, UT 84117
|
6,954 sq. feet
|
4 baths 4 beds |
show details | |

|
#25
E Kennedy Dr Apt 411
Salt Lake City, UT 84108
|
1,609 sq. feet
|
2 baths 2 beds |
show details | |

|
#26
W Telegraph Hill Dr
Salt Lake City, UT 84123
|
770 sq. feet
|
1 baths 2 beds |
show details | |

|
#27
W 5215 S
Salt Lake City, UT 84118
|
1,443 sq. feet
|
1 baths 3 beds |
show details | |

|
#28
S Oak Meadows Dr Apt 31
Salt Lake City, UT 84123
|
662 sq. feet
|
1 baths 1 beds |
show details | |

|
#29
W Sugar Bowl Ln
Salt Lake City, UT 84128
|
1,201 sq. feet
|
3 baths 4 beds |
show details | |

|
#30
W Countrywood Ln
West Jordan, UT 84088
|
1,375 sq. feet
|
2 baths 4 beds |
show details |
| Photo | Address | Area | Beds / Baths | Price | Details |
|---|---|---|---|---|---|

|
#31
S 500 E
Salt Lake City, UT 84105
|
1,500 sq. feet
|
4 baths 8 beds |
show details | |

|
#32
S 900 E Apt 1
Salt Lake City, UT 84121
|
860 sq. feet
|
1 baths 2 beds |
show details | |

|
#33
E Herbert Ave
Salt Lake City, UT 84108
|
2,328 sq. feet
|
4 baths 5 beds |
show details | |

|
#34
S Sorrento Way
West Jordan, UT 84081
|
1,332 sq. feet
|
2 baths 4 beds |
show details | |

|
#35
W 5585 S
Salt Lake City, UT 84129
|
844 sq. feet
|
2 baths 3 beds |
show details | |

|
#36
S Junction Cir
Draper, UT 84020
|
2,190 sq. feet
|
4 baths 6 beds |
show details | |

|
#37
S Caledonia Cir
South Jordan, UT 84095
|
1,587 sq. feet
|
4 baths 4 beds |
show details | |

|
#38
W Graymalkin Cir
South Jordan, UT 84095
|
4,436 sq. feet
|
2 baths 5 beds |
show details | |

|
#39
S Meadowlark Ln
West Jordan, UT 84088
|
1,748 sq. feet
|
2 baths 3 beds |
show details | |

|
#40
E Suada Dr
Salt Lake City, UT 84124
|
2,610 sq. feet
|
3 baths 5 beds |
show details |
| Photo | Address | Area | Beds / Baths | Price | Details |
|---|---|---|---|---|---|

|
#41
W Tytus Dr
Salt Lake City, UT 84107
|
2,005 sq. feet
|
3 baths 3 beds |
show details | |

|
#42
S 4620 W
Salt Lake City, UT 84118
|
1,002 sq. feet
|
1 baths 3 beds |
show details | |

|
#43
S 4460 W
Salt Lake City, UT 84118
|
1,002 sq. feet
|
1 baths 3 beds |
show details | |

|
#44
S Rubicon Rd
South Jordan, UT 84095
|
1,657 sq. feet
|
3 baths 3 beds |
show details | |

|
#45
N Redwood Rd
Salt Lake City, UT 84116
|
1,200 sq. feet
|
1 baths 3 beds |
show details | |

|
#46
Discovery Ct
West Jordan, UT 84081
|
1,297 sq. feet
|
3 baths 4 beds |
show details | |

|
#47
W 4955 S
Salt Lake City, UT 84118
|
1,624 sq. feet
|
2 baths 4 beds |
show details | |

|
#48
S 8650 W
Magna, UT 84044
|
895 sq. feet
|
2 baths 3 beds |
show details | |

|
#49
Birmingham Ln
North Salt Lake, UT 84054
|
1,074 sq. feet
|
2 baths 2 beds |
show details | |

|
Check over 1 million property listings on Foreclosure.com!
|
browse all offers | |||


 | Apartments in Demand, Rents are Soaring (14 replies) |
| Best apartments in SLC metro for $1000 or less? (3 replies) |
| Worst apartment hunting experience I've ever had. (19 replies) |
| Relocating to SLC in late fall (9 replies) |
| Another Moving thread...Denver to Lehi (14 replies) |
| First visit since 2015 (15 replies) |
Median year apartment built: 1983
Household type by relationship:
Households: 26,440- Male householders: 5,980 (2,106 living alone), Female householders: 4,670 (1,842 living alone)
3,357 spouses (3,296 opposite-sex spouses), 949 unmarried partners, (872 opposite-sex unmarried partners), 6,280 children (5,766 natural, 51 adopted, 463 stepchildren), 400 grandchildren, 839 brothers or sisters, 585 parents, 0 foster children, 475 other relatives, 1,576 non-relatives
- In group quarters: 1,323
Size of family households: 2,539 2-persons, 1,463 3-persons, 767 4-persons, 510 5-persons, 222 6-persons, 184 7-or-more-persons.
Size of nonfamily households: 3,995 1-person, 1,110 2-persons, 99 3-persons, 152 4-persons, 28 7-or-more-persons.
2,784 married couples with children.
1,496 single-parent households (413 men, 1,083 women).
66.9% of residents of South Salt Lake speak English at home.
22.0% of residents speak Spanish at home (54% speak English very well, 27% speak English well, 16% speak English not well, 3% don't speak English at all).
7.2% of residents speak other Indo-European language at home (75% speak English very well, 11% speak English well, 12% speak English not well, 2% don't speak English at all).
2.8% of residents speak Asian or Pacific Island language at home (49% speak English very well, 29% speak English well, 20% speak English not well, 2% don't speak English at all).
1.0% of residents speak other language at home (64% speak English very well, 18% speak English well, 18% speak English not well).
Foreign born population: 6,171 (23.3%)
(43.3% of them are naturalized citizens)
| Here: | 5.6 |
| State: | 7.6 |
| Here: | 3.8 |
| State: | 4.3 |
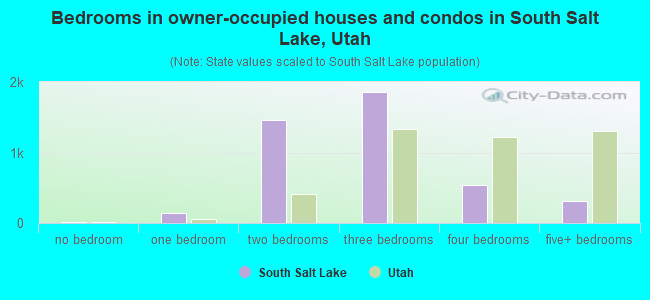
- Bedrooms in owner-occupied houses and condos in South Salt Lake, Utah
- 18no bedroom
- 1461 bedroom
- 1,4582 bedrooms
- 1,8593 bedrooms
- 5344 bedrooms
- 3165+ bedrooms
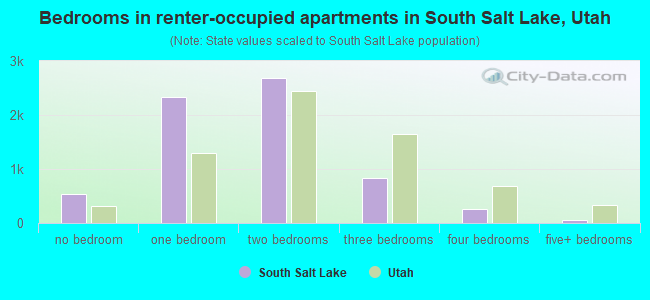
- Bedrooms in renter-occupied apartments in South Salt Lake, Utah
- 546no bedroom
- 2,3251 bedroom
- 2,6792 bedrooms
- 8343 bedrooms
- 2644 bedrooms
- 535+ bedrooms
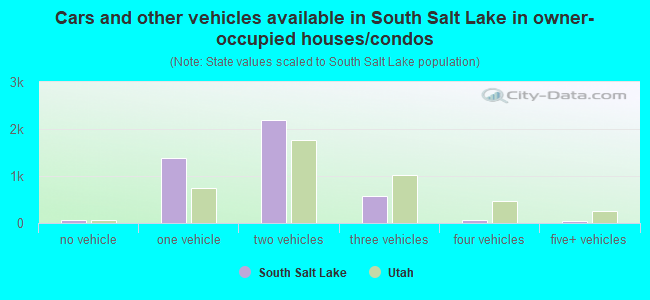
- Cars and other vehicles available in South Salt Lake in owner-occupied houses/condos
- 72no vehicle
- 1,3771 vehicle
- 2,2022 vehicles
- 5763 vehicles
- 674 vehicles
- 375+ vehicles
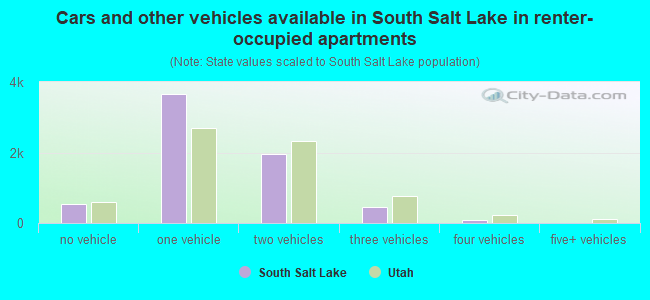
- Cars and other vehicles available in South Salt Lake in renter-occupied apartments
- 539no vehicle
- 3,6551 vehicle
- 1,9492 vehicles
- 4623 vehicles
- 884 vehicles
- 75+ vehicles
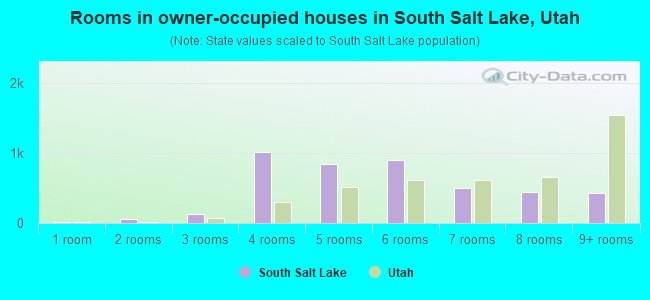
- Rooms in owner-occupied houses in South Salt Lake, Utah
- 181 room
- 582 rooms
- 1243 rooms
- 1,0144 rooms
- 8455 rooms
- 8966 rooms
- 5087 rooms
- 4448 rooms
- 4249+ rooms
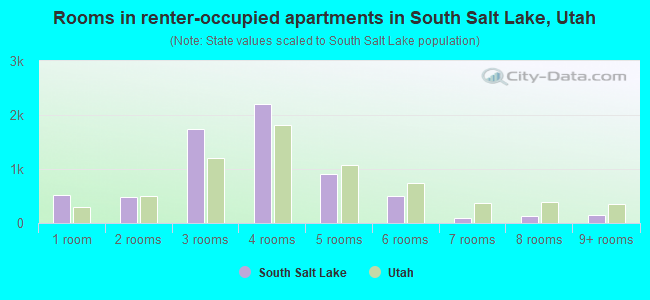
- Rooms in renter-occupied apartments in South Salt Lake, Utah
- 5131 room
- 4772 rooms
- 1,7393 rooms
- 2,1954 rooms
- 9155 rooms
- 4936 rooms
- 917 rooms
- 1348 rooms
- 1459+ rooms
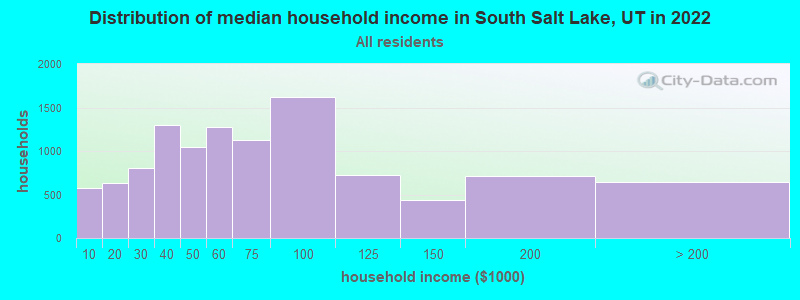
South Salt Lake, UT household income distribution

- 578Less than $10,000
- 633$10,000 to $19,999
- 801$20,000 to $29,999
- 1,297$30,000 to $39,999
- 1,049$40,000 to $49,999
- 1,277$50,000 to $59,999
- 1,128$60,000 to $74,999
- 1,624$75,000 to $99,999
- 727$100,000 to $124,999
- 435$125,000 to $149,999
- 707$150,000 to $199,999
- 645$200,000 or more
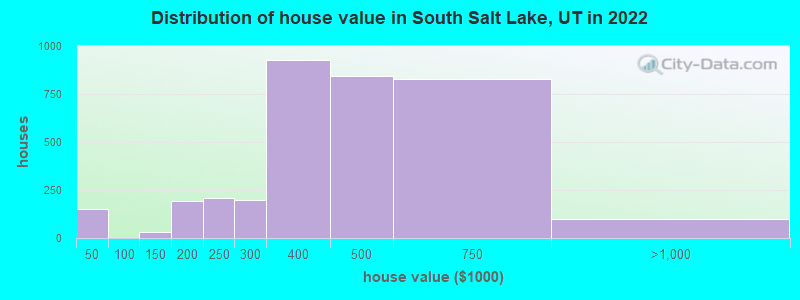
Home value of owner - occupied houses in 2022 in South Salt Lake, UT
-
- 40Less than $10,000
- 7$10,000 to $14,999
- 7$25,000 to $29,999
- 97$35,000 to $39,999
- 29$125,000 to $149,999
- 103$150,000 to $174,999
- 89$175,000 to $199,999
- 208$200,000 to $249,999
- 200$250,000 to $299,999
- 925$300,000 to $399,999
- 843$400,000 to $499,999
- 827$500,000 to $749,999
- 98$750,000 to $999,999
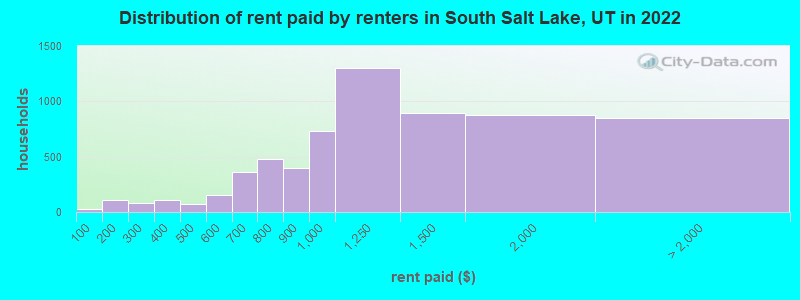
Rent paid by renters in 2022 in South Salt Lake, UT
-
- 27Less than $100
- 105$100 to $149
- 48$200 to $249
- 30$250 to $299
- 10$300 to $349
- 98$350 to $399
- 4$400 to $449
- 70$450 to $499
- 24$500 to $549
- 133$550 to $599
- 320$600 to $649
- 43$650 to $699
- 157$700 to $749
- 324$750 to $799
- 401$800 to $899
- 731$900 to $999
- 1,297$1,000 to $1,249
- 896$1,250 to $1,499
- 878$1,500 to $1,999
- 469$2,000 to $2,499
- 43$2,500 to $2,999
- 336No cash rent
Percentage of workers working in this county: 92.3%
Number of people working at home: 1,831 (11.9% of all workers)
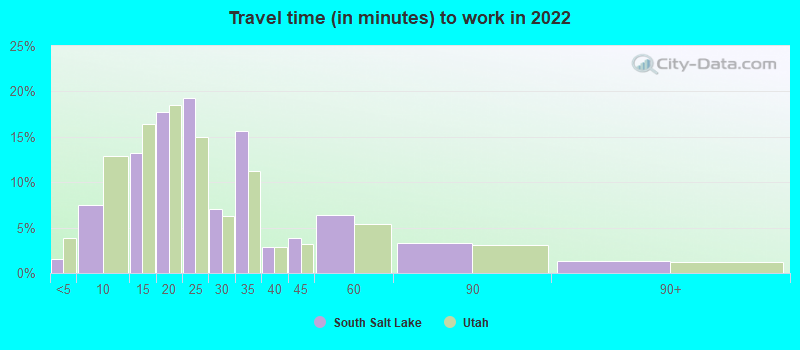
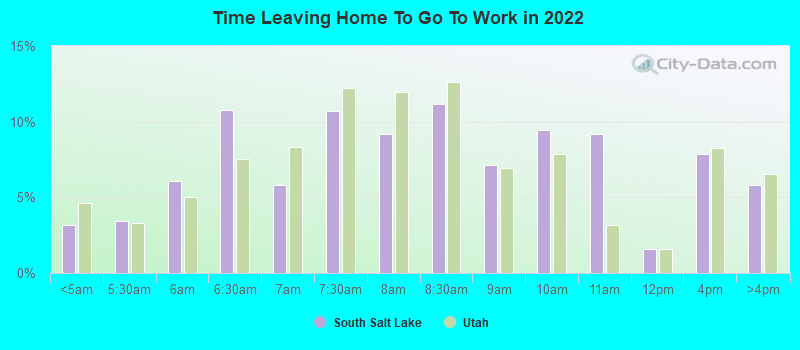
Travel time to work (commute)
- Less than 5 minutes: 528
- 5 to 9 minutes: 1,488
- 10 to 14 minutes: 2,290
- 15 to 19 minutes: 2,723
- 20 to 24 minutes: 2,399
- 25 to 29 minutes: 1,219
- 30 to 34 minutes: 1,253
- 35 to 39 minutes: 202
- 40 to 44 minutes: 305
- 45 to 59 minutes: 484
- 60 to 89 minutes: 220
- 90 or more minutes: 128
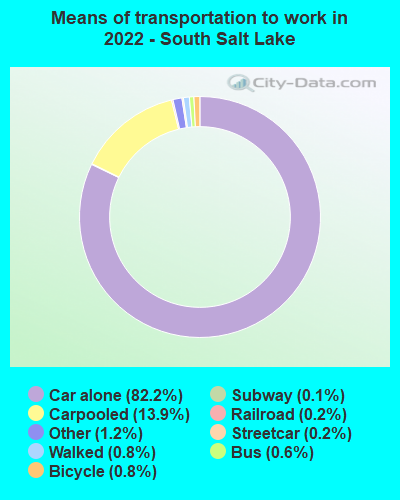
Means of transportation to work:
- Drove a car alone: 20,936 (74.8%)
- Carpooled: 3,796 (13.6%)
- Bus: 110 (0.4%)
- Subway or elevated rail: 30 (0.1%)
- Long-distance train or commuter rail: 22 (0.1%)
- Light rail, streetcar or trolley: 29 (0.1%)
- Ferryboat: 1 (0.0%)
- Taxi: 318 (1.1%)
- Bicycle: 180 (0.6%)
- Walked: 203 (0.7%)
- Worked at home: 1,831 (6.5%)
- Unemployment by race in 2022
- Unemployment rate for White non-Hispanic residents
- 2.8%Males
- 1.6%Females
- Unemployment rate for Black residents
- 2.2%Males
- 1.1%Females
- Unemployment rate for Asian residents
- 2.1%Males
- 1.0%Females
- Unemployment rate for other race residents
- 0.9%Males
- 2.4%Females
- Unemployment rate for two or more race residents
- 16.6%Males
- 12.0%Females
- Unemployment rate for Hispanic or Latino residents
- 7.4%Males
- 2.9%Females
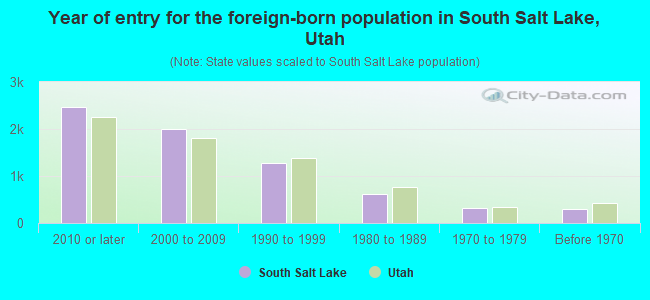
- Year of entry for the foreign-born population in South Salt Lake, Utah
- 2,4762010 or later
- 2,0102000 to 2009
- 1,2841990 to 1999
- 6141980 to 1989
- 3111970 to 1979
- 300Before 1970
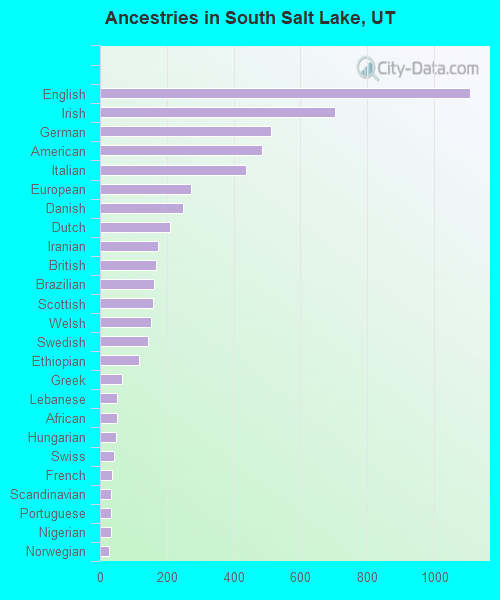
First ancestries reported:
- English: 1,109 (7.0%)
- Irish: 702 (4.4%)
- German: 512 (3.2%)
- American: 485 (3.0%)
- Italian: 437 (2.7%)
- European: 272 (1.7%)
- Danish: 247 (1.6%)
- Dutch: 209 (1.3%)
- Iranian: 174 (1.1%)
- British: 168 (1.1%)
- Brazilian: 162 (1.0%)
- Scottish: 159 (1.0%)
- Welsh: 152 (1.0%)
- Swedish: 144 (0.9%)
- Ethiopian: 117 (0.7%)
- Greek: 67 (0.4%)
- Lebanese: 51 (0.3%)
- African: 50 (0.3%)
- Hungarian: 49 (0.3%)
- Swiss: 43 (0.3%)
- French: 37 (0.2%)
- Scandinavian: 33 (0.2%)
- Portuguese: 32 (0.2%)
- Nigerian: 32 (0.2%)
- Norwegian: 28 (0.2%)
- Somali: 23 (0.1%)
- Finnish: 21 (0.1%)
- Canadian: 21 (0.1%)
- Scotch-Irish: 15 (0.09%)
- Sudanese: 15 (0.09%)
- Liberian: 14 (0.09%)
- Iraqi: 13 (0.08%)
- Basque: 13 (0.08%)
- Polish: 11 (0.07%)
- Yugoslavian: 11 (0.07%)
- Russian: 10 (0.06%)
- Austrian: 10 (0.06%)
- Belgian: 10 (0.06%)
- Armenian: 5 (0.03%)
- Northern European: 5 (0.03%)
- Australian: 4 (0.03%)
- French Canadian: 2 (0.01%)
Most common places of birth for foreign-born residents (%):
| South Salt Lake: | 28.3% (1,767) |
| Utah: | 36.1% (99,740) |
| South Salt Lake: | 10.4% (646) |
| Utah: | 0.2% (519) |
| South Salt Lake: | 5.8% (360) |
| Utah: | 2.9% (7,901) |
| South Salt Lake: | 4.6% (284) |
| Utah: | 0.9% (2,365) |
| South Salt Lake: | 4.5% (282) |
| Utah: | 0.4% (988) |
| South Salt Lake: | 4.4% (272) |
| Utah: | 0.5% (1,315) |
| South Salt Lake: | 4.3% (267) |
| Utah: | 2.9% (8,017) |
| South Salt Lake: | 3.8% (238) |
| Utah: | 2.8% (7,644) |
| South Salt Lake: | 3.2% (198) |
| Utah: | 0.8% (2,137) |
| South Salt Lake: | 2.7% (171) |
| Utah: | 0.2% (528) |
| South Salt Lake: | 2.1% (134) |
| Utah: | 0.4% (1,109) |
| South Salt Lake: | 2.0% (126) |
| Utah: | 0.7% (1,814) |
| South Salt Lake: | 1.9% (118) |
| Utah: | 0.3% (692) |
| South Salt Lake: | 1.7% (108) |
| Utah: | 2.1% (5,902) |
Place of birth for U.S.-born residents:
- This state: 12,313
- Other state: 7,578
- Northeast: 804
- Midwest: 1,474
- South: 1,307
- West: 3,986
75.2% of South Salt Lake residents lived in the same house 1 years ago.
Out of people who lived in different houses, 42.0% lived in this county.
Out of people who lived in different counties, 36.5% lived in Utah.
| South Salt Lake: | 75.2% |
| State average: | 85.7% |
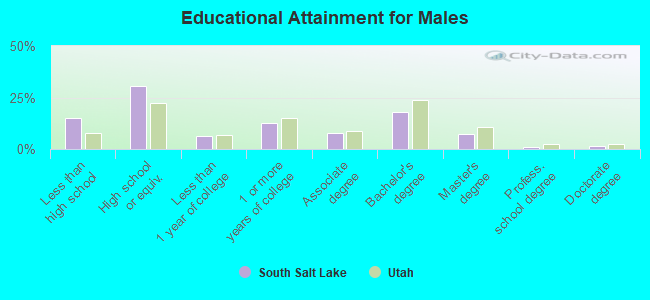
Education attainment for males 25 years and older:
- No schooling: 323
- Nursery to 4th grade: 4
- 5th and 6th grade: 199
- 7th and 8th grade: 52
- 9th grade: 107
- 10th grade: 107
- 11th grade: 233
- 12th grade, no diploma: 412
- High school graduate (or equivalency): 2,923
- Less than 1 year of college: 594
- Some college more than 1 year, no degree: 1,183
- Associate degree: 749
- Bachelor's degree: 1,716
- Master's degree: 670
- Professional school degree: 98
- Doctorate degree: 145
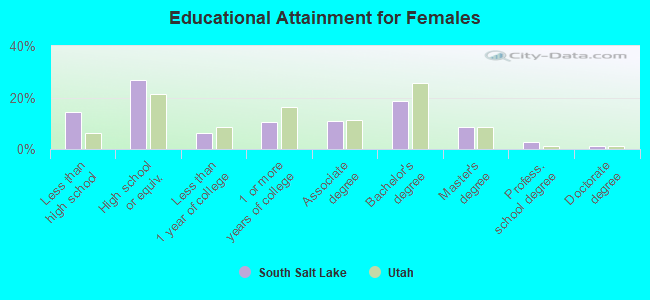
Education attainment for females 25 years and older:
- No schooling: 268
- Nursery to 4th grade: 49
- 5th and 6th grade: 187
- 7th and 8th grade: 207
- 9th grade: 69
- 10th grade: 145
- 11th grade: 69
- 12th grade, no diploma: 167
- High school graduate (or equivalency): 2,141
- Less than 1 year of college: 506
- Some college more than 1 year, no degree: 850
- Associate degree: 868
- Bachelor's degree: 1,491
- Master's degree: 684
- Professional school degree: 220
- Doctorate degree: 88
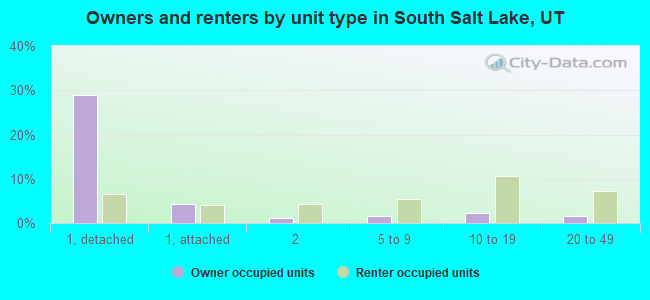
Housing units in structures:
- One, detached: 4,632
- One, attached: 1,096
- Two: 636
- 3 or 4: 777
- 5 to 9: 936
- 10 to 19: 1,416
- 20 to 49: 1,100
- 50 or more: 1,415
- Mobile homes: 78
- Boats, RVs, vans, etc.: 54
Housing units lacking complete kitchen facilities in 2022: 1.3%
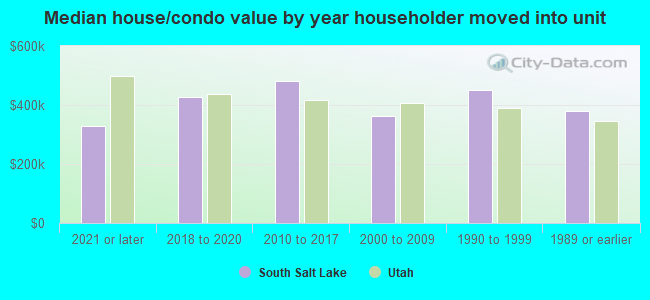
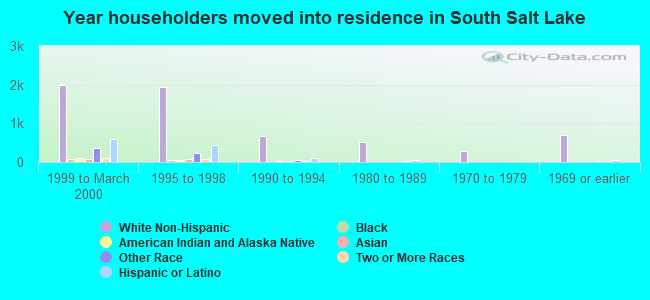
House/condo owner moved in on average 7 years ago
Renter moved in on average 3 years ago
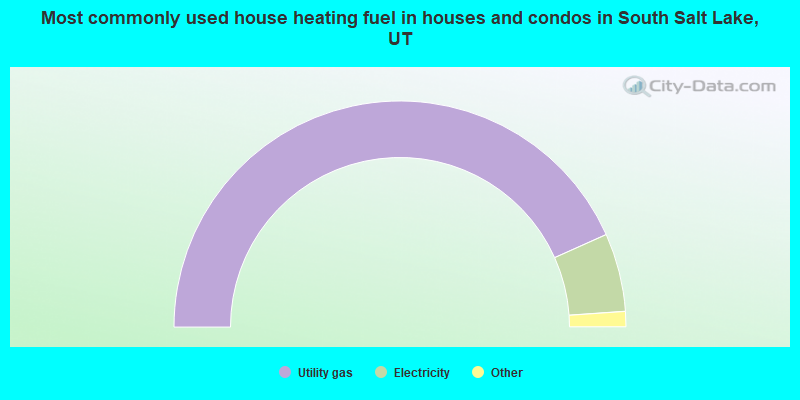
- 86.6%Utility gas
- 11.2%Electricity
- 1.4%Bottled, tank, or LP gas
- 0.8%Solar energy
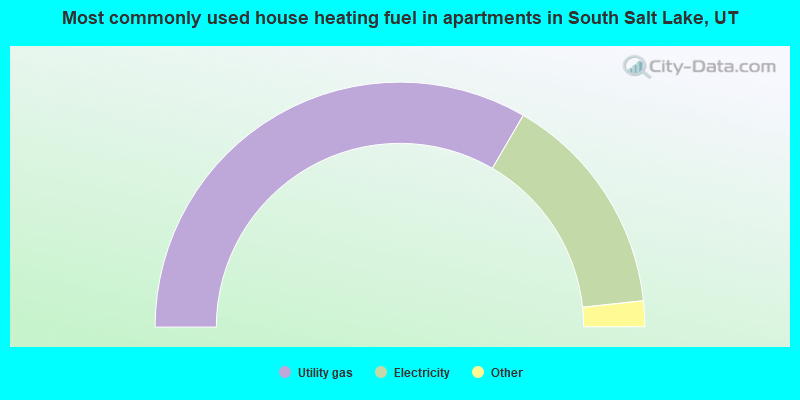
- 66.8%Utility gas
- 29.8%Electricity
- 3.0%Bottled, tank, or LP gas
- 0.3%Fuel oil, kerosene, etc.
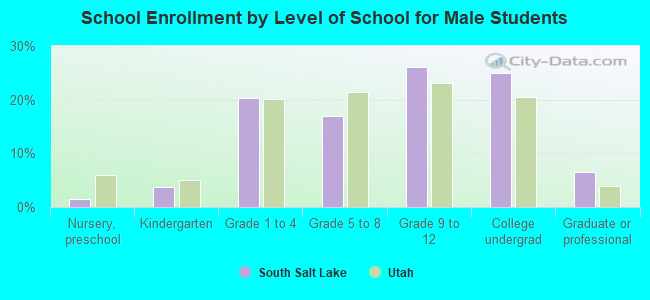
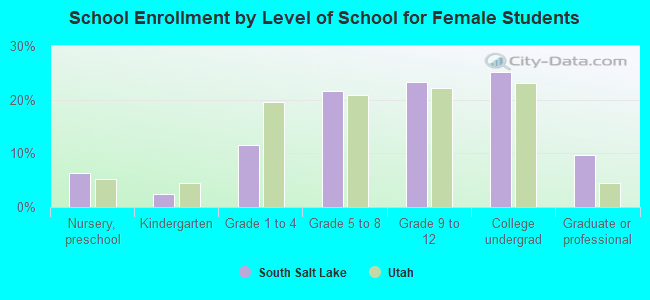
Private vs. public school enrollment:
| Here: | 2.6% |
| Utah: | 7.2% |
| Here: | 4.8% |
| Utah: | 5.3% |
| Here: | 9.6% |
| Utah: | 26.7% |